. 2021 Jun 2;4(1):666.
doi: 10.1038/s42003-021-02114-0.

Aberrant activity of mitochondrial NCLX is linked to impaired synaptic transmission and is associated with mental retardation

Affiliations

Aberrant activity of mitochondrial NCLX is linked to impaired synaptic transmission and is associated with mental retardation

Alexandra Stavsky et al. Commun Biol. .

Erratum in

Abstract

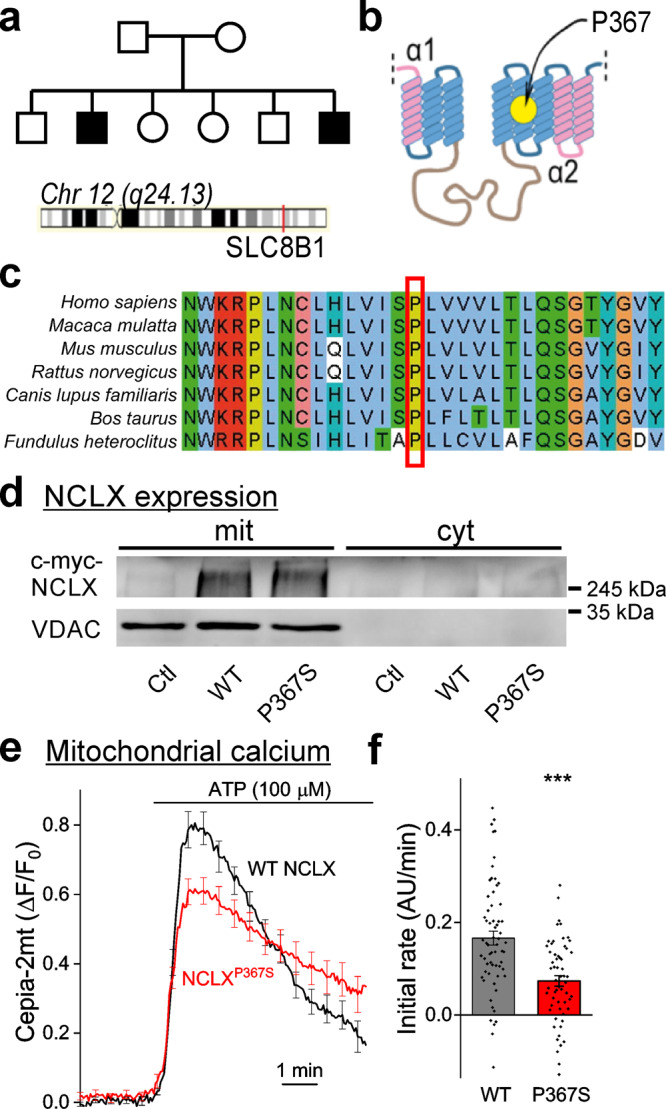
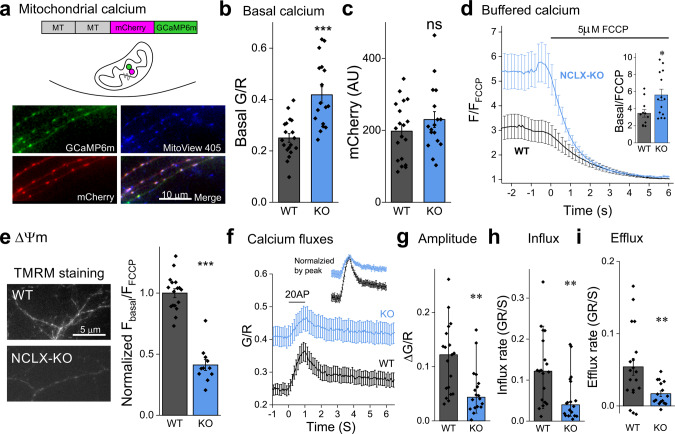
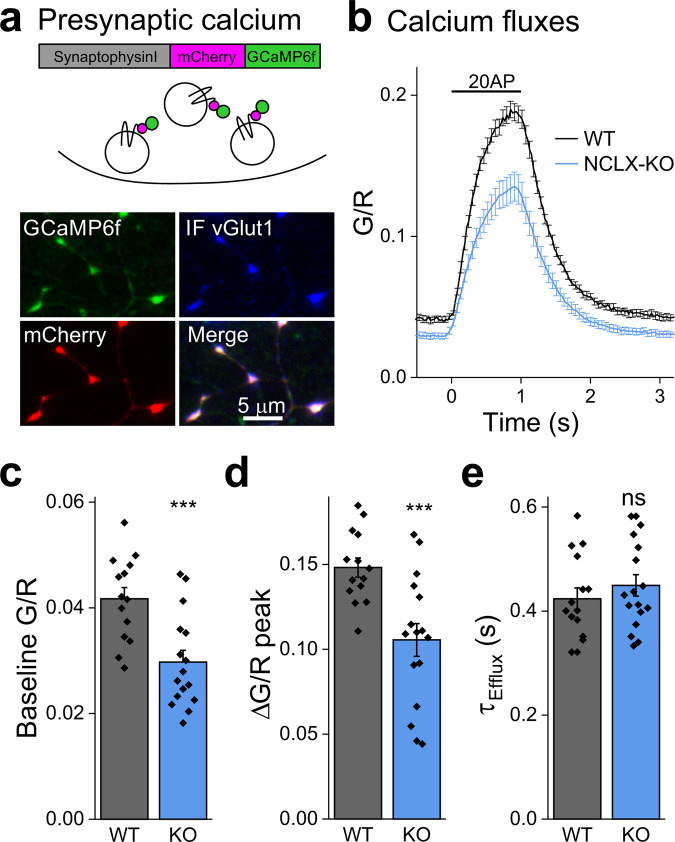
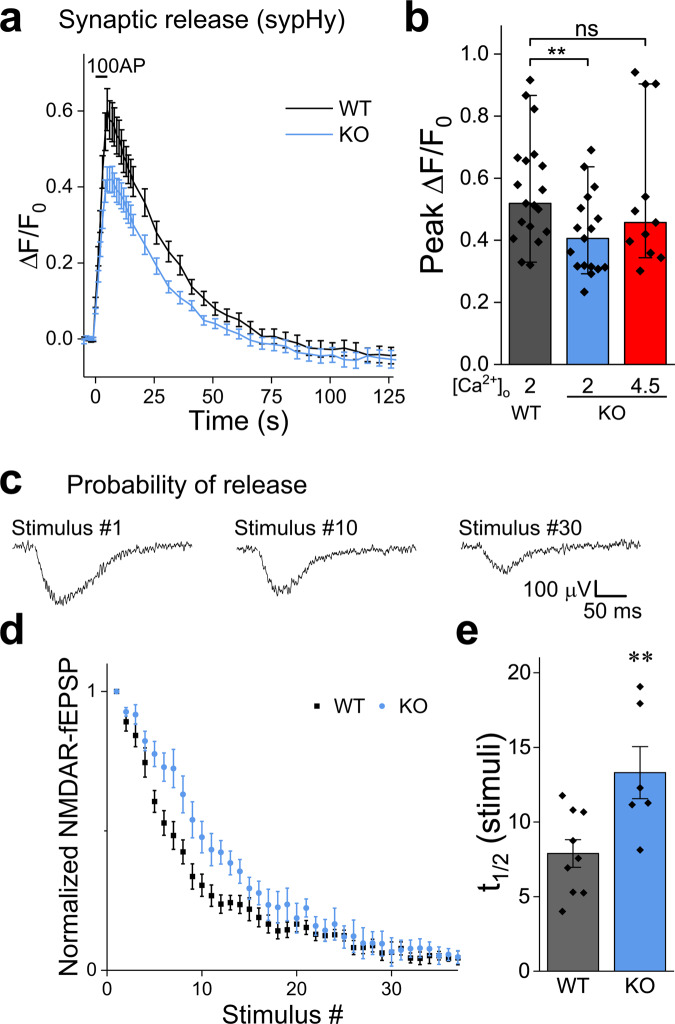
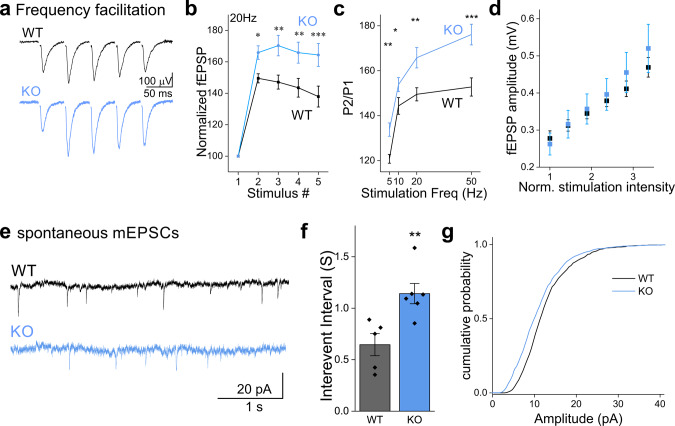
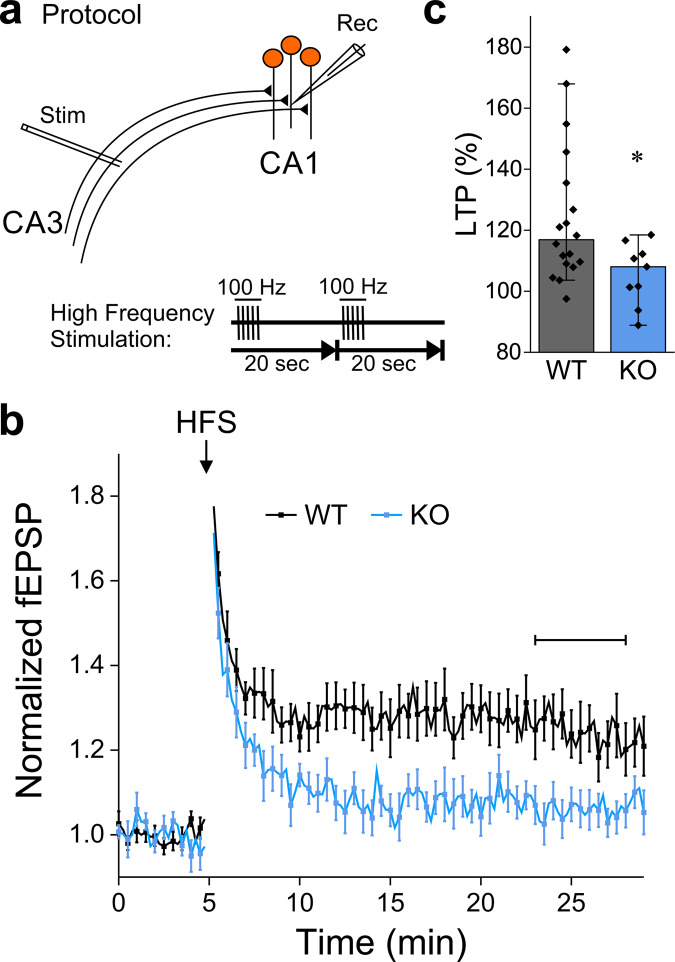
Calcium dynamics control synaptic transmission. Calcium triggers synaptic vesicle fusion, determines release probability, modulates vesicle recycling, participates in long-term plasticity and regulates cellular metabolism. Mitochondria, the main source of cellular energy, serve as calcium signaling hubs. Mitochondrial calcium transients are primarily determined by the balance between calcium influx, mediated by the mitochondrial calcium uniporter (MCU), and calcium efflux through the sodium/lithium/calcium exchanger (NCLX). We identified a human recessive missense SLC8B1 variant that impairs NCLX activity and is associated with severe mental retardation. On this basis, we examined the effect of deleting NCLX in mice on mitochondrial and synaptic calcium homeostasis, synaptic activity, and plasticity. Neuronal mitochondria exhibited basal calcium overload, membrane depolarization, and a reduction in the amplitude and rate of calcium influx and efflux. We observed smaller cytoplasmic calcium transients in the presynaptic terminals of NCLX-KO neurons, leading to a lower probability of release and weaker transmission. In agreement, synaptic facilitation in NCLX-KO hippocampal slices was enhanced. Importantly, deletion of NCLX abolished long term potentiation of Schaffer collateral synapses. Our results show that NCLX controls presynaptic calcium transients that are crucial for defining synaptic strength as well as short- and long-term plasticity, key elements of learning and memory processes.


Conflict of interest statement

The authors declare no competing interests.

Figures

Fig. 1
Fig. 1. Genetic variation in human NCLX is linked to mental retardation and affects mitochondrial calcium efflux rates.
a Genealogical tree of the affected family. Affected retarded siblings are marked in black. The location of the SLC8B1 gene in chromosome 12 is indicated. Both parents are carriers of the P367S variant of NCLX. b Predicted structure of NCLX. Yellow circle—location of P367 in the putative fifth transmembrane α-helix, adjacent to the catalytic site of NCLX. c P367 is phylogenetically conserved. Sequence alignment of a protein segment around P367 (red square) in various mammals and in fish illustrating its conservation across vertebrate species. d NCLX expression levels in HEK293T cells. Representative Western blot (n = 3 independent samples) of HEK cells expressing myc-WT NCLX (WT) or myc-NCLXP367S (P367S). mit – mitochondrial fraction (positive for the mitochondrial marker VDAC), cyt – cytoplasmic fraction (negative for VDAC). Anti myc immunoblotting revealed similar expression levels. Ctl – cells transfected with a control plasmid (pcDNA3.1 + ). e SH-SY5Y cells expressing NCLXP367S exhibit slower mitochondrial calcium efflux. Cepia2-mt and WT NCLX or NCLXP367S were co-expressed in SH-SY5Y cells in which the endogenous NCLX was knocked down by shRNA, and mitochondrial transients (Cepia2-mt fluorescence) were induced by bath application of ATP (n = 62 and 59 WT and P367S traces, mean ± SEM ΔF/F0). f Quantification of calcium efflux rates in e. A linear fit of a 150 s period after calcium levels started to decline served to determine the initial calcium efflux rate (0.166 ± 0.016, 0.073 ± 0.011 arbitrary units/minute in WT-NCLX and NCLXP367S expressing cells). ***p = 8e–6, Mann–Whitney u test (Z = −4.45, U = 990).
Fig. 2
Fig. 2. NCLX deletion increases resting mitochondrial calcium levels, depolarizes mitochondria and weakens calcium clearance during neuronal activity.
a Ratiometric measurement of mitochondrial calcium using MitoRGCaMP. MitoRGCaMP includes two mitochondrial targeting sequences (MT), calcium-insensitive mCherry and GcAMP6m, inducing localization of MitoRGCaMP to the mitochondrial matrix. Shown is an example of axons of WT primary hippocampal neurons expressing MitoRGCaMP to which the vital stain MitoView 405 was applied to label mitochondria, illustrating that the green and red components of MitoRGCaMP colocalize within the mitochondria. b Deletion of NCLX increases basal mitochondrial calcium levels. Quantification of the ratio between the fluorescence intensity of GCaMP6m (G) and that of mCherry (R) in the mitochondria of resting neurons in WT and NCLX-KO neurons (0.25 ± 0.02, 0.42 ± 0.03 mean ± SEM G/R), n = 17 and 19, respectively, ~50 mitochondria each, ***p = 2e–5, two-sided Student’s t test (t = −4.832, DF = 34). c Mitochondrial volume is unaffected by deletion of NCLX. Quantification of the fluorescence values of the calcium-insensitive mCherry component of MitoRGCaMP in the axonal mitochondria (as in (b)). No significant difference was observed between WT and NCLX-KO mitochondria (197.7 ± 18.3, 230.1 ± 22.2 mean ± SEM AU), n = 17 and 19, respectively, ~50 mitochondria each, ns p = 0.27, two-sided Student’s t test (t = −1.133, DF = 34). d Buffered calcium levels in axonal NCLX-KO mitochondria are lower. Depolarizing the mitochondria by bath application of FCCP (bar) leads to a leak of buffered mitochondrial calcium. FCCP was applied to neurons expressing MitoGCaMP6m in the absence of extracellular calcium to avoid mitochondrial calcium transients related to influx of calcium into the cytoplasm during plasma-membrane depolarization. Fluorescence intensity (F) per each mitochondrion was normalized by the value measured during the FCCP-induced plateau (FFCCP). Inset: Ratio of fluorescence measured before and after the application of FCCP (3.46 ± 0.44, 5.61 ± 0.68 mean ± SEM F/FFCCP), n = 11 and 14, respectively, >75 mitochondria each, *p = 0.021, two-sided Student’s t test (t = −2.487, DF = 23). e Mitochondria in NCLX-KO neurons are depolarized. Shown are representative fluorescence images of NCLX-KO and WT cultured hippocampal neurons bathed with the ∆Ψm indicator TMRM. FCCP was applied after baseline imaging to normalize the signal, as in (d). Initial F/FFCCP values were lower in NCLX KO neurons (1 ± 0.03, 0.41 ± 0.04 mean ± SEM, normalized by average WT value), n = 17 and 11, respectively, >25 mitochondria each, ***p = 1e–10, two-sided Student’s t test (t = 10.35, DF = 26). f Action-potential induced influx and efflux of calcium into mitochondria. Cultured hippocampal neurons expressing MitoRGCaMP were stimulated for 1 s at 20 Hz (bar) in the presence of APV and DNQX to block recurrent activity. Of note, the baseline value for the two genotypes is different (see (b)). Shown are mean ± SEM G/R traces. Image acquisition rate was 17.5 Hz. Inset: the same traces normalized by the peak of each trace. g Mitochondrial calcium transients in NCLX-KO neurons are smaller. ΔG/R (peak- baseline) values, n = 19 and 18, respectively, ~50 mitochondria each, **p = 0.0037, Mann–Whitney test (U = 267, Z = 2.902), bars indicate medians and the error bars the 10–90 percentiles. h Calcium influx rate in NCLX-KO neurons is slower. Initial calcium influx rates, each calculated by performing a linear fit of the fluorescence values during the first 0.5 s of stimulation, n = 19 and 18, respectively, ~50 mitochondria each, **p = 0.0032, Mann–Whitney test (U = 266, Z = 2.872), bars indicate medians and the error bars the 10–90 percentiles. i Calcium efflux rate in NCLX-KO neurons is slower. Initial calcium efflux rates, each calculated by performing a linear fit of the fluorescence values during the first 0.5 s after cessation of stimulation (0.054 ± 0.012, 0.017 ± 0.004 mean ± SEM GR/S), n = 19 and 16, respectively, ~50 mitochondria each, **p = 0.008, two-sided Student’s t test (t = −2.812, DF = 33).
Fig. 3
Fig. 3. Basal and activity-induced cytoplasmic presynaptic calcium levels in WT and NCLX-KO neurons.
a Ratiometric measurement of cytoplasmic presynaptic calcium using SyRGCaMP. SyRGCaMP is constructed of synaptophysin I, mCherry (R) and GCaMP6f (G). Middle—SyRGCaMP is localized to synaptic vesicles. Shown is a representative image of synapses of WT primary neurons infected with SyRGCaMP and immunostained for vGlut1, a synaptic vesicle protein (blue), showing localization of SyRGCaMP on SVs. b Stimulation-induced synaptic calcium transients. WT and NCLX-KO neurons expressing SyRGCaMP were stimulated at 20 Hz for 1 s (bar). GCaMP6f fluorescence (G) was measured throughout and divided by mCherry fluorescence ratio (R), producing the (G/R) ratio. Shown are mean ± SEM G/R traces of n = 14 and 16 experiments, respectively, >55 boutons each. c Basal cytoplasmic calcium is lower in presynaptic terminals of NCLX-KO neurons. Distribution of mean basal G/R values calculated in 20 images acquired prior to stimulation, as in (b) (0.042 ± 0.002, 0.029 ± 0.002 mean ± SEM G/R), ***p = 0.0006, two-sided Student’s t test (t = 3.852, DF = 28). d Calcium transients are smaller in presynaptic terminals of NCLX-KO neurons. Increase in G/R values from baseline to peak, as in (b) (0.148 ± 0.006, 0.106 ± 0.010 mean ± SEM G/R), ***p = 0.001, two-sided Student’s t test (t = 3.67, DF = 28). e Calcium extrusion time constant unaffected by NCLX deletion. Time constants of the decay in G/R over time in (b), calculated by fitting a single exponent function to each trace (0.43 ± 0.02, 0.44 ± 0.02 mean ± SEM second), ns p = 0.73, two-sided Student’s t test (t = −0.344, DF = 28).
Fig. 4
Fig. 4. Deletion of NCLX weakens synaptic release and the lowers the initial release probability.
a SypHy responses are weaker in NCLX-KO neurons. WT and NCLX-KO neurons expressing sypHy were stimulated at 20 Hz for 5 s in 2 mM Ca2+ saline. Shown are mean ± SEM sypHy traces. SypHy responses in the synapses of NCLX-KO neurons were lower. b Quantification of peak sypHy responses. Peak ∆F/F0 fluorescence, as in (a) and sypHy responses in NCLX-KO neurons bathed in [Ca2+]o = 4.5 mM shown in red, n = 19, 17 and 11, respectively, ~50 mitochondria each, p = 0.04 Kruskal-Wallis multiple comparison ANOVA (Chi-square = 6.42), post-hoc analysis using Mann–Whitney tests, **p = 0.01 (U = 243, Z = 2.57), ns p = 0.52 (U = 120, Z = 0.65), bars indicate medians and the error bars the 10–90 percentiles. c Progressive blockage of NMDARs by MK-801 used to assess Pr. The initial Pr of Schaffer collateral synapses onto CA1 neurons was assessed by bathing slices in magnesium-free saline containing MK-801, DNQX and bicuculline. Stimulation was delivered every 15 S and NMDAR-fEPSPs were recorded. Shown are representative traces recorded from a brain slice of a WT mouse in response to the 1st, 10th and 30th stimuli, illustrating the progressive blockage of NMDARs by MK-801. d The initial synaptic probability of release (Pr) is lower in NCLX-KO neurons. NMDAR response amplitudes as a function of stimulus number, illustrating the different rate of progressive blockage of NMDAR-fEPSPs in WT and NCLX-KO neurons. mean ± SEM, n = 9 and 6 recordings from 4 WT and 3 NCLX-KO mice, respectively. e Half-life of NMDAR response blockage in (d) (7.89 ± 0.92, 13.31 ± 1.74, mean ± SEM in terms of stimulus number), **p = 0.01, two-sided Student’s t test (t = −2.99, DF = 13).
Fig. 5
Fig. 5. Synapses in NCLX-KO slices exhibit higher frequency-facilitation and more frequent spontaneous activity.
a Representative fEPSPs recorded from the CA1 area when delivering 5 stimuli to the Schaffer collaterals at 20 Hz in acute slices prepared from WT (black) and NCLX-KO (blue) mice (stimulation artifact was blanked). b Frequency-facilitation is higher in NCLX-KO slices. fEPSP amplitudes normalized by first response in each train (mean ± SEM), in WT and NCLX-KO slices stimulated at 20 Hz (n = 22 and 22 recordings from 8 WT and 9 NCLX-KO mice, respectively). The stimulation intensity in each train was set to produce an initial response of ~0.3 mV (see d). p < 0.001, two-way repeated-measures ANOVA (F = 2452, DF = 1,21) with Tukey’s post-hoc analysis: p = 0.029, 0.002, 0.003, 0.0006 (t = 3.15, 4.48, 4.31, 5.11; DF = 63), respectively. c PPR is higher in NCLX-KO slices. Quantification of the P2/P1 ratio obtained at various stimulation frequencies. Stronger facilitation was observed in NCLX-KO slices at all frequencies. 5 Hz: **p = 0.002 two-sided Student’s t test (n = 23,25, t = −3.24, DF = 46), 10 Hz: *p = 0.015 (n = 21,18, t = −2.549, DF = 37); 20 Hz: **p = 0.003 (n = 22,22, t = −3.14, DF = 42); 50 Hz: ***p = 0.0005 (n = 19,18, t = −3.82, DF = 35). d Response/input plot. The fEPSP response amplitude (±sem) is plotted as a function of the stimulation intensity (n = 7 WT, n = 11 NCLX KO). The stimulation intensity is normalized by the intensity in (mA) producing a response of ~0.3 mV in each slice. The graph illustrates that the responses are not saturated in both WT and NCLX-KO slices. e Intracellular recording of spontaneous mEPSCs. Representative traces recorded from WT (black) and NCLX-KO (blue) slices under resting conditions, in the presence of TTX. f Interevent intervals in NCLX-KO slices are longer. Interevent intervals were averaged in n = 5 and 6 slice recordings from 3 WT and NCLX-KO mice (0.65 ± 0.11, 1.14 ± 0.10 mean ± SEM sec), **p = 0.0079, two-sided Student’s t test (t = −3.397, DF = 9). g mEPSC amplitudes are smaller in NCLX-KO slices. Cumulative plot of the mEPSC amplitudes recorded in WT and in NCLX-KO slices (n = 990 and 978 events, respectively). ***p < 0.001, Kolmogorov–Smirnov test (D = 0.163, Z = 3.61).
Fig. 6
Fig. 6. NCLX-KO slices fail to exhibit hippocampal Schaffer-collateral LTP.
a Schematic representation of extracellular recordings (fEPSP) from Schaffer collateral synapses in the CA1 area of acute hippocampal slices. The high-frequency stimulation (HFS) LTP induction protocol (5 pulses at 100 Hz, repeated once after 20 s) is shown below. b fEPSPs were evoked every 15 s, responses were normalized by baseline values. The CA3 area was stimulated to evoke fEPSP of ~0.3 mV. After 5 min of baseline recording, LTP was induced by HFS (arrow). Shown are mean ± SEM responses in WT (n = 18 slices from 7 mice) and NCLX-KO (n = 9 from 4 mice). c LTP in NCLX-KO slices is abolished. LTP during the horizontal bar in (b), n = 18 and 9 recordings, respectively, *p = 0.029, Mann–Whitney u test (U = 124, Z = 2.19), bars indicate medians and the error bars the 10–90 percentiles.

Similar articles

Cited by

References

    1. Jahn R, Fasshauer D. Molecular machines governing exocytosis of synaptic vesicles. Nature. 2012;490:201–207. - PMC - PubMed
    1. Katz B, Miledi R. Ionic requirements of synaptic transmitter release. Nature. 1967;215:651. - PubMed
    1. Südhof TC. Neurotransmitter release: the last millisecond in the life of a synaptic vesicle. Neuron. 2013;80:675–690. - PMC - PubMed
    1. Katz B, Miledi R. Spontaneous and evoked activity of motor nerve endings in calcium Ringer. J. Physiol. 1969;203:689–706. - PMC - PubMed
    1. Baker PF. Transport and metabolism of calcium ions in nerve. Prog. Biophys. Mol. Biol. 1972;24:177–223. - PubMed

Publication types

MeSH terms