HTNV infection of CD8+ T cells is associated with disease progression in HFRS patients
- PMID: 34079056
- PMCID: PMC8173013
- DOI: 10.1038/s42003-021-02182-2
HTNV infection of CD8+ T cells is associated with disease progression in HFRS patients
Abstract
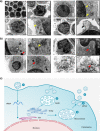
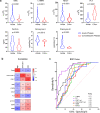
Hantaan viruses (HTNVs) are zoonotic pathogens transmitted mainly by rodents and capable of infecting humans. Increasing knowledge of the human response to HTNV infection can guide the development of new preventative vaccines and therapeutic strategies. Here, we show that HTNV can infect CD8+ T cells in vivo in patients diagnosed with hemorrhagic fever with renal syndrome (HFRS). Electron microscopy-mediated tracking of the life cycle and ultrastructure of HTNV-infected CD8+ T cells in vitro showed an association between notable increases in cytoplasmic multivesicular bodies and virus production. Notably, based on a clinical cohort of 280 patients, we found that circulating HTNV-infected CD8+ T cell numbers in blood were proportional to disease severity. These results demonstrate that viral infected CD8+ T cells may be used as an adjunct marker for monitoring HFRS disease progression and that modulating T cell functions may be explored for new treatment strategies.
Conflict of interest statement
The authors declare no competing interests.
Figures


Similar articles
-
Levels of HTNV-specific CD8+ T lymphocytes in PBMC from the patients with hemorrhagic fever with renal syndrome.Intern Emerg Med. 2013 Sep;8(6):503-8. doi: 10.1007/s11739-011-0633-4. Epub 2011 Jun 8. Intern Emerg Med. 2013. PMID: 21655928
-
CD8low CD100- T Cells Identify a Novel CD8 T Cell Subset Associated with Viral Control during Human Hantaan Virus Infection.J Virol. 2015 Dec;89(23):11834-44. doi: 10.1128/JVI.01610-15. Epub 2015 Sep 16. J Virol. 2015. PMID: 26378166 Free PMC article.
-
IL-15 induced bystander activation of CD8+ T cells may mediate endothelium injury through NKG2D in Hantaan virus infection.Front Cell Infect Microbiol. 2022 Dec 15;12:1084841. doi: 10.3389/fcimb.2022.1084841. eCollection 2022. Front Cell Infect Microbiol. 2022. PMID: 36590594 Free PMC article.
-
Hemorrhagic Fever with Renal Syndrome: Pathogenesis and Clinical Picture.Front Cell Infect Microbiol. 2016 Feb 3;6:1. doi: 10.3389/fcimb.2016.00001. eCollection 2016. Front Cell Infect Microbiol. 2016. PMID: 26870699 Free PMC article. Review.
-
Potential clinical biomarkers in monitoring the severity of Hantaan virus infection.Cytokine. 2023 Oct;170:156340. doi: 10.1016/j.cyto.2023.156340. Epub 2023 Aug 20. Cytokine. 2023. PMID: 37607412 Review.
Cited by
-
HTNV infection induces activation and deficiency of CD8+MAIT cells in HFRS patients.Clin Exp Immunol. 2023 Mar 8;211(1):1-14. doi: 10.1093/cei/uxac111. Clin Exp Immunol. 2023. PMID: 36480318 Free PMC article.
-
Vascular dysfunction in hemorrhagic viral fevers: opportunities for organotypic modeling.Biofabrication. 2024 Jun 5;16(3):032008. doi: 10.1088/1758-5090/ad4c0b. Biofabrication. 2024. PMID: 38749416 Free PMC article. Review.
-
A pan-orthohantavirus human lung xenograft mouse model and its utility for preclinical studies.PLoS Pathog. 2025 Jan 22;21(1):e1012875. doi: 10.1371/journal.ppat.1012875. eCollection 2025 Jan. PLoS Pathog. 2025. PMID: 39841788 Free PMC article.
-
Characteristics of the Hantaan virus complicated with SARS-CoV2 infection: A case series report.Heliyon. 2024 Feb 27;10(5):e26618. doi: 10.1016/j.heliyon.2024.e26618. eCollection 2024 Mar 15. Heliyon. 2024. PMID: 38455539 Free PMC article.
-
Nlrc3 Knockout Mice Showed Renal Pathological Changes After HTNV Infection.Front Immunol. 2021 Jul 16;12:692509. doi: 10.3389/fimmu.2021.692509. eCollection 2021. Front Immunol. 2021. PMID: 34335602 Free PMC article.
References
Publication types
MeSH terms
Substances
Grants and funding
LinkOut - more resources
Full Text Sources
Research Materials

