. 2021 Jun;40(24):4229-4241.
doi: 10.1038/s41388-021-01773-x. Epub 2021 Jun 2.

WNT5A inhibition alters the malignant peripheral nerve sheath tumor microenvironment and enhances tumor growth

Affiliations

WNT5A inhibition alters the malignant peripheral nerve sheath tumor microenvironment and enhances tumor growth

Craig S Thomson et al. Oncogene. 2021 Jun.

Abstract

Malignant peripheral nerve sheath tumors (MPNST) are aggressive soft-tissue sarcomas that cause significant mortality in adults with neurofibromatosis type 1. We compared gene expression of growth factors in normal human nerves to MPNST and normal human Schwann cells to MPNST cell lines. We identified WNT5A as the most significantly upregulated ligand-coding gene and verified its protein expression in MPNST cell lines and tumors. In many contexts WNT5A acts as an oncogene. However, inhibiting WNT5A expression using shRNA did not alter MPNST cell proliferation, invasion, migration, or survival in vitro. Rather, shWNT5A-treated MPNST cells upregulated mRNAs associated with the remodeling of extracellular matrix and with immune cell communication. In addition, these cells secreted increased amounts of the proinflammatory cytokines CXCL1, CCL2, IL6, CXCL8, and ICAM1. Versus controls, shWNT5A-expressing MPNST cells formed larger tumors in vivo. Grafted tumors contained elevated macrophage/stromal cells, larger and more numerous blood vessels, and increased levels of Mmp9, Cxcl13, Lipocalin-1, and Ccl12. In some MPNST settings, these effects were mimicked by targeting the WNT5A receptor ROR2. These data suggest that the non-canonical Wnt ligand WNT5A inhibits MPNST tumor formation by modulating the MPNST microenvironment, so that blocking WNT5A accelerates tumor growth in vivo.


Conflict of interest statement

DISCLOSURE OF POTENTIAL CONFLICTS OF INTEREST: Revolution Medicine and Boehringer-Ingelheim fund some of NR’s research, unrelated to this manuscript. Dr. Largaespada is the co-founder and co-owner of biotechnology companies including NeoClone Biotechnologies, Inc., Discovery Genomics, Inc. (recently acquired by Immunsoft, Inc.), B-MoGen Biotechnologies, Inc. (recently acquired by the biotechne corporation), and Luminary Therapeutics, Inc. He consults for Genentech, Inc., which is funding some of his research. Dr. Largaespada holds equity in and serves as the Chief Scientific Officer of Surrogen, a subsidiary of Recombinetics, a genome-editing company. The business of all these companies is unrelated to the contents of this manuscript.

Conflict of Interests

Revolution Medicine and Boehringer-Ingelheim fund some of NR’s research, unrelated to this manuscript. Dr. Largaespada is the co-founder and co-owner of biotechnology companies including NeoClone Biotechnologies, Inc., Discovery Genomics, Inc. (recently acquired by Immunsoft, Inc.), B-MoGen Biotechnologies, Inc. (recently acquired by the biotechne corporation), and Luminary Therapeutics, Inc. He consults for Genentech, Inc., which funds some of his research and holds equity in and serves as the Chief Scientific Officer of Surrogen, a subsidiary of Recombinetics, a genome-editing company. The business of these companies is unrelated to this manuscript.

Figures

Figure 1 –
Figure 1 –. Growth factors, specifically WNT5A, are differentially expressed in NF1-associated disease cells and tissues.
(a) Heatmaps show cells (left) and tissues (right). Data are expressed as log2 fold change relative to the average of the control group. (b) Plots show significant (p<0.05, two-way ANOVA) differential expression (>2x fold change to controls) of WNT5A in cells (left) and tissues (right). (c) Western blot analysis. rhWNT5A (4ng) served as positive control. Samples are normal human Schwann cells (339, 2–2, 303, 171), immortalized human Schwann cells (1λ, 2λ, and 9.511b C), and MPNST cell lines (STS-26T, S462-TY, ST88–14, 88–3, 90–8, and murine NPcis). β-actin as the loading control. (d) Quantification of protein expression compared to average NHSC values. Significance determined by one-way ANOVA followed by Dunnett’s multiple comparisons excluding “negative”. (e) Immunohistochemical stains of human tissue samples (normal nerve, pNF, MPNST, and S462-TY xenograft) using anti-WNT5A. Values show the number of samples showing positive staining over the total samples stained in a group. Scale bars are 50μm.
Figure 2 –
Figure 2 –. shWNT5A-treated MPNST cell lines grow larger in vivo.
(a) qRT-PCR showing WNT5A levels (shWNT5A #15 and #17) versus shNT in stable shRNA-expressing STS-26T and S462-TY cell lines (mean and SD, p<0.001 two-way ANOVA with Dunnett’s multiple comparisons; three independent experiments/sample). (b) Example Western blot verification of shRNA efficiency. (c) Quantification of 3 individual Western blots (one shown in (b)). Data shown are average and SD of 3 independent experiments (p<0.001 and p=0.04), via two-tailed multiple t-tests with Holm-Sidak correction for multiple comparisons. (d-e) Images of STS-26T and S462-TY xenografts and quantification of tumors volume (average and standard error of the mean (SEM) (p<0.001 two-way ANOVA; n provided in the figure). (f) qRT-PCR shows shWnt5a efficacy in stably selected NPcis cell lines in vitro (left). Western blot results show stably selected NPcis cell lysates with reduced Wnt5a protein expression using two shRNAs (right). (g) Tumor volumes, allografted shRNA-expressing NPcis cells injected into C57Bl/6 mice; average and SEM of biological replicates. Significance was determined using one-way ANOVA with Dunnett’s multiple comparisons test comparing shWnt5a-treated tumors against shNT-treated tumors. P-values are 0.035 and 0.086 respectively. Representative images of the tumors taken at sacrifice.
Figure 3 –
Figure 3 –. Knockdown of WNT5A results in upregulated factors associated with the microenvironment.
(a) Heat map shows significantly upregulated factors in shWNT5A vs. shNT in two MPNST cell lines (FDR<0.05, fold change >2x, n = 1 for each treatment group via modified paired t-tests). Data are shown as log2 fold change relative to the shNT controls (shNT controls not shown for visual clarity). (b) GO enrichment analysis of factors upregulated by shWNT5A. Insets show genes contained within the GO analysis hit.
Figure 4 –
Figure 4 –. shWNT5A-treated MPNST cell lines show enhanced secretion of cytokines.
(a; c) Human cytokine arrays show differences in secreted cytokines between the shWNT5A and shNT treatments in two stable shRNA expressing MPNST cell lines. Red boxes outline proteins of interest. (b; d) Quantification of (a; c) showing the average of technical replicates and the min and max of the data points normalized to shNT controls (n = 1 for each treatment group with two technical replicates).
Figure 5 –
Figure 5 –. Grafted tumors show enhanced presence of host cells.
(a) Representative shNT and shWNT5A expressing MPNST xenograft sections 1-week after injection. DAPI (blue), Iba-1 (green) and MPNST cells (red). (b) Quantification. Data shown are % total cells/3 fields/biological replicate. Data show average and SEM; (STS-26T n = 5 each shNT and shWNT5A, p=0.04 and S462-TY n = 3 shNT and 4 shWNT5A, p=0.10 multiple t-tests with Holm-Sidak correction for multiple comparisons). Statistics were generated on pooled macrophage/stroma groups. Pairwise comparison within cell groups not significant. (c) Images of MPNST cells (red), DAPI (blue), and CD31 (green). (d-e) Quantification of vessels (CD31); area counted in 3 visual fields/biological replicate. (f) Images of anti-CD31-stained NPcis tumor sections. (g) CD31+ vessel size (p=0.052 versus shNT) and (h) number (p=0.007 versus shNT). Data plotted as mean and SD of biological replicates. Significance was determined using one-way ANOVA with Dunnett’s multiple comparisons test. Scale bars are 50μm.
Figure 6 –
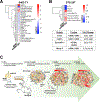
Figure 6 –. Cytokine analysis in the shWNT5A environment show increased Ccl12, Cxcl13, Mmp9, and Lipocalin-2.
(a-b) Heat maps from cytokine arrays show altered cytokines, hierarchically clustered by row. Log2 fold change is plotted versus shNT (left gray bars) and shWNT5A (right colored bars). Table of cytokines altered in both MPNST cell lines by shWNT5A (significance determined by multiple t-tests). (c) Summary graphic.

References

    1. Evans DG, Howard E, Giblin C, Clancy T, Spencer H, Huson SM, et al. Birth incidence and prevalence of tumor-prone syndromes: estimates from a UK family genetic register service. Am J Med Genet A. 2010;152A(2):327–332. - PubMed
    1. Brosseau JP, Liao CP, Wang Y, Ramani V, Vandergriff T, Lee M, et al. NF1 heterozygosity fosters de novo tumorigenesis but impairs malignant transformation. Nat Commun. 2018;9(1):5014. - PMC - PubMed
    1. Widemann BC. Current status of sporadic and neurofibromatosis type 1-associated malignant peripheral nerve sheath tumors. Curr Oncol Rep. 2009;11(4):322–328. - PMC - PubMed
    1. Bos JL, Rehmann H, Wittinghofer A. GEFs and GAPs: critical elements in the control of small G proteins. Cell. 2007;129(5):865–877. - PubMed
    1. Simanshu DK, Nissley DV, McCormick F. RAS Proteins and Their Regulators in Human Disease. Cell. 2017;170(1):17–33. - PMC - PubMed

Publication types

MeSH terms