. 2021 Jun;594(7863):430-435.
doi: 10.1038/s41586-021-03525-z. Epub 2021 Jun 2.

NOTUM from Apc-mutant cells biases clonal competition to initiate cancer

Affiliations

NOTUM from Apc-mutant cells biases clonal competition to initiate cancer

Dustin J Flanagan et al. Nature. 2021 Jun.

Abstract

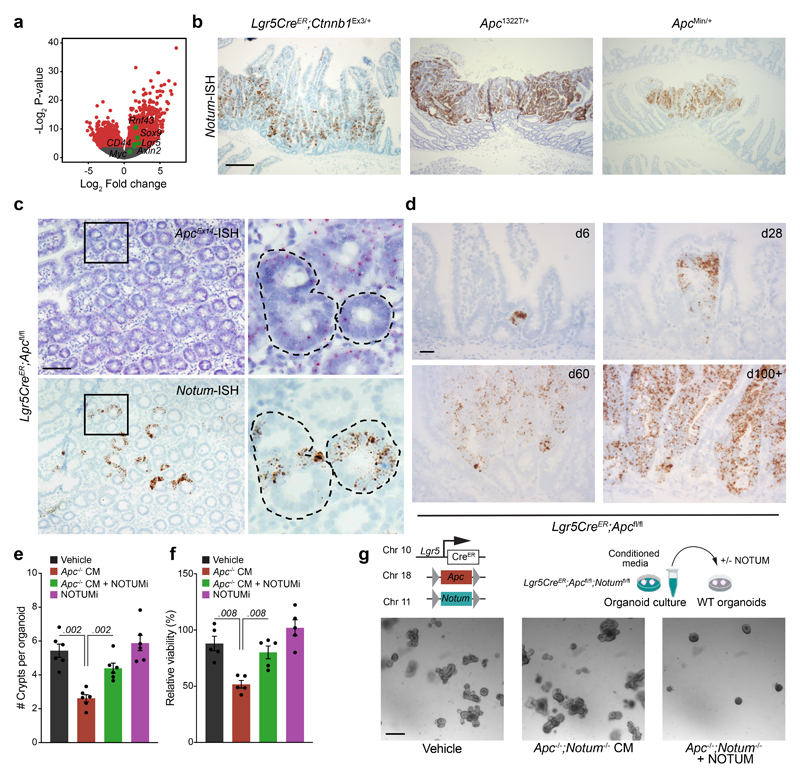
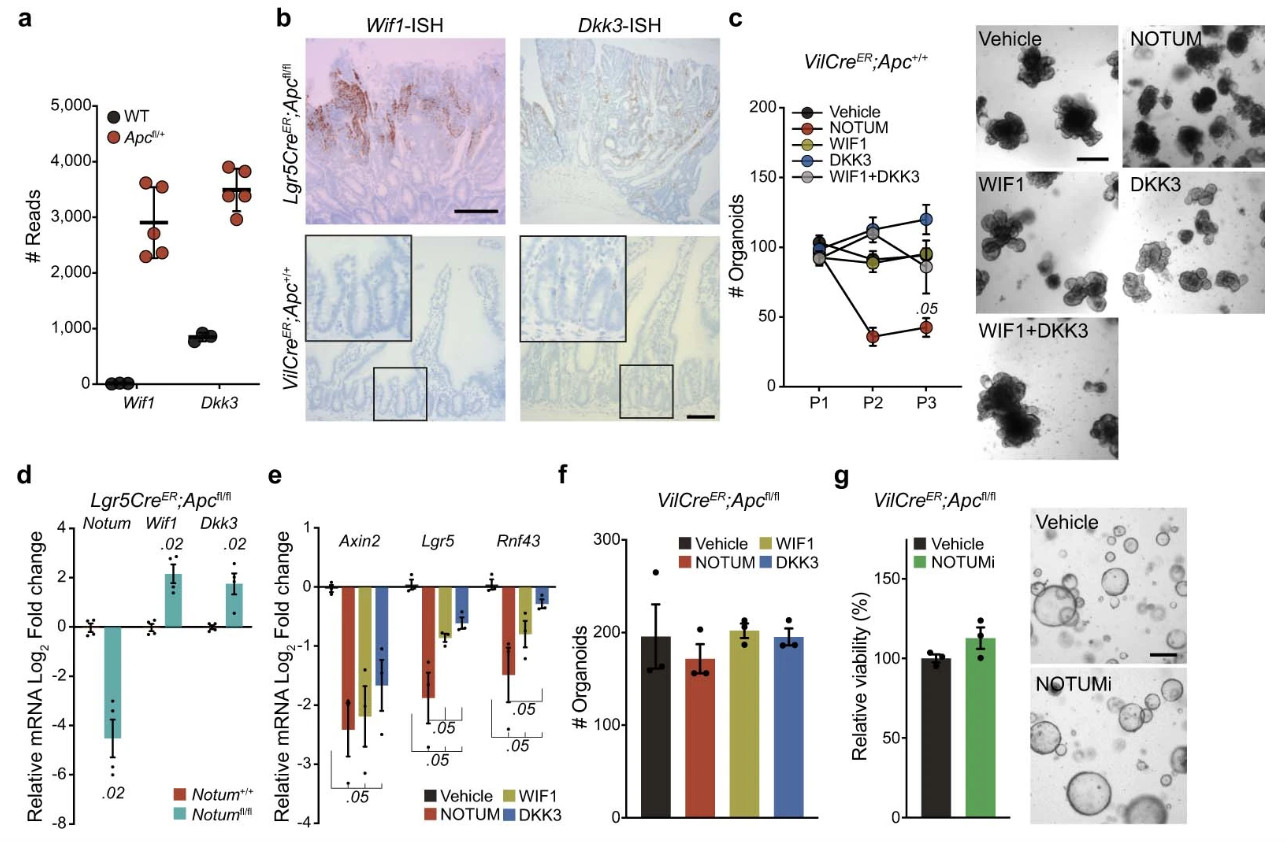
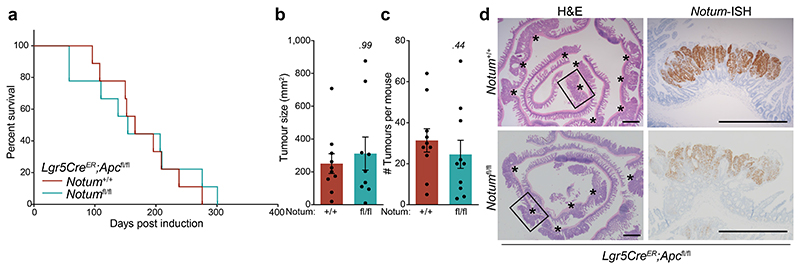
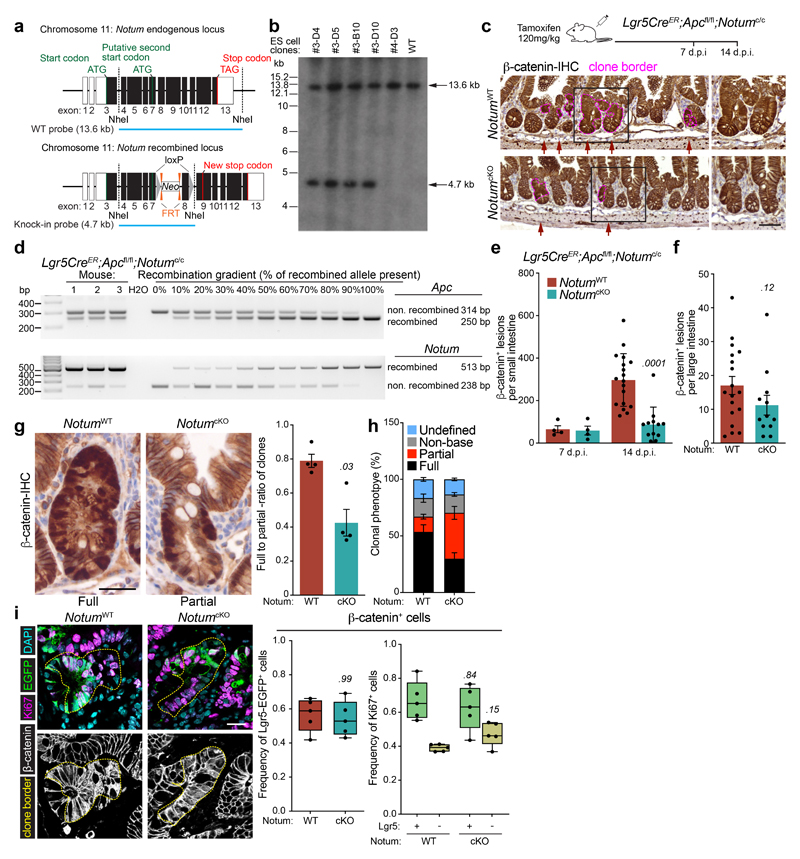
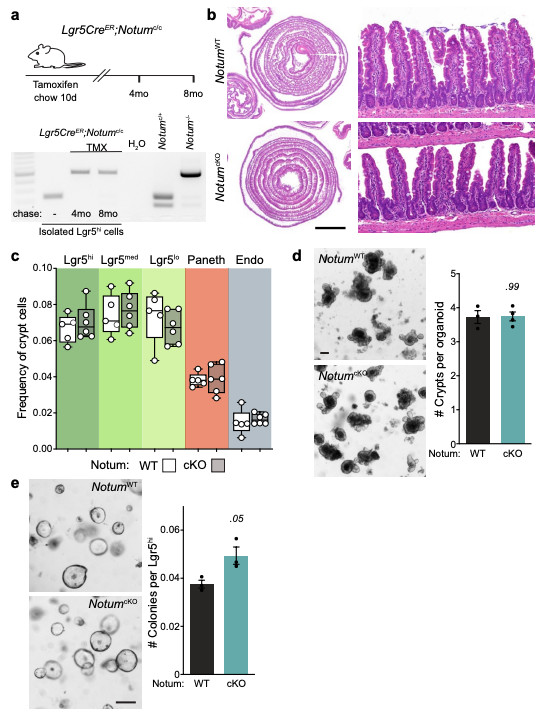
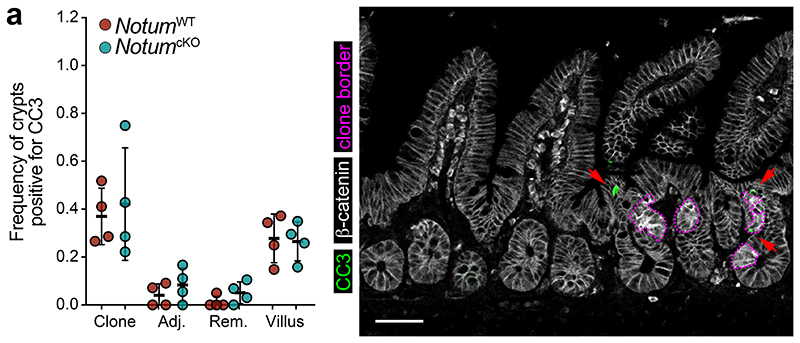
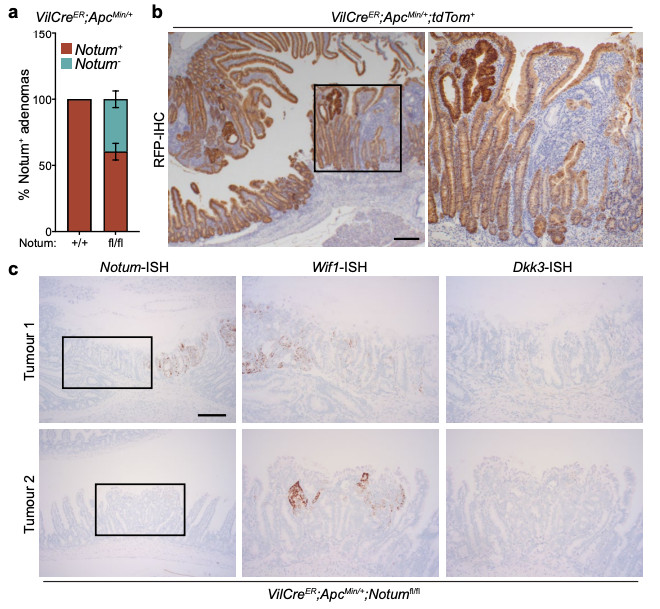
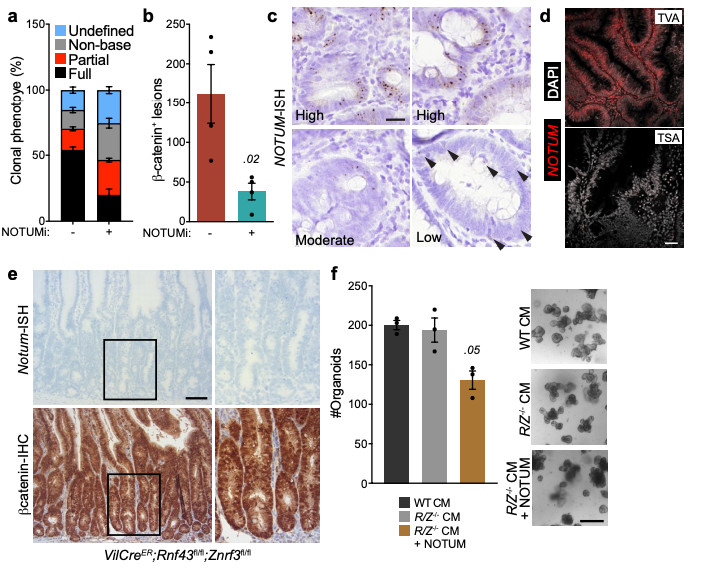
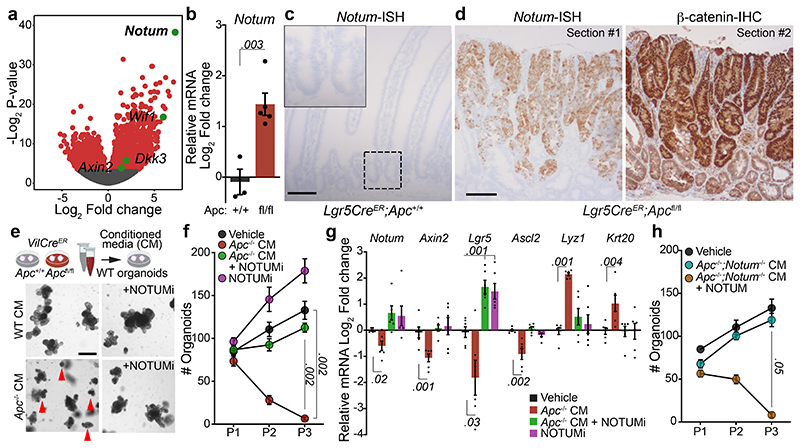
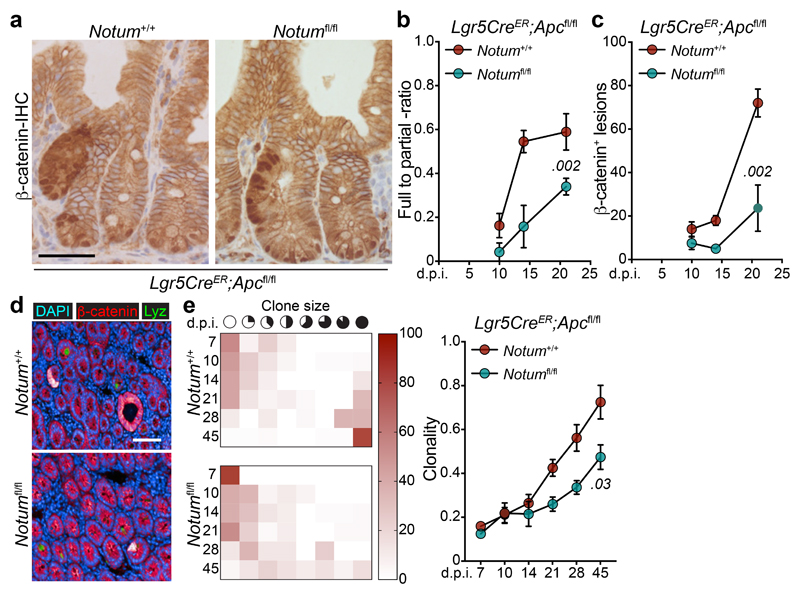
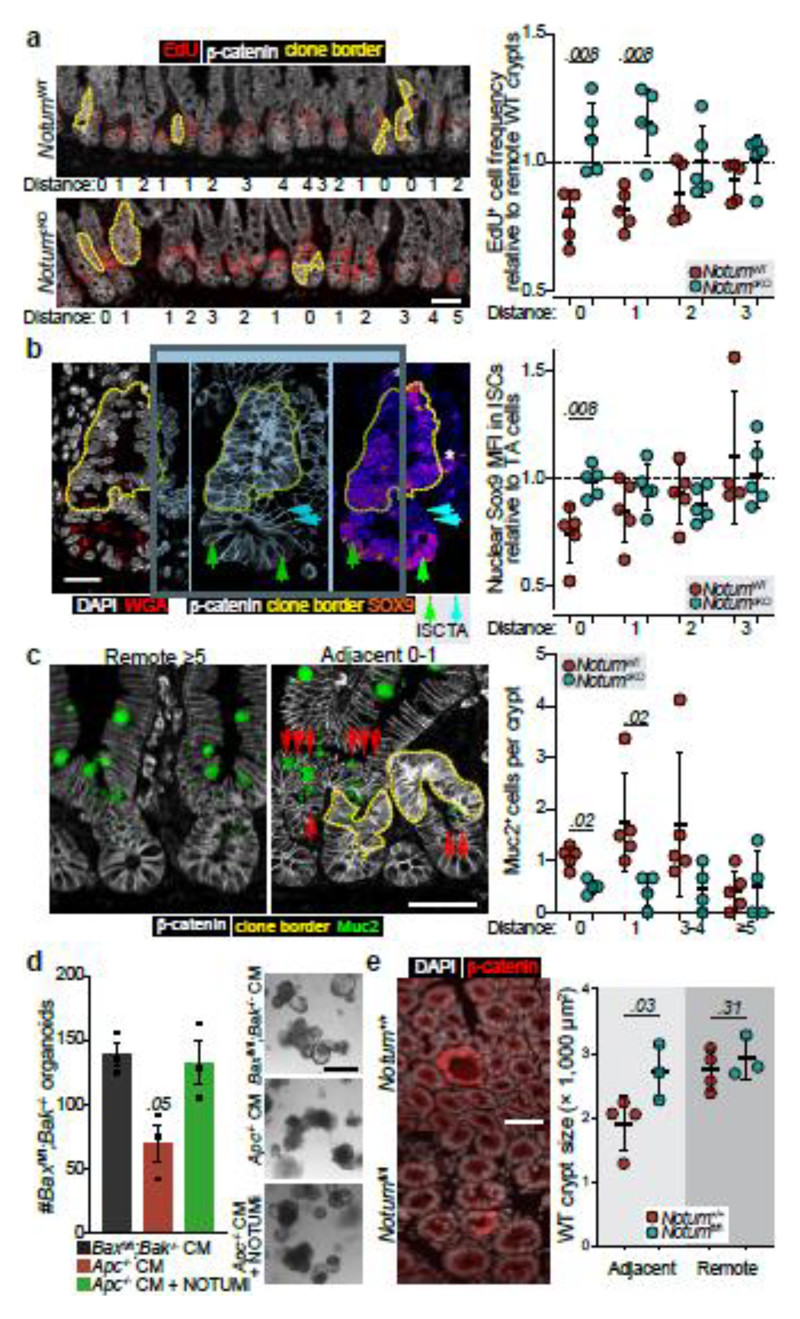
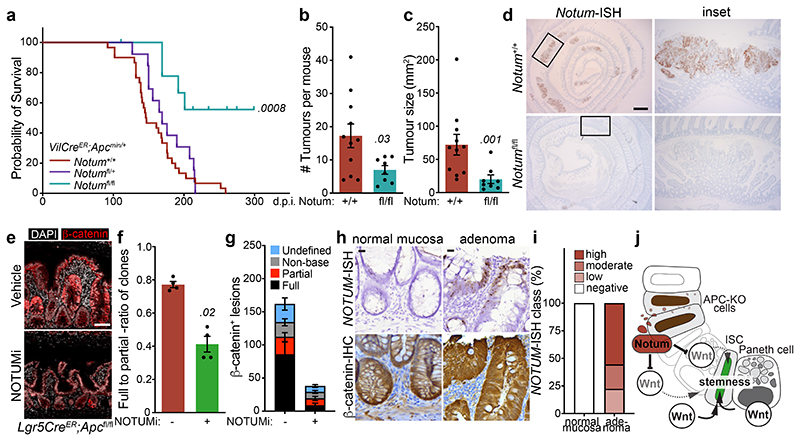
The tumour suppressor APC is the most commonly mutated gene in colorectal cancer. Loss of Apc in intestinal stem cells drives the formation of adenomas in mice via increased WNT signalling1, but reduced secretion of WNT ligands increases the ability of Apc-mutant intestinal stem cells to colonize a crypt (known as fixation)2. Here we investigated how Apc-mutant cells gain a clonal advantage over wild-type counterparts to achieve fixation. We found that Apc-mutant cells are enriched for transcripts that encode several secreted WNT antagonists, with Notum being the most highly expressed. Conditioned medium from Apc-mutant cells suppressed the growth of wild-type organoids in a NOTUM-dependent manner. Furthermore, NOTUM-secreting Apc-mutant clones actively inhibited the proliferation of surrounding wild-type crypt cells and drove their differentiation, thereby outcompeting crypt cells from the niche. Genetic or pharmacological inhibition of NOTUM abrogated the ability of Apc-mutant cells to expand and form intestinal adenomas. We identify NOTUM as a key mediator during the early stages of mutation fixation that can be targeted to restore wild-type cell competitiveness and provide preventative strategies for people at a high risk of developing colorectal cancer.


Conflict of interest statement

Competing interests

The authors have no competing interests to declare.

Figures

Extended Data Figure 1
Extended Data Figure 1. Notum secreted by Apc-mutant clones inhibits wild-type organoid growth.
a, Volcano plot of significantly differentially expressed Wnt-target genes (red dots) in Apc-mutant (VilCreER;Apcfl/+) tumour tissue compared to wild-type small intestine (n=3 WT mice, n=5 VilCreER;Apcfl/+mice). This is the same dataset as in Fig. 1a but with different Wnt-target genes highlighted (green dots) using Wald test (two-tailed). b, Notum-ISH shows high levels of Notum expression in the intestine of multiple Wnt-driven tumour models of the indicated genotypes (Ctnnb1Ex3/+, 30 days; Apc1322T/+, 98 days; ApcMin/+, 125 days). Sections from n=4 mice per genotype were stained. Scale bar, 200 μm. c, ISH of serial en face sections of intestinal tissue from Lgr5CreER;Apcfl/fl mice 10 days post tamoxifen-induction. BaseScope ISH for recombined Apc (ApcEx14-ISH) and Notum (Notum-ISH) shows exclusive expression of Notum in cells that have recombined Apc (cells lacking pink RNA dots in right panel). Boxed areas show close-up of Notum+ Apc-mutant crypts, demarcated by a dashed line. Sections from n=4 mice per genotype were stained. Scale bar, 20 μm. d, Notum-ISH timecourse (days 6, 28, 60, and >100) post tamoxifen-induction in Lgr5CreER;Apcfl/fl mice shows specific Notum expression in progressively dysplastic epithelium. Sections from n=4 mice per genotype were stained. Scale bar, 100 μm. e, Quantification of the number of crypt domains per WT organoid following indicated treatments. Each data point represents a single mouse, n=6 mice. f, Relative WT organoid viability measured at passage 3 following treatments as indicated. n=5 mice/condition. g, Top, schematic illustrating mouse breeding scheme to generate Lgr5CreER;Apcfl/fl;Notumfl/fl mice for treatment of WT organoids with Apc-/-;Notum-/- conditioned medium (Apc-/-;Notum-/- CM). Bottom, representative images of WT organoids grown in Apc-/-;Notum-/- CM for 5 days and supplemented with recombinant NOTUM. Treatments were repeated twice on WT organoids derived from n=3 mice. Scale bar, 200 μm. Data are mean ± s.e.m. In e, f, Mann–Whitney two-tailed U-test; P values are shown in the corresponding panels.
Extended Data Figure 2
Extended Data Figure 2. Apc-mutant cells upregulate negative regulators of Wnt signalling.
a, Raw sequence reads for transcripts encoding Wnt-negative regulators, Wif1 and Dkk3, in Apc-mutant (VilCreER;Apcfl/+) tumour tissue compared to wild-type (WT) small intestine (n=3 WT mice, n=5 VilCreER;Apcfl/+mice). b, Representative ISH for Wif1 and Dkk3 in Lgr5CreER;Apcfl/fl tumour (top panels) and WT small intestine (bottom panels). n=3 mice. Images of mice shown aged between 3–4 months. Boxed areas show close-up of WT crypts. Scale bar, 200 μm. For fluorescence-activated cell sorting (FACS) gating strategy, see Supplementary Fig. 1. c, Quantification and representative images of WT organoids, formed over multiple passages (P1, P2, and P3), during culture supplemented with recombinant WIF1, DKK3, and NOTUM. WT organoids treated with recombinant proteins were derived from n=3 mice. Images taken at P2. Mann–Whitney one-tailed U-test. Scale bar, 200 μm. d, qPCR for Wnt antagonists expressed by tamoxifen-induced Lgr5CreER;Apcfl/fl (Notum+/+) and Lgr5CreER;Apcfl/fl;Notumfl/fl (Notumfl/fl) small intestinal organoids. n=4 mice per genotype. e, qPCR for Wnt targets expressed in WT organoids 3 days following treatment with indicated recombinant Wnt antagonists. n=3 mice per treatment. Mann–Whitney one-tailed U-test. f, Quantification of VilCreER;Apcfl/fl organoids 3 days after culture with recombinant WIF1, DKK3, and NOTUM. n=3 mice per condition. g, Relative organoid viability and representative images of VilCreER;Apcfl/fl intestinal organoids treated with vehicle or NOTUMi for 3 days. n=3 mice/condition. Scale bar, 100 μm. Data are mean ± s.e.m. In d, Mann–Whitney two-tailed U-test; P values are shown in the corresponding panels.
Extended Data Figure 3
Extended Data Figure 3. Notum is required for Apc-mutant cells to form intestinal tumours.
a, Survival plot for Lgr5CreER;Apcfl/fl;Notum+/+ (Notum+/+) and Lgr5CreER;Apcfl/fl;Notumfl/fl (Notumfl/fl) mice aged until clinical endpoint following induction with 0.15 mg tamoxifen. (n=10 Notum+/+ mice, n=10 Notumfl/fl mice). P=0.12, log-rank test. b, Total small intestinal tumour burden (area) per mouse from mice in a, (n=10 Notum+/+ mice, n=9 Notumfl/fl mice). c, Small intestinal tumour number per mouse from mice in a, (n=10 Notum+/+ mice, n=10 Notumfl/fl mice). d, Representative H&E and Notum-ISH staining on serial sections from Notum+/+ and Notumfl/fl mice in a. Asterisks denote intestinal adenomas. Boxed areas are close-up of adenomas stained for Notum. Note that adenomas grow out as Notum-positive lesions in Notumfl/fl mice suggesting that retaining Notum confers a survival advantage during adenoma development. Scale bars, 200 μm. Data are mean ± s.e.m. In, b, c, Mann–Whitney U-test; P values are shown in the corresponding panels.
Extended Data Figure 4
Extended Data Figure 4. Generation and characterisation of novel Notum conditional knockout.
a, Schematic of Notum locus and recombined Notumc allele with relevant genome editing sites indicated. b, Southern blot analysis of embryonic stem (ES) cell Notumc clones and wild-type genomic DNA showing successful recombination at the Notum locus (4.7 kb product). The 13.6- and 4.7 kb bands represent endogenous and recombined alleles, respectively (arrows). c, Top, schematic of tamoxifen treatment regimen and tissue analysis 7 and 14 d.p.i. of Lgr5CreER;Apcfl/fl;Notum+/+ (NotumWT) and Lgr5CreER;Apcfl/fl;Notumc/c (NotumcKO) mice. Bottom, representative images of small intestinal sections stained for β-catenin from NotumWT and NotumcKO mice 14 days following induction with 120 mg/kg (3 mg) tamoxifen. Arrows indicate dysplastic crypts with nuclear β-catenin (magenta border). Boxed area shows close-up of β-catenin+ crypts. Sections from n=4 mice per genotype were stained. Scale bar, 50 μm. d, Representative agarose gel electrophoresis of products from conventional PCR showing relative recombination of Apcfl and Notumc alleles 5 days post tamoxifen-induction. The 250- and 513 bp bands represent recombined Apc and Notum, respectively. For gel source data, see Supplementary Fig. 1. n=3 mice. e, Quantification of small intestinal β-catenin+ lesions in NotumWT and NotumcKO mice, induced with 3 mg tamoxifen, and sampled at 7 and 14 d.p.i. n=4 per genotype at 7 d.p.i; n=18 NotumWT mice and n=12 NotumcKO mice at 14 d.p.i. f, Quantification of large intestinal β-catenin+ lesions at 14 d.p.i (n=18 NotumWT mice, n=12 NotumcKO mice). g, Left, representative images of β-catenin IHC depicting fully and partially fixed Apc-mutant crypts in NotumWT and NotumcKO mice, respectively. Mice were induced with 3 mg tamoxifen and sampled at 14 d.p.i (n=4 per genotype). Right, ratio of fully-to-partially fixed crypts in NotumWT and NotumcKO mice. Scale bar, 100 μm. h, Relative percentages of clonal crypt classification (clonal crypt phenotype) from mice described in g. i, Analysis of NotumWT and NotumcKO adenomas at 14 d.p.i. Left, representative confocal images. Ki67 (magenta), Lgr5-EGFP (green), nuclei (cyan), β-catenin (white), adenomas (yellow dashed line). Middle, quantification of Lgr5+ cell frequency within β-catenin+ Apc-mutant clones. Right, proliferation of Lgr5+ and Lgr5- Apc-mutant cells (β-catenin+). n=5 mice/genotype. Scale bar, 20 μm. In box plots, the line represents median, the box shows interquartile range and whiskers represent the range. Data are mean ± s.e.m. In e, f, g, i, Mann–Whitney two-tailed U-test; P values are shown in the corresponding panels.
Extended Data Figure 5
Extended Data Figure 5. Deletion of Notum does not disrupt intestinal homeostasis.
a, Top, schematic of the tamoxifen (TMX) treatment regimen and analysis of tissues from Lgr5CreER;Notumc/c mice. Bottom, representative agarose gel electrophoresis of products from conventional PCR detecting alleles for non-recombined and recombined Notumc (238 and 513 bp, respectively) in Lgr5hi cells isolated from Lgr5CreER;Notumc/c mice with or without tamoxifen-induction. Cells were isolated from n=3 mice/genotype per timepoint. b, H&E staining of WT (NotumWT) and NotumcKO tissue harvested 8 months post tamoxifen-induction. Right panels show regular crypt-villus architecture in both cohorts. Sections from n=4 mice per genotype were stained. Scale bar, 5 mm. c, Cellular frequencies of crypt cells, analysed by flow cytometry, remain unchanged after Notum deletion (WT, n=5; NotumcKO, n=6). ISCs (Lgr5hi), transit-amplifying cells (Lgr5med and Lgr5lo), Paneth cells, and enteroendocrine cells (Endo). For fluorescence-activated cell sorting (FACS) gating strategy, see Supplementary Fig. 2. In box plots, the line represents median, the box shows interquartile range and whiskers represent the range. d, Representative images and quantification of organoid regeneration (shown as number of crypt domains per organoid) of WT and NotumcKO (cKO) organoid cultures, (WT, n=3; NotumcKO, n=4). Scale bar, 100 μm. e, Clonogenic growth of isolated Lgr5hi cells is increased in NotumcKO (cKO) compared to WT. Colonies were quantified 7 days post seeding, n=3 independent organoid lines per genotype. Mann–Whitney one-tailed U-test. Scale bar, 100 μm. Data are mean ± s.e.m. In d, Mann–Whitney two-tailed U-test; P values are shown in the corresponding panels. Representative images taken at day 6 (d) and 7 (e) of culture. For gel source data, see Supplementary Fig. 1.
Extended Data Figure 6
Extended Data Figure 6. Notum drives the elimination of wild-type cells from the crypt independent of apoptosis.
a, Quantification and representative confocal imaging of cleaved caspase-3+ cells (CC3) within clonal crypts and the surrounding non-mutant epithelium in NotumWT and NotumcKO mice at 14 d.p.i. n=4 per genotype. Crypts adjacent (Adj.) to or remote from (Rem.) Apc-mutant (clone) crypts were scored as non-mutant epithelia. Red arrows indicate CC3+ cells (green) in areas of Apc-mutant clones (purple border) and surrounding epithelia. Scale bar, 50 μm. Data are mean ± s.e.m; Mann–Whitney two-tailed U-test.
Extended Data Figure 7
Extended Data Figure 7. Cells that escape Notum deletion upregulate Wif1, but not Dkk3.
a, Quantification of the relative percentage of Notum+ adenomas (as detected via Notum-ISH) in VilCreER;ApcMin/+;Notum+/+ (+/+) and VilCreER;ApcMin/+;Notumfl/fl (fl/fl) mice aged 85 days. Mice were induced with 2 mg tamoxifen at 6 and 8 weeks of age. n=11 Notum+/+ and n=8 Notumfl/fl mice. b, Representative RFP-IHC of VilCreER;ApcMin/+;tdTom+ tumour tissue to show recombination efficiency at 85 days of age. Mice were induced with 2 mg tamoxifen at 6 and 8 weeks of age. Boxed area shows close-up of recombined (dark brown cells) and non-recombined (light brown cells) tumour epithelium from a single VilCreER;ApcMin/+;tdTom+ animal. Sections from n=4 mice were stained. Scale bar, 10 mm. c, Serial sections of intestinal tumour tissue stained via ISH for Notum, Wif1, and Dkk3 from two separate VilCreER;ApcMin/+;Notumfl/fl mice described in a. Note, Wif1 is upregulated in Notum-negative epithelial cells (boxed area). Scale bar, 50 μm. Data are mean ± s.e.m.
Extended Data Figure 8
Extended Data Figure 8. Notum is expressed by ligand-independent and not ligand-dependent tumours.
a, Relative percentages of clonal crypt classification (clonal crypt phenotype) from Lgr5CreER;Apcfl/fl mice induced with 0.15 mg tamoxifen followed by twice daily treatment with vehicle or NOTUMi (30 mg/kg) and sampled 21 days post induction. n=4 mice per treatment group. b, Quantification of β-catenin+ lesions from mice described in a. c, Representative examples of high, moderate and low NOTUM expression (as shown via ISH) within human colonic adenoma tissue. Arrows indicate single NOTUM positive cells. Staining was performed on >10 patient samples. Scale bar, 20 μm. d, Representative NOTUM expression, as shown by fluorescent ISH (FISH) on human colonic adenoma tissue. Tubulovillous adenoma (TVA), traditional serrated adenoma (TSA). Of note, NOTUM expression is minimally expressed in known RSPO1 fusion mutant adenoma tissue (TSA). Staining was performed on >10 patient samples. Scale bar, 50 μm. e, Representative Notum-ISH and β-catenin-IHC on VilCreER;Rnf43fl/fl;Znrf3fl/fl mice 14 d.p.i. (2 mg tamoxifen). Boxed areas show close-up of nuclear β-catenin+/Notum- epithelium (right panels). Sections from n=4 mice per genotype were stained. Scale bar, 50 μm. f, Quantification and representative images of WT organoids treated for 5 days with conditioned medium (CM) harvested from VilCreER;Rnf43fl/fl;Znrf3fl/fl organoids (R/Z-/- CM) ± recombinant NOTUM. R/Z-/- CM was collected from organoids derived from n=3 mice. WT organoids treated with CM ± NOTUM were derived from n=3 mice. Treatments were repeated twice. Mann-Whitney one-tailed U-test. Scale bar, 100 μm. Data are mean ± s.e.m. In b, Mann–Whitney two-tailed U-test; P values are shown in the corresponding panels.
Figure 1
Figure 1. Apc-mutant cells impair the growth of wild-type ISCs via Notum.
a, Volcano plot showing log2 fold change (x-axis) and –log2-transformed p-value (y-axis) of genes differentially expressed between Apc-mutant (VilCreER;Apcfl/+) tumour tissue and wild-type small intestine. Significantly altered genes shown in red, negative Wnt regulators highlighted in green using Wald test (two-tailed). (n=3 WT mice, n=5 VilCreER;Apcfl/+mice). b, Notum expressed in Lgr5-GFP+ cells, isolated from wild-type (Lgr5CreER;Apc+/+; +/+) and Apc-mutant intestines (Lgr5CreER;Apcfl/fl; fl/fl), 5–7 days following tamoxifen-induction. n=3 +/+ mice, n=5 fl/fl mice. c, Notum-ISH in wild-type (3–5 month-old Lgr5CreER;Apc+/+) small intestinal epithelium. Scale bar, 100 μm. d, Serial sections of intestinal tumour epithelium from Lgr5CreER;Apcfl/fl (3 month-old) mice stained for Notum (ISH) and β-catenin (IHC). Scale bar, 200 μm. e, Top, schematic illustrating experimental pipeline for wild-type (WT) organoid treatments. Bottom, representative images of WT small intestinal organoids, grown for 5 days in conditioned medium (CM) collected from wild-type (WT) or Apc-mutant (Apc-/-) organoids, derived from 3 mice of each genotype. WT organoids, treated with CM ± NOTUMi, were derived from n=6 mice. Treatments were repeated twice. Red arrows indicate organoid atrophy/death. Scale bar, 100 μm. f, Quantification of the number of organoids, formed over multiple passages (P1, P2, and P3), during culture in WT or Apc-/- CM supplemented with NOTUMi. n=6 mice per condition. g, qPCR for Wnt-target genes (Notum, Axin2), ISC markers (Lgr5, Ascl2), and cell-lineage markers (Lyz1, Krt20) expressed in organoids described in e. h, Quantification of WT organoids, formed over multiple passages (P1, P2, and P3), during culture in Apc-/-;Notum-/- CM supplemented with recombinant NOTUM. n=3 mice per condition. Mann–Whitney one-tailed U-test. Data are mean ± s.e.m. In b, f, g, Mann–Whitney two-tailed U-test; P values are shown in the corresponding panels.
Figure 2
Figure 2. Notum is required for Apc-mutant fixation in vivo.
a, Representative β-catenin IHC reveals fully and partially Apc-mutant fixed crypts in Lgr5CreER;Apcfl/fl (Notum+/+) and Lgr5CreER;Apcfl/fl;Notumfl/fl (Notumfl/fl) mice. n=4 mice per genotype were stained. Scale bar, 200 μm. b, Ratio of fully-to-partially fixed crypts in Notum+/+ and Notumfl/fl mice induced with 0.15 mg tamoxifen and sampled at 10, 14, and 21 days post induction (d.p.i). n=4 mice/genotype per timepoint. c, Total number of nuclear β-catenin+ lesions in Notum+/+ and Notumfl/fl mice over 10, 14, and 21 days post induction. n=4 mice/genotype per timepoint. d, Immunofluorescence staining for β-catenin (red) and lysozyme (green) of representative whole-mount Apc-mutant clones (red) from Notum+/+ and Notumfl/fl mice 21 days post induction. Nuclei were labelled with DAPI (blue). n=4 mice per genotype were stained. Scale bar, 200 μm. e, Left, heat maps depict the relative frequency of mutant clones of the indicated size (columns) at various timepoints (rows) for both Notum+/+ and Notumfl/fl mice. Right, graph displays the average clone size of Notum+/+ and Notumfl/fl mice over time post tamoxifen-induction. n=4 mice/genotype per timepoint. Data are mean ± s.e.m. In b, c, e, Mann–Whitney two-tailed U-test; P values are shown in the corresponding panels.
Figure 3
Figure 3. Notum inhibits cell proliferation and drives differentiation of wild-type ISCs.
a, Representative images (left) and quantification (right) of wild-type crypt proliferation, marked by EdU incorporation (red) in Lgr5CreER;Apcfl/fl;Notum+/+ (NotumWT) and Lgr5CreER;Apcfl/fl;Notumc/c (NotumcKO) mice at 14 d.p.i. Distance refers to the location of analysed wild-type crypts relative to the closest β-catenin+ clones (white, dashed yellow line). “0” refers to wild-type cells within the Apc-mutant crypt. Proliferation is represented in relation to distant crypts, >3 three crypts away from Apc-mutant clones. n=5 per genotype. Scale bar, 50 μm. b, Representative confocal images showing nuclear SOX9 expression (mean fluorescence intensity, MFI) in ISCs (green arrows) and transit-amplifying (TA) cells (blue arrows) neighbouring Apc-mutant clones (yellow border). Nuclei labelled with DAPI (white). Analysis of ISC nuclear SOX9 intensity is shown in relation to TA cells, with the same distance parameters described in panel a. n=5 mice/genotype. Scale bar, 20 μm. c, Analysis of Muc2+ (green) cells in animals described in panel a. Scoring of positively labelled cells in clonal crypts was performed as described in panel a. n=5 NotumWT and n=4 NotumcKO mice. Scale bar, 50 μm. d, Left, quantification of tamoxifen-induced VilCreER;Baxfl/fl;Bak-/- organoids (Baxfl/fl;Bak-/-) following treatment with Apc-/- CM ± NOTUMi. Right, representative images of Baxfl/fl;Bak-/- organoids 5 days following corresponding treatments. Organoid lines were derived from n=3 mice. Mann–Whitney one-tailed U-test. Scale bar, 100 μm. e, Representative β-catenin immunofluorescence (left) and quantification of wild-type crypt cross-sectional area (right) adjacent to or remote from Apc-mutant clones in whole-mount small intestine from Lgr5CreER;Apcfl/fl;Notum+/+ (Notum+/+) and Lgr5CreER;Apcfl/fl;Notumfl/fl (Notumfl/fl) mice at 14 d.p.i. (0.15 mg tamoxifen). Nuclei labelled with DAPI (white). n=4 Notum+/+ and n=3 Notumfl/fl mice. Scale bar, 50 μm. Data are mean ± s.e.m. In a, b, c, e, Mann–Whitney two-tailed U-test; P values are shown in the corresponding panels.
Figure 4
Figure 4. Inhibition of Notum limits Apc-mutant fixation and intestinal tumour progression.
a, Survival plot for VilCreER;ApcMin/+;Notum+/+, VilCreER;ApcMin/+;Notumfl/+ and VilCreER;ApcMin/+;Notumfl/fl mice aged until clinical endpoint following induction with 2 mg tamoxifen at 6 and 8 weeks of age. n=30 Notum+/+, n=13 Notumfl/+, n=9 Notumfl/fl mice, where 5 still alive at the time of submission. Of note, animal sampled at 101 days was tumour-free (censored). P calculated using log-rank test. b, c, Total tumour number (b) and burden (c) per mouse of genotypes shown. Mice were sampled at 85 days of age. n=11 Notum+/+, n=8 Notumfl/fl mice. d, Notum-ISH on small intestinal tissue from mice described in b. Scale bar, 10 mm. e, Representative β-catenin immunofluorescence (red) of Lgr5CreER;Apcfl/fl mice induced with 0.15 mg tamoxifen followed by twice daily treatment with vehicle or NOTUMi (30 mg/kg) for 21 days post induction. Nuclei were labelled with DAPI (white). Scale bar, 50 μm. f, Ratio of fully-to-partially fixed crypts in mice described in e. n=4 per treatment group. g, Quantification and classification of β-catenin+ clonal lesions from mice described in e. n=4 per treatment group. h, Representative images of NOTUM-ISH and β-catenin IHC on serial sections from human colonic adenoma and surrounding normal mucosal tissue. Note, NOTUM/β-catenin double-positive cells only observed in the adenoma tissue. Staining was performed on >10 patient samples. Scale bar, 20 μm. i, Relative percentages of NOTUM-intensity within positive regions of adenoma and neighbouring mucosal tissue from human FAP-patient samples. j, Schematic depicting the proposed model of Notum-mediated Wnt inhibition of wild-type ISCs (green) by Apc-mutant cells (brown). Curved arrows indicate activation and blunt-ended arrows inhibition. Arrow thickness resembles strength of activity. Data are mean ± s.e.m. In b, c, f, Mann–Whitney two-tailed U-test; P values are shown in the corresponding panels.

Comment in

Similar articles

Cited by

References

    1. Barker N, et al. Crypt stem cells as the cells-of-origin of intestinal cancer. Nature. 2009;457:608–611. - PubMed
    1. Huels DJ, et al. Wnt ligands influence tumour initiation by controlling the number of intestinal stem cells. Nature communications. 2018;9:1132. doi: 10.1038/s41467-018-03426-2. - DOI - PMC - PubMed
    1. Blokzijl F, et al. Tissue-specific mutation accumulation in human adult stem cells during life. Nature. 2016;538:260–264. doi: 10.1038/nature19768. - DOI - PMC - PubMed
    1. Lee-Six H, et al. The landscape of somatic mutation in normal colorectal epithelial cells. Nature. 2019;574:532–537. doi: 10.1038/s41586-019-1672-7. - DOI - PubMed
    1. Powell SM, et al. APC mutations occur early during colorectal tumorigenesis. Nature. 1992;359:235–237. doi: 10.1038/359235a0. - DOI - PubMed

Publication types

MeSH terms