. 2021 Jun;594(7863):442-447.
doi: 10.1038/s41586-021-03605-0. Epub 2021 Jun 2.

Tracing oncogene-driven remodelling of the intestinal stem cell niche

Affiliations

Tracing oncogene-driven remodelling of the intestinal stem cell niche

Min Kyu Yum et al. Nature. 2021 Jun.

Abstract

Interactions between tumour cells and the surrounding microenvironment contribute to tumour progression, metastasis and recurrence1-3. Although mosaic analyses in Drosophila have advanced our understanding of such interactions4,5, it has been difficult to engineer parallel approaches in vertebrates. Here we present an oncogene-associated, multicolour reporter mouse model-the Red2Onco system-that allows differential tracing of mutant and wild-type cells in the same tissue. By applying this system to the small intestine, we show that oncogene-expressing mutant crypts alter the cellular organization of neighbouring wild-type crypts, thereby driving accelerated clonal drift. Crypts that express oncogenic KRAS or PI3K secrete BMP ligands that suppress local stem cell activity, while changes in PDGFRloCD81+ stromal cells induced by crypts with oncogenic PI3K alter the WNT signalling environment. Together, these results show how oncogene-driven paracrine remodelling creates a niche environment that is detrimental to the maintenance of wild-type tissue, promoting field transformation dominated by oncogenic clones.


Conflict of interest statement

Declaration of Interests

The authors declare no competing interests.

Figures

Extended Data Figure 1
Extended Data Figure 1. Red2Onco system: an oncogene-associated multicolour reporter
a, Representative confocal images of mutant clones from sections (Red2-Notch1ICD) or whole mounts (Red2-KrasG12D and Red2-PIK3CAH1047R) of small intestine from Villin-CreERT2;Red2Onco mice at 2w post-tamoxifen administration. Crypt borders are marked with a grey dashed outline. b, Average clone numbers collected from a single field of image (0.15 mm2) of whole mount small intestine from Villin-CreERT2;R26R-Confetti or Red2Onco mice at 2d post-tamoxifen administration. c-e, Representative confocal images (left) and quantification (right) of EdU+ proliferating crypt cells (c), LYZ+ Paneth cells (d) and MUC2+ goblet cells (e) from sections of small intestine from Villin-CreERT2;R26R-Confetti or Red2Onco mice at 4w post-tamoxifen administration. f, Representative confocal images of 100 μm-thick sections or whole mounts of tissues from adult R26R-CreERT2; Red2Onco mice (skin and stomach corpus), Sftpc-CreERT2; Red2Onco mice (lung) or Krt5-CreERT2; Red2Onco mice (oesophagus) at 1w, 2w and 4w post-tamoxifen administration. The white dashed line indicates the epithelial lining. β-catenin stained as a cell membrane marker. SPC marks alveolar type II cells in lung. g, Representative confocal images of sectioned mouse embryonic pancreas tissue from the R26R-CreERT2; Red2-KrasG12D model at embryonic day 18.5, 6d post-tamoxifen administration. Magnified panel to the right shows an example of acinar cell expansion in developing pancreas. CPA1 marks acinar cells. Conf: R26R-Confetti; R2N1: Red2-Notch1ICD; R2KR: Red2-KrasG12D; R2P3: Red2-PIK3CAH1047R. Significance (*P < 0.05; **P < 0.01; ***P < 0.0001) was determined by one-way ANOVA with Games-Howell’s multiple comparisons test (b,c) or unpaired two-tailed t-test (d,e) from biological replicates. Data are means ±SD (b) or means ± SEM (c,d,e). Exact P values are presented in Source Data. Scale bar: 50 μm (a,c,d,e,f) or 200 μm (g).
Extended Data Figure 2
Extended Data Figure 2. Oncogenes drive non-neutral clone expansion in the mouse intestinal crypt
a, Schematic illustration of clonal events within the Red2Onco system (left panel) and representative tile scan images (right panel). Images are representative of tissues quantified in (h-k). Arrow: WT crypts; Arrowhead: fixed mutant crypts. b, Representative confocal images of the base and neck of crypts. Images are representative of tissues quantified in (c). c-e, Graph demonstrating strong correlation between clone size at the base and neck of a crypt from Villin-CreERT2;R26R-Confetti (2w post-tamoxifen administration) or Red2Onco mice (1w post-tamoxifen administration). f, Average number of clones per 100 crypts. g, Schematic illustration of mutant (RFP+) and WT (YFP+) clones in crypts, remote from each other. h, Representative confocal images at 4d, 1w, 2w and 3w post-tamoxifen administration. Images are representative of tissues quantified in (i-k). Red2-Wild-type: remote YFP+ clones; Red2-Mutant: RFP+ clones. i, Heatmaps indicate the relative clone fractions of the indicated sizes (columns) at various time points post-induction (rows). Black dots denote mean ± SEM. j,k, Average clone size (j) and percentage of monoclonal crypts (k) at different time points post-tamoxifen administration. Asterisk for statistical significance omitted in graphs (j,k) for better visualization. Confocal images of small intestine from Villin-CreERT2;R26R-Confetti (a,b,h) or Red2Onco mice (a,h). Crypt borders are marked with a white dashed outline (a,b). Significance (*P < 0.05; **P < 0.01; ***P < 0.0001) was determined by unpaired two-tailed Pearson’s correlation test (c-e), one-way ANOVA with Games-Howell’s multiple comparisons test (j) or unpaired two-tailed t-test (k) from biological replicates. Data are means ±SD (f) or means ± SEM (j,k). Exact P values are presented in Source Data. Scale bar: 100 μm (a,b) or 50 μm (h).
Extended Data Figure 3
Extended Data Figure 3. Biophysical modelling of mutant clone expansion
a,d, Contour plots showing mean-square differences of clone size distribution between neutral drift model and YFP clone data from Confetti (left), WT crypts remote from mutant crypts in R2KR (middle) and R2P3 (right) in (a); and between biased drift model and RFP mutant (MT) clone data from R2KR (left), R2P3 (middle) and R2N1 (right) in (d). Plots: scan of loss/replacement rate λ vs. time-delay between injection and induction in (a); and drift bias δ with time-delay of 0.29w (R2KR), 0w (R2P3), and 0.43w (R2N1) in (d). Blue lines in (d): constraint λ(1 − δ) = λWT, where λWT =loss/replacement rate inferred from Confetti (Supplementary Theory). Analysis in (a) and (d) based on data in (c) and (f), respectively. b,e, Average clone size (effective stem cell number) in (b) and (e) from (a) and (d), respectively. Points show data, lines show model prediction at optimal parameter values. In each case, total effective stem cell number N=5, so that an average clone size of, e.g., 2 corresponds to circumferential angle of 360° x 2/5. c,f, Distribution of clone sizes in (c) and (f) for models from (a) and (d), respectively. Points show data, lines show model prediction at optimal parameter values. g, Representative confocal images of cleaved Caspase-3+ apoptotic cells. A single cleaved Caspase-3+ apoptotic cell in villus tip indicated by white arrow as positive control. h,i, Representative confocal images (h) and quantification (i) of EdU+ proliferating crypt base columnar cells. Whole mount of small intestine from Villin-CreERT2;R26R-Confetti or Red2Onco at 1w (g) or 2w (h,i) post-tamoxifen administration. Conf: R26R-Confetti; R2N1: Red2-Notch1ICD; R2KR: Red2-KrasG12D; R2P3: Red2-PIK3CAH1047R. Significance (*P<0.05; **P<0.01; ***P<0.0001) determined by unpaired two-tailed t-test (i) from biological replicates. Data are means±SEM (b,c,e,f,i). Exact P values in Source Data. Scale bar: 50μm (g) or 25μm (h).
Extended Data Figure 4
Extended Data Figure 4. Mutant crypts perturb clonal dynamics of WT cells in neighbouring crypts
a, Representative confocal images of tissues quantified in (b). Fixed (monoclonal) WT crypts are indicated by white arrows. b, Percentage of monoclonal WT small intestinal crypts. c,d, Average clone size (c) and percentage of monoclonal crypts (d) of remote and proximate WT (YFP+) clones at different time points after tamoxifen administration. e, Schematic illustration for proximate WT clones in relation to fixed mutant crypts. f, Heatmaps indicate the relative clone fractions of the indicated sizes (columns) at various time points post-induction (rows). Black dots denote mean ± SEM. g, Average clone size of proximate (inner and outer) WT (YFP+) clones at different time points post-tamoxifen administration. h, Average clone size 〈θ〉/360° of WT (YFP+) clones in crypts neighbouring fixed mutant crypts as a function of time t post-induction. Points show mean ± SEM. Blue line shows a fit to the square root dependence predicted by the neutral drift model (Supplementary Theory). Orange line shows the 95% confidence interval. i Schematic illustration of factors affecting rate of clonal drift (Supplementary Theory). j, Representative images (left panel) and quantification (right panel) of OLFM4+ ISCs. Arrow: proximate WT crypts; Arrowhead: fixed mutant crypts. Crypt borders are marked with grey dashed outlines. Confocal images of whole mount small intestine from Villin-CreERT2;R26R-Confetti or Red2Onco mice (a), and Lgr5-EGFP-IRES-CreERT2;Red2Onco mice (j) at 2w post-tamoxifen administration. Significance (*P < 0.05; **P < 0.01; ***P < 0.0001) was determined by one-way ANOVA with Games-Howell’s multiple comparisons test (c,g) and unpaired two-tailed t-test (b,d,j) from biological replicates. Data are means ±SEM (b,c,d,f,g,h) or means ±SD (j). Exact P values are presented in Source Data. Asterisk for statistical significance omitted in graphs (c,d,g) for better visualization. Scale bar: 50 μm (a,j).
Extended Data Figure 5
Extended Data Figure 5. Reduced effective stem cell number leads to accelerated drift dynamics
a, Original image (left panel) was thresholded (upper-right) and outlined (lower-right) to measure crypt size and circularity. Image representative of tissues quantified in (b-e). b,c,d,e, Scatter and violin plots display size (b,c) and circularity (d,e) of WT crypts vs. distance from nearest fixed mutant (RFP+) crypt. f,g, Illustration (f) and confocal images (g) of clones representative of tissues quantified in (h,i). h, Heatmaps indicate relative clone fractions of given sizes. Black dots denote mean±SEM. i, Percentage of monoclonal crypts of proximate WT (YFP+) clones. j,k, Confocal images (j) and quantification (k) of EGFP+ (Lgr5+) ISCs. Images representative of tissues quantified in (k,l). White dashed line: EGFP+ cells in WT crypts. l, Violin plots display size of WT crypts in relation to multiplicity of neighbouring mutant crypts. n number for each group is shown. m,n, Representative confocal images of Red2Onco intestine (m) and fractions of WT crypts from single field (0.15mm2) (n). o, Illustration (left) and representative images (right) of crypt fission and fusion event in ‘8-shaped crypts’. Images representative of tissues quantified in (p). p, Percentage of crypts undergoing crypt fission (upper) or fusion (lower). Whole mount of small intestine from Villin-CreERT2;R26R-Confetti or Red2Onco mice (a-i,o,p,m), and Lgr5-EGFP-IRES-CreERT2;Red2Onco mice (j,k) at indicated time-points. Proximate WT crypts and fixed mutant crypts indicated by white arrows and arrowheads, respectively (g,j). Crypt borders marked by dashed grey outlines (g,j,o). In (b,d), blue shaded area and red dashed line indicate 95% confidence interval of R26R-Confetti controls and average distance between the centre of fixed mutant crypt and proximate WT crypts, respectively. Significance (*P<0.05; **P<0.01; ***P<0.0001) determined by unpaired two-tailed t-test (c,e,i,k,l,p). Data are means±SD (i,k,n) or means±SEM (h,p). Exact P values presented in Source Data. Scale bar: 50μm (a,g,j,m,o).
Extended Data Figure 6
Extended Data Figure 6. Oncogene-driven signalling changes
a, FACS sorting strategy to isolate cells from Confetti and Red2Onco. R1:live; R2:singlet; R3:mesenchymal/immune (EPCAM-); R4:epithelial (EPCAM+); R5:mutant-epithelial (RFP+); R6:WT epithelial (YFP+); R7:immune (CD45+); R8:mesenchymal (CD45-). b, Box and whisker plots showing distributions of Pearson correlation coefficients in averaged log2-transformed normalised UMIs for cell types across all pairs of mice from same (white) and between different (grey) conditions. c, UMAP of epithelial cells detected by Louvain. k: k nearest-neighbour value. d, UMAPs showing distribution of averaged expression of marker genes. Colour bars: averaged log2-transformed normalised UMIs. Upper-left from Fig. 3b. e,Heatmap representing marker expression for epithelial cells. Coloured panel (left) groups marker genes (right) for cell types. Colour bar: auto-scaled log2-transformed normalised UMIs. f,Heatmaps representing differential gene expression for epithelial cells in Red2Onco compared to Confetti. Parentheses: number of differentially expressed genes. Colour bar: log2(fold-change). (Supplementary Table 1.) g, UMAPs showing distributions of mutant (RFP+) and WT (YFP+) epithelial cells for Confetti and Red2Onco. h,i, Fractions of mutant (h) and WT (i) epithelial cells in Red2Onco and Confetti. See Fig. 3c for other WT. j,k,l, Confocal images (j) of EGFP+ cells, representative of tissues quantified for stem cell number (k) and fraction (l). In (j), white arrows indicate WT crypts proximate to mutant (MT) crypts. White-dashed lines mark crypts. Scale bar: 25μm. m,n, FACS plots (m) and quantification (n) of EGFPhi stem cell fractions from R5 or R6 (a). Small intestine from Lgr5-EGFP-IRES-CreERT2;Red2Onco at 2w post-induction (clonal dosage (0.2mg/20g body-weight) for (j,k,l), mosaic dosage (4mg/20g body-weight) for (m,n)). Significance (*P<0.05; **P<0.01; ***P<0.0001; statistically not significant (n.s.) P>0.05) determined by two-sided Kolmogorov–Smirnov test (b), two-sided likelihood ratio test (h,i) and one-way ANOVA with Games-Howell’s multiple comparisons test (k.l.n). Data mean±SEM (h,i,k,l) or mean±SD (n). Exact P values in Source Data.
Extended Data Figure 7
Extended Data Figure 7. Mutant crypt induces primed differentiation
a,b, Priming scores of stem (SC) and TA cells of mutant (a) and WT (b) crypts toward secretory and enterocyte lineages in Red2Onco and Confetti. Thin (25th and 75th percentile) and thick (50th percentile) black dotted lines. Green and black asterisk: higher and lower in Red2Onco compared to Confetti, respectively. c, qPCR of lineage markers (Lgr5: ISC; Clca1: Goblet cell; Fabp1, Alpi: Enterocyte; Mki67: proliferation) using sorted RFP+ or YFP+ cells from Villin-CreERT2;R26R-Confetti or Red2Onco at 2w post-tamoxifen administration. d,e, Confocal images (d) and quantification (e) of MUC2+ goblet cells. f,h-j, Images (f) from RNA in situ hybridization of enterocyte marker Fabp1 and quantification in remote WT (Remote_R2KR, Remote_R2P3) (h), proximate WT (Prox_R2KR, Prox_R2P3) (i) and mutant crypts (MT_R2KR or MT_R2P3) (j) along crypt axis. In (f), Fabp1+ cells in lower crypts (below +8) marked by white arrow. g, Illustration of cellular localisation along crypt axis. Position 0: crypt base cell. k,l, UMAPs showing distributions of enrichment scores for BMP (k left), Wnt (k right), and Notch (l) pathways in epithelial cells of Red2Onco and Confetti. Colour bars: enrichment scores. m, Fractions of “active” cells with high enrichment scores for Notch pathway in mutant (MT) and WT epithelial cells from Red2Onco and Confetti. Small intestine sections from Villin-CreERT2;R26R-Confetti or Red2Onco at 2w post-tamoxifen administration (d,f). WT and mutant crypts marked with white and grey dashed outline, respectively (d,f). Remote WT in crypts separated by >3 crypt diameters from mutant crypts. Proximate WT in crypts neighbouring fixed mutant crypts. Significance (*P<0.05; **P<0.01; ***P<0.0001) determined by two-sided Kolmogorov–Smirnov test (a,b), unpaired two-tailed t-test (c,e,h,i,j) and two-sided likelihood ratio test (m). Data are mean±SEM (c,e,m) or mean±SD (h-j). Exact P values in Source Data. Scale bar: 50 μm (d,f).
Extended Data Figure 8
Extended Data Figure 8. Mutation-induced environmental changes
a, t-SNE representing immune cells from Confetti and Red2Onco. b,c, Heatmaps representing differential expression (DE) patterns for mesenchymal (b) and immune (c) cells from Red2Onco and Confetti: top 300 genes or less (FDR<0.05, pairwise t-test). Colour bar: averaged Z-scores of log2-transformed normalized UMIs. d, Secretion factor expression in stromal clusters for Confetti. In (d,f), dot size: percentage of cells expressing gene; colour: average expression. e, UMAPs showing expression of Bmpr1a and Fzd7 in epithelial cells. Colour bar: log2- transformed normalized UMIs. Inset from Fig. 3b. f, Dot plots showing expression of receptors upstream of BMP and Wnt pathways for epithelial cells. g,h, Fractions of mesenchymal (g) and immune (h) cells in Red2Onco and Confetti. Data: mean±SEM. p-values from two-sided likelihood ratio test: *, p<0.05; **, p<0.01; n.s., statistically not significant (p>0.05). i, Degree of transcriptomic change for immune cells estimated by cell-to-cell variability, p-value (PVAR), or separability of perturbed and unperturbed cells, p-value (PAUGUR). Dotted lines: − log10(0.01). Dot colour: cell types; Dot shape: Red2Onco. j, Enriched biological processes from gene ontology (GO) analysis of DE genes in STC2 of Red2-PIK3CAH1047R relative to Confetti. p-value from one-sided Fisher exact test. Dotted line: − log10(0.05). k,l, Heatmaps representing DE genes and their numbers (parenthesis) for mesenchymal (k), and immune (l) cells in Red2Onco compared to Confetti. Colour bar: log2(fold-change). (Supplementary Table 3.) m, Volcano plot representing DE genes in STC2 of Red2-PIK3CAH1047R relative to Confetti. p-value from two-sided pairwise t-test. Red dots: genes for biological processes of (j). Vertical (log2(fold-change)=0.259) and horizontal (-log10(0.05)) dotted lines. n, Model of direct and indirect crosstalk between mutant and WT crypts in Red2Onco. ENC:endothelial cell; GLC:glial cell; IC:intestitial cell of Cajal; MF:myofibroblast; STC1,2,3:stromal cell 1,2,3; BC:B-cell; DC:dendritic cell; Mono:monocyte; MP1,2:macrophage 1,2; PLC:plasma cell; TC:T-cell. Exact P values in Source Data.
Extended Data Figure 9
Extended Data Figure 9. Mutant clones secrete functional BMP ligands
a-d, Representative in situ hybridization images and quantification of Axin2 (a and b) and Id1 (c and d) on sections of small intestine from Villin-CreERT2;R26R-Confetti or Red2Onco mice at 2w post-tamoxifen administration. Arrowheads: fixed mutant crypts. Crypts are marked with dashed outline. e,f, qPCR analysis of Axin2 (e), and Id1 (f). g, Experimental setup for (h)–(j). h, Bright-field images of intestinal organoids after 2 days of treatment. The number and size of crypt-like budding structures are reduced in treated organoids. i, qPCR analysis of lineage markers. j, Representative images of Lgr5-EGFP organoids show that the number of Lgr5+ cells decreases following treatments. k, Experimental setup for (l,m). l,m, Bright-field images (l) and quantification (m) of intestinal organoids after 6 days of culture in WENR medium. n, qPCR analysis of BMP ligands (Bmp2 and Bmp7). o, Experimental setup for (p). p, qPCR analysis of Id1 using WT organoids after the CM treatment. q, Bright-field images of intestinal organoids from Villin-CreERT2;R26R-Confetti or Red2Onco mice at 1 month post-tamoxifen administration. Insets show RFP expression of the mutant organoids. r, qPCR analysis of WT and mutant organoids cultured in ENR medium. In (e,f,n), Sorted RFP+ or YFP+ cells from Villin-CreERT2;R26R-Confetti or Red2Onco mice at 2w post-tamoxifen administration (4mg/ 20g body weight, mosaic dosage) were analysed. MT: mutant crypts; Prox: proximate WT crypts. Significance (*P < 0.05; **P < 0.01; ***P < 0.0001) was determined by one-way ANOVA with Games-Howell’s multiple comparisons test (b.d) and unpaired two-tailed t-test (e,f,i,m,n,p,r). Quantification graphs show data from 3 independent experiments (i,m,p,r). Data are presented as mean ± SD (b,d,i,m,p) or mean ± SEM (e,f,n,r). Exact P values are presented in Source Data. Scale bar: 50 μm (a,c,h), 100 μm (j,q) and 500 (m).
Extended Data Figure 10
Extended Data Figure 10. Mutant clones drive niche stromal remodelling
a, Heatmap showing marker gene expression for STC2 among mesenchymal cells. Colour bar: averaged Z-scores of log2-transformed normalized UMIs over all cells within a cell type in Confetti. b,c, Representative multiplexed in situ hybridization images (b) and quantification (c) of Sfrp2 in Grem1+ cells on small intestine sections from Villin-CreERT2;R26R-Confetti or Red2Onco at 2w post-tamoxifen administration. Fixed mutant crypts indicated by white arrowheads. Crypts marked with grey dashed outlines. Grem1+ STC2 cells indicated by white arrow. d, Heatmap showing expression of marker genes and secreted factors in STC1,2 from Red2Onco and Confetti. Colour bar: averaged Z-scores of log2-transformed normalized UMIs over all cells within a cell type and condition. e, Projection of Pdgfra expression (middle) onto UMAP from Fig. 3f (Left) for comparison. Projection of Cd81 expression onto Pdgfralo cell clusters (STC1,2) (right). Colour bar: log2-transformed normalized UMIs. f, Sorting strategy to isolate STC2 from intestinal mesenchymal cells by FACS. R1: non-immune cells (CD45-). R2: mesenchymal cells (EPCAM-). R3: PDGFRAlo population. g, qPCR of STC2 marker (Cd81, Grem1), STC1 marker (Frzb) and secreted Wnt modulators (Rspo3, Sfrp2, Sfrp4) using sorted (CD45-,EPCAM-,PDGFRAlo,CD81-) cells (STC1) or (CD45-,EPCAM-,PDGFRAlo,CD81+) cells (STC2) from Villin-CreERT2;R26R-Confetti or Red2Onco mice at 2w post-tamoxifen administration. h, qPCR of Telocyte markers (Pdgfra, Foxl1) using sorted STC1,2 and (PDGFRAhi) Telocytes. ENC: endothelial cell; GLC: glial cell; IC: intestitial cell of Cajal; MF: myofibroblast; STC1,2,3: stromal cell 1,2,3. Significance (*P<0.05; **P<0.01; ***P<0.0001) determined by one-way ANOVA with Games-Howell’s multiple comparisons test (c) and unpaired two-tailed t-test (g,h). Data presented as mean±SD (c,g) or mean±SEM (h). Exact P values in Source Data. Scale bar: 25 μm (b).
Extended Data Figure 11
Extended Data Figure 11. Functional validation of oncogene-driven niche remodelling
a,b, qPCR analysis of Id1 (a), Axin2 and Lgr5 (b) after administration of indicated inhibitor. c, Fraction of monoclonal WT (YFP+) crypts remote from (Remote), or proximate to (Prox) mutant crypts in Red2Onco mice. d, Heatmaps indicate the relative clone fractions of the indicated sizes. Black dots denote mean ± SEM. e, Fraction of monoclonal (RFP+) mutant crypts in Red2Onco mice. f,g, Representative confocal images (f) and quantification (g) of EGFP+ (Lgr5+) ISCs. Images are representative of tissues quantified in (g). Arrow: proximate WT crypts; Arrowhead: fixed mutant crypts. h, Representative confocal images of whole mount small intestine. Images are representative of tissues quantified in (i). Arrowhead: fixed mutant crypts. i, Violin plots of proximate WT crypt size. j,k, RNA in situ hybridization (j) and quantification (k) of Bmp2. Arrowhead: fixed mutant crypts. MT: mutant crypts; Prox: proximate WT crypts. l,m, Representative multiplexed in situ hybridization images (l) and quantification (m) of Rspo3 in Cd81+ cells. White arrow: Cd81 positive STC2 cells; Arrowhead: fixed mutant crypts. Whole mount (f-i) and sections (j-m) of small intestine from Lgr5-EGFP-IRES-CreERT2 control (L5), Lgr5-EGFP-IRES-CreERT2;LSL-KrasG12D (enKR) or Pik3caLat-H1047R (enP3) mice at 2w post-tamoxifen administration. In (c,d,e), Graphs show data collected at 2w after concomitant administration of indicated drug and tamoxifen. Crypt borders are marked by dashed outlines (f,h,j,l). In (f,h,j,l), White (f,h) or Red (j,l): immunostaining for mutant KRASG12D in enKR, or p-AKT in enP3. Significance (*P < 0.05; **P < 0.01; ***P < 0.0001) was determined by one-way ANOVA with Games-Howell’s multiple comparisons test (k,m) and unpaired two-tailed t-test (c,e,g,i). Data are presented as mean ± SD (a,b,g,k,m) or mean ± SEM (c,e). Exact P values are presented in Source Data. Scale bar: 50 μm (f,h,j) and 25 μm (l).
Extended Data Figure 12
Extended Data Figure 12. Apc mutation induces reduction of stem cells in the neighbouring wild-type crypts
a,b, Representative confocal images of small intestine from Villin-CreERT2; Apcf/f mice at at 2 weeks (2w) post-tamoxifen administration (a) and ApcMin/+ mice at 12 weeks of age (b). Images are representative of 2 independent experiments. OLFM4 staining shows a reduced number of stem cells in wild-type crypts neighbouring mutant crypts. Apc mutant foci (Villin-CreERT2; Apcf/f) or polyp (ApcMin/+) are indicated by grey dashed outlines. Crypt borders are marked by white dashed outlines. Scale bar: 50 μm. c, Bright-field images of intestinal organoids after 7 days of culture in ENR medium. Images are representative of 3 independent experiments. Note that organoids from Villin-CreERT2; Apcf/f mice form spheroids under ENR media condition. Scale bar: 500 μm. d, qPCR analysis of Wnt target gene (Axin2) and secreted Wnt inhibitory factors (Dkk2, Wif1 and Notum) following Apc deletion. Data are presented as mean ± SD. N = 3 independent experiments. Quantification graphs show data from 3 independent experiments. Significance (*P < 0.05; **P < 0.01; ***P < 0.0001) was determined by unpaired two-tailed t-test. e,f, Representative multiplexed in situ hybridization images of Axin2 and Wif1 (e), and Lgr5 and Notum (f) on sections of small intestine from Villin-CreERT2; Apcf/f mice at 2w post-tamoxifen administration. Images are representative of 2 independent experiments. Axin2 (e) and Lgr5 (f) staining shows a reduced number of stem cells in wild-type crypts neighbouring Apc mutant crypts. Apc mutant foci (Villin-CreERT2; Apcf/f) are indicated by grey dashed outlines. Crypt borders are marked by white dashed outlines. Scale bar: 50 μm.
Figure 1
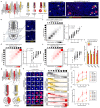
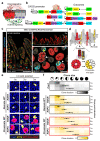
Figure 1. Red2Onco system: an oncogene-associated multicolour reporter
a, Schematic showing possible routes for crosstalk between mutant and neighbouring wild-type (WT) cells. b, Red2Onco knock-in strategy. The 2A peptide sequence and oncogene cDNA (KrasG12D, PIK3CAH1047R or Notch1ICD) were cloned in-frame downstream of the RFP cDNA in the R26R-Confetti cassette, which encodes four fluorescent proteins. c, Representative images from sections (left and upper-right panel) or whole mounts (lower-right panel) of small intestine from Villin-CreERT2;Red2-KrasG12D mice at 2 days (d) or 2 weeks (w) post-tamoxifen administration. Images are representative of 3 independent experiments. White dashed line indicates mucosal lining. Crypt fission and fusion events are visible in lower-right image, and indicated by white arrow and arrowhead, respectively. d, Schematic illustration of a WT (YFP+) clone in proximity to a fixed (monoclonal) mutant (RFP+) crypt. Clone sizes quantified as defined in Extended Data Fig. 2g. e, Representative confocal images of WT (YFP+) clones remote from, or proximate to, fixed mutant (RFP+) crypts in whole mount small intestine from Villin-CreERT2;R26R-Confetti or Red2Onco mice at 1w, 2w and 3w post-tamoxifen administration. Images are representative of tissues quantified in Fig. 1f. f, Heatmaps indicate relative clone fractions of indicated sizes (columns) at various time points post-induction (rows). Black dots denote mean±SEM. N =6 mice per group and time point. (103,80,169) clones scored for Conf, (93,129,178) for Remote WT R2KR, (106,94,187) for Remote WT R2P3, (90,99,241) for Proximate WT R2KR, and (64,137,88) for Proximate WT R2P3 at (1w,2w,3w) post-induction, respectively. Remote WT: WT clones located in crypts separated by >2 crypt diameters from mutant crypts. Proximate WT: WT clones located in crypts neighbouring fixed mutant crypts. R26R-Confetti and remote WT control data from Extended Data Fig. 2i are reproduced for comparison in heat maps (f). Scale bar: 200μm (c-side views), or 50μm (c-bottom view,e).
Figure 2
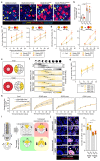
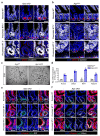
Figure 2. Reduced effective stem cell number leads to accelerated drift of WT clones in crypts neighbouring mutant crypts
a, Cumulative size distribution of WT (YFP+) clones in crypts neighbouring crypts monoclonal for given mutant together with Confetti control plot against the angular clone size, θ, rescaled by the average, 〈θ〉. Points show data from 2 time-points and dashed line denotes scaling function, exp[-π(θ/〈θ〉)2/4] × 100%, predicted by neutral drift model (see main text and Supplementary Theory). b,Corresponding average clone size 〈θ〉/360° as a function of time post-induction, scaled by effective drift rates, x = tλ/N2 obtained from a fit to predicted square root dependence (dashed line) (Supplementary Theory). In (a,b), experimental data as in Fig. 1f and, for R2N1-prox, N=6 mice per group and time-point, and (87,128) clones were scored at (14d,21d) postinduction. c,d, Representative confocal images (c) and quantification (d) of EdU+ proliferating Lgr5+ stem cells in WT crypts neighbouring mutant crypts. Proliferating stem cells in WT crypts are outlined with a white dashed line. N = 5 mice per group. For each mouse, 100 crypts analysed. e, f, Representative confocal images (e) and quantification (f) of Lgr5-eGFP+ stem cells. EGFP+ cells in WT crypts are outlined with a white dashed line. N = 5 mice per group. For each mouse, 100 crypts analysed. Whole mount small intestine were imaged from Lgr5-EGFP-IRES-CreERT2;Red2Onco mice at 2w post-tamoxifen administration (c,e). Proximate WT crypts and fixed mutant crypts are indicated by white arrows and arrowheads, respectively (c,e). Crypt borders are marked by dashed grey outlines (c,e). Conf: R26R-Confetti; R2N1: Red2-Notch iICD; R2KR: Red2-KrasG12D; R2P3: Red2-PIK3CAH1047R. Significance (*P < 0.05; **P < 0.01; ***P < 0.0001) determined by unpaired two-tailed t-test (d,f). Data are means±SEM (b) or means ±SD (d,f) from biological replicates. Exact P values presented in Source Data. Scale bar: 50μm.
Figure 3
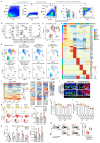
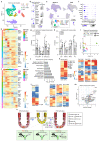
Figure 3. Comparative single-cell analysis identifies oncogene-driven niche changes
a, Schematic of comparative single-cell analysis. Mutant (MT) and WT epithelial, mesenchymal and immune cells isolated from small intestine. By comparing profiles across models, effect of oncogene expression on MT and WT epithelial cells and surrounding environment can be resolved. b, UMAP showing clustering of epithelial cells based on marker expression: (Stem) cells, (TA) cells, enterocyte progenitors (EP), enterocyte (Ent), enteroendocrine cells (EEC), (Goblet) cells, (Paneth) cells and (Tuft) cells. c, Fractions of WT epithelial cell types in Red2Onco models and Confetti control. d, Priming scores of WT (YFP+) stem and TA cells toward enterocyte lineages in Red2Onco and Confetti. 25th and 75th percentiles denoted by thin black dotted lines; 50th percentile by thick black dotted line. Green asterisk: higher in Red2Onco compared to Confetti. e, Fractions of “active” cells with high enrichment scores for BMP (left) and Wnt (right) pathways in MT and WT epithelial cells from Red2Onco and Confetti. f, t-SNE representing mesenchymal cell clusters. ENC: endothelial cell; GLC: glial cell; IC: interstitial cell of Cajal; MF: myofibroblast; STC1,2,3: stromal cell 1,2,3. g,h, Dot plots showing expression of secreted factors known to modulate BMP and Wnt signalling in MT epithelial cells from Red2Onco and WT cells from Confetti (g) and in mesenchymal cells (h). Dot size denotes percentage of cells expressing given gene, colour denotes average expression across all cells of that type. i, Degree of transcriptomic change for each mesenchymal cell type in Red2Onco (Methods). Conf: R26R-Confetti; R2KR: Red2-KrasG12D; R2P3: Red2-PIK3CAH1047R. Significance (*P < 0.05; **P < 0.01; ***P < 0.0001) determined by two-sided likelihood ratio test (c,e) and two-sided Kolmogorov–Smirnov test (d). Data presented as mean±SEM (c,e) from biological replicates (n=2 for Conf, R2P3; n=3 for R2KR). Exact P values presented in Source Data.
Figure 4
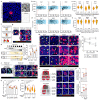
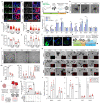
Figure 4. Functional validation of oncogene-driven niche remodelling
a, b, Representative in situ hybridisation images (a) and quantification (b) of Bmp2. WT and mutant crypts marked with white and grey dashed outline, respectively. MT: mutant crypts; Prox: proximate WT crypts. For each group, 50 crypts analysed from N=3 mice. c, d, Representative multiplexed in situ hybridisation images (c) and quantification (d) of Rspo3 in Cd81+ cells. Crypts marked with grey dashed outlines. For each group, 50 crypt pairs analysed from N=3 mice. e, Sorted Lgr5+ cells were cultured with either PDGFRAloCD81- STC1 cells or PDGFRAloCD81+ STC2 cells from Confetti or Red2-PIK3CAH1047R intestine. f,g, Representative bright-field images (f) and quantification (g) of intestinal organoids formed after 4d of co-culturing. N=3 independent experiments. MesConf, MesR2P3: mesenchymal cells from Confetti, Red2-PIK3CAH1047R mice. h,i, Representative confocal images (h) and heatmap distribution of clone fractions (i) of whole mount small intestine from Villin-CreERT2;R26R-Confetti or Red2Onco mice at 2w post-induction. Specific drug (LDN193189: BMP type I receptor blocking agent; LGK974: Porcupine inhibitor) or vehicle was administered following the dosing regimen (top right). Fixed WT crypts indicated by white arrows. Black dots denote mean±SEM. N=3 mice per group. 212 clones scored for Conf+Veh, (85,78,96) clones for Remote WT R2KR in (Veh,LDN,LGK) conditions, (91,90,113) for Remote WT R2P3, (130,108,75) for Proximate WT R2KR, (132,81,65) for Proximate WT R2P3. Sections of small intestine from Villin-CreERT2;R26R-Confetti or Red2Onco mice at 2w post-induction (a,c). Fixed mutant crypts indicated by white arrowheads (a,c). Conf: R26R-Confetti; R2KR: Red2-KrasG12D; R2P3: Red2-PIK3CAH1047R. Significance (*P < 0.05; **P < 0.01; ***P < 0.0001) determined by one-way ANOVA with Games-Howell’s multiple comparisons test (b,d) and unpaired two-tailed t-test (g) from biological replicates. Data are means±SD (b,d,g). Exact P values presented in Source Data. Scale bar: 50μm (a,h), 25μm (c) or 500μm (f).

Comment in

References

    1. Hanahan D, Weinberg RA. Hallmarks of cancer: the next generation. Cell. 2011;144:646–674. doi: 10.1016/j.cell.2011.02.013. - DOI - PubMed
    1. Medema JP, Vermeulen L. Microenvironmental regulation of stem cells in intestinal homeostasis and cancer. Nature. 2011;474:318–326. doi: 10.1038/nature10212. - DOI - PubMed
    1. Quail DF, Joyce JA. Microenvironmental regulation of tumor progression and metastasis. Nat Med. 2013;19:1423–1437. doi: 10.1038/nm.3394. - DOI - PMC - PubMed
    1. Claveria C, Torres M. Cell Competition: Mechanisms and Physiological Roles. Annu Rev Cell Dev Biol. 2016;32:411–439. doi: 10.1146/annurev-cellbio-111315-125142. - DOI - PubMed
    1. Di Gregorio A, Bowling S, Rodriguez Tristan A. Cell Competition and Its Role in the Regulation of Cell Fitness from Development to Cancer. Developmental Cell. 2016;38:621–634. doi: 10.1016/j.devcel.2016.08.012. - DOI - PubMed

Publication types

MeSH terms