. 2021 Jun;594(7863):454-458.
doi: 10.1038/s41586-021-03613-0. Epub 2021 Jun 2.

Gating and modulation of a hetero-octameric AMPA glutamate receptor

Affiliations

Gating and modulation of a hetero-octameric AMPA glutamate receptor

Danyang Zhang et al. Nature. 2021 Jun.

Abstract

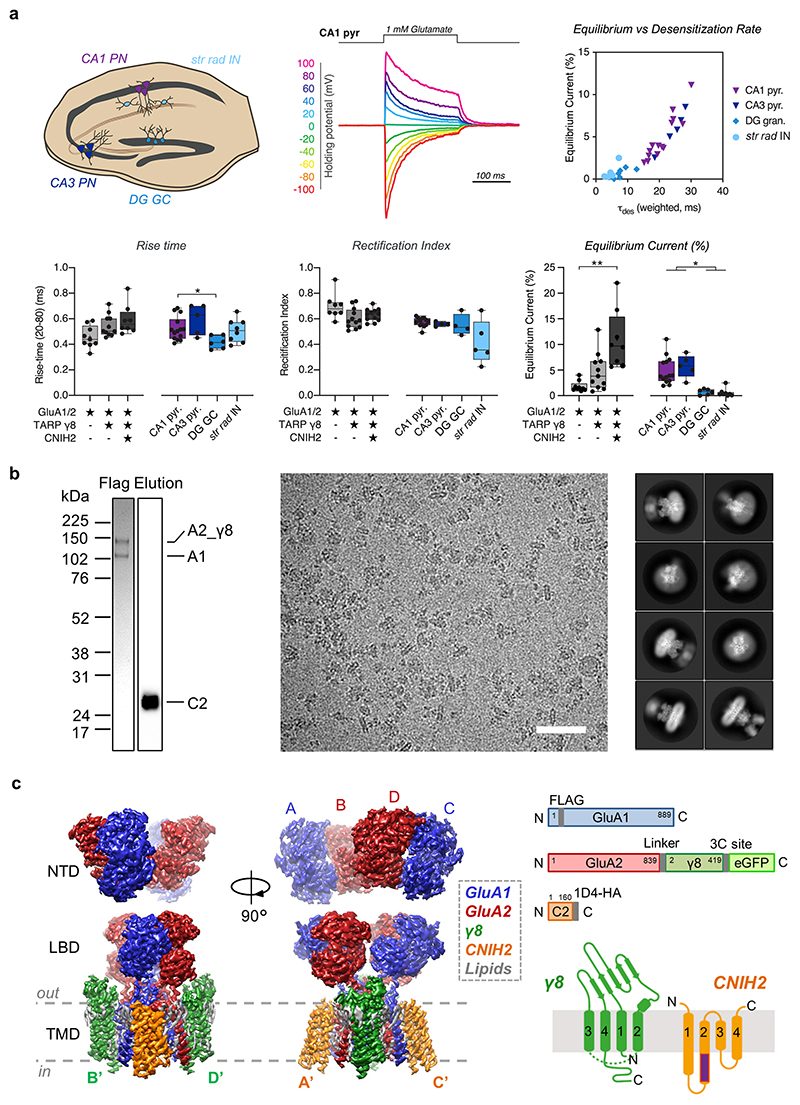
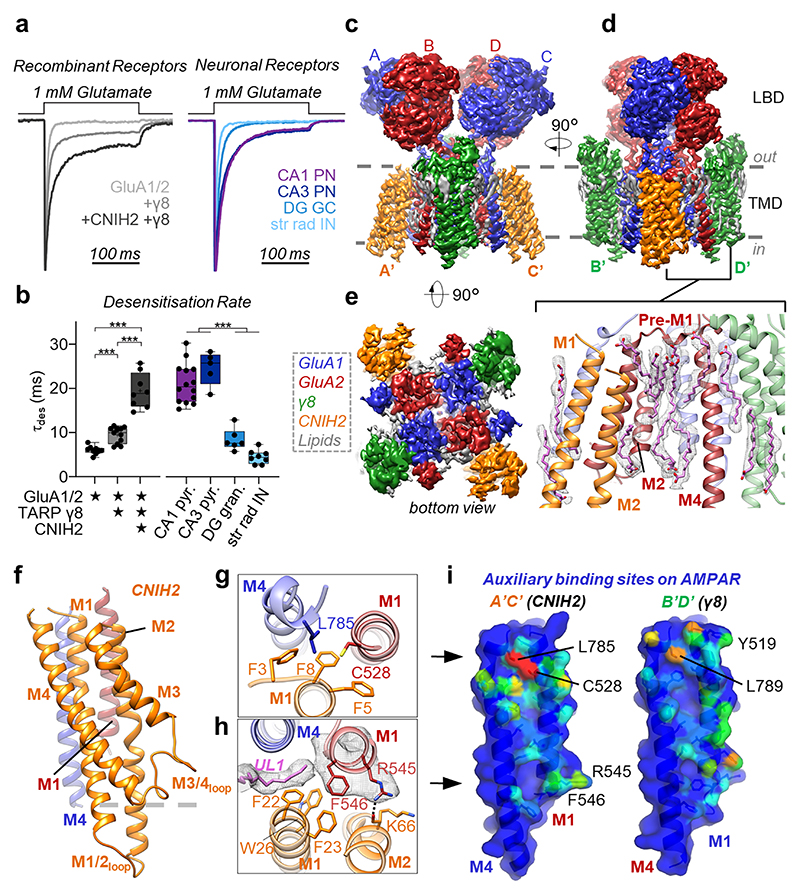
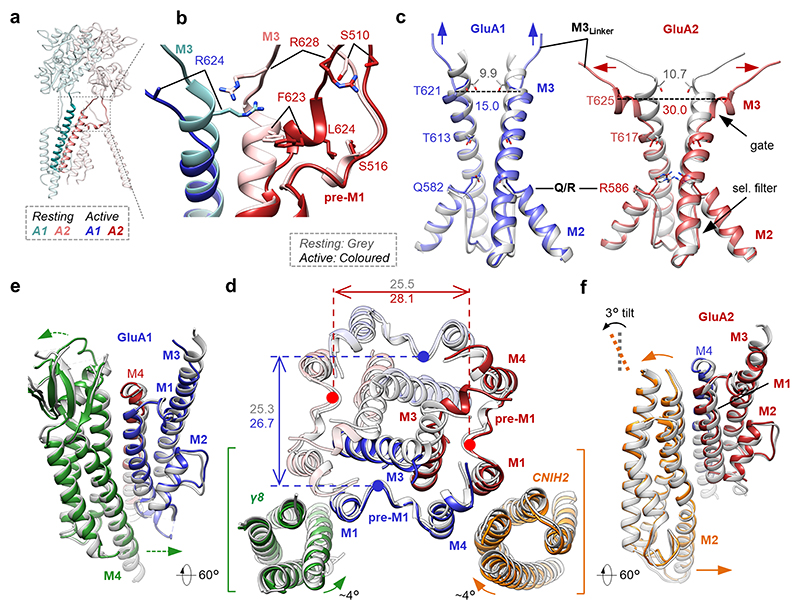
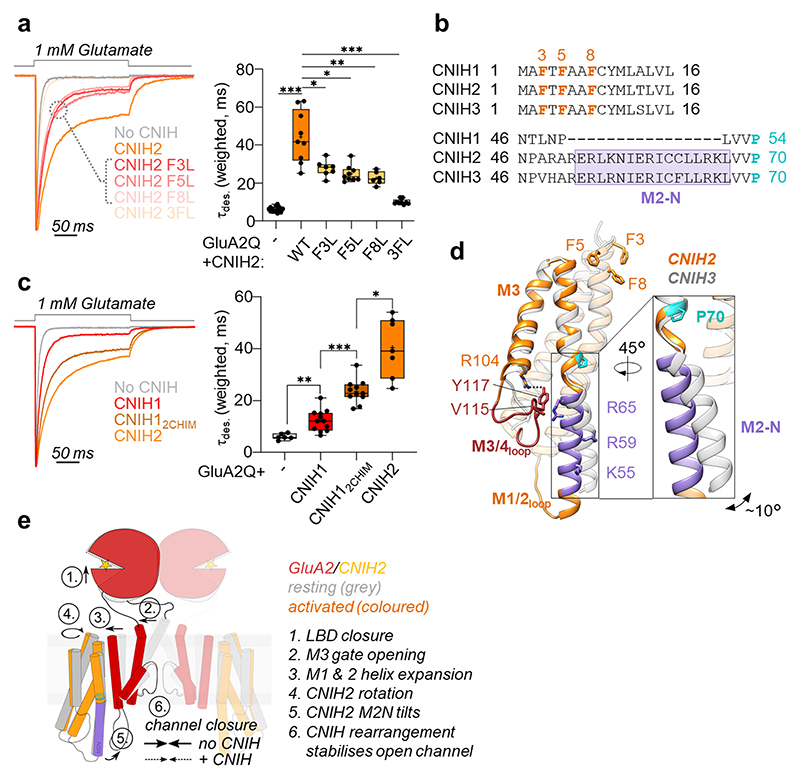
AMPA receptors (AMPARs) mediate the majority of excitatory transmission in the brain and enable the synaptic plasticity that underlies learning1. A diverse array of AMPAR signalling complexes are established by receptor auxiliary subunits, which associate with the AMPAR in various combinations to modulate trafficking, gating and synaptic strength2. However, their mechanisms of action are poorly understood. Here we determine cryo-electron microscopy structures of the heteromeric GluA1-GluA2 receptor assembled with both TARP-γ8 and CNIH2, the predominant AMPAR complex in the forebrain, in both resting and active states. Two TARP-γ8 and two CNIH2 subunits insert at distinct sites beneath the ligand-binding domains of the receptor, with site-specific lipids shaping each interaction and affecting the gating regulation of the AMPARs. Activation of the receptor leads to asymmetry between GluA1 and GluA2 along the ion conduction path and an outward expansion of the channel triggers counter-rotations of both auxiliary subunit pairs, promoting the active-state conformation. In addition, both TARP-γ8 and CNIH2 pivot towards the pore exit upon activation, extending their reach for cytoplasmic receptor elements. CNIH2 achieves this through its uniquely extended M2 helix, which has transformed this endoplasmic reticulum-export factor into a powerful AMPAR modulator that is capable of providing hippocampal pyramidal neurons with their integrative synaptic properties.


Conflict of interest statement

Competing interests: The authors declare no competing interests.

Figures

Extended Data Figure 1
Extended Data Figure 1. Properties of neuronal and recombinant AMPAR complexes.
a, Electrophysiological properties of neuronal and recombinant AMPAR complexes. Top left: Hippocampus schematic indicating selected cell types. Bottom left: Rise-time of fast-application glutamate responses of recombinant and neuronal AMPAR patches (20-80 % rise time (ms) - Recombinant receptors: GluA1/2: 0.46 ± 0.03, n=9; +γ8: 0.55 ± 0.03, n=11; +γ8+CNIH2: 0.59 ± 0.04, n=8. Neuronal receptors: CA1 pyramidal: 0.52 ± 0.02, n=14; CA3 pyramidal 0.60 ± 0.05, n=5; DG granule cell: 0.42 ± 0.02, n=6; CA1 stratum pyramidale interneurons: 0.51 ± 0.03, n=8; Welch’s ANOVA with Dunnett’s multiple comparison tests – Recombinant: W(2,15.11) = 4.25, p=0.03; Neurons: W(3,12.12) = 5.40, p=0.014) ; further details in Supplementary Table 1. Top middle: Example trace of rectification index (RI) recording from CA1 pyramidal neuron normalized to -100 mV peak amplitude. Bottom middle: Quantified RI from recorded surface patches (Recombinant receptors: GluA1/2: 0.70 ± 0.04, n=8; +γ8: 0.60 ± 0.02, n=12; +γ8+CNIH2: 0.63 ± 0.01, n=12. Neuronal receptors: CA1 pyramidal: 0.58 ± 0.01, n=13; CA3 pyramidal 0.56 ± 0.01, n=4; DG granule cell: 0.55 ± 0.04, n=4; CA1 stratum pyramidale interneurons: 0.42 ± 0.08, n=5; Welch’s ANOVA with Dunnett’s multiple comparisons test – Recombinant: W(2,15.01) = 2.47, p=0.12, Neurons: W(3,7.57) = 1.5, p=0.29) ; further details in Supplementary Table 1. Top right: Strong correlation between equilibrium current and desensitization rate are observed (individual neuronal patches plotted). Bottom right: Equilibrium current for patch responses show auxiliary protein dependent modulation and neuronal heterogeneity (% peak current - Recombinant receptors: GluA1/2: 1.81 ± 0.34, n=9; +γ8: 4.72 ± 1.09, n=11; +γ8+CNIH2: 10.97 ± 2.03, n=8. Neuronal receptors: CA1 pyramidal: 4.86 ± 0.71, n=14; CA3 pyramidal 5.78 ± 1.00, n=5; DG granule cell: 0.75 ± 0.22, n=6; CA1 stratum pyramidale interneurons: 0.59 ± 0.29, n=8; Welch’s ANOVA tests with Dunnett’s multiple comparisons test – Recombinant: W(2,12.09) = 11.93, p=0.002; Neurons: W(3,12.42) = 16.74, p=0.0001); further details in Supplementary Table 1. b, Purification and cryo-EM images of the GluA1/2_γ8/CNIH2 complex. Left: Representative 4-12% Bis-Tris gel stained with coomassie blue, indicating elution of A1/2_γ8/C2 complex from FLAG beads. CNIH2 expression from the same purification is detected by probing for the C-terminal HA tag on western blot. Purification was performed reproducibly (4 times); refer to the Supplementary Figure for uncropped blots. Middle: A representative motion-corrected micrograph of the resting state A1/2_γ8/C2 complex (scale bar, 50 nm) among collected data. Right: Representative 2D class averages of the resting state A1/2_γ8/C2 complex. c, Left: Cryo-EM maps of the full-length AMPAR octamer, depicting the three domain layers, NTD, LBD and TMD, composed of the GluA1 (blue), GluA2 (red) heteromer associated with γ8 (green) and CNIH2 (orange). Right: Schematic of plasmid constructs and secondary protein structure of auxiliary subunits shown alongside.
Extended Data Figure 2
Extended Data Figure 2. Cryo-EM data processing workflow of the resting state A1/2_γ8/C2 complex.
Two datasets were first processed individually to remove particles lacking AMPAR features. Next, classifications focused on the LBD-TMD region were performed to separate CNIH-containing and CNIH-free particles, meanwhile classifications for full-length receptors were conducted to elucidate particles with a stable NTD signal. Subsequently, particles from the two datasets were combined together for refinement. Focused refinements were performed separately on the LBD-TMD gating core and the NTD region. To further improve the resolution, LBD and TMD are refined separately A structure of A1/2_γ8 (lacking CNIH2) was also resolved from the same dataset (containing only γ8 observed in 3D slice). CNIH density was further enhanced by applying first symmetry expansion on aligned particles from the TMD reconstruction, following by focused classification and refinement on only CNIH2 and the surrounding receptor transmembrane helices. Inset: Top view slices of the A1/2_γ8/C2 (left) and A1/2_γ8 (right). 3D maps at the TMD region show signal for transmembrane helices of γ8 (green) and CNIH2 (orange).
Extended Data Figure 3
Extended Data Figure 3. Cryo-EM data processing workflow of the active state A1/2_γ8/C2 complex.
The overall data processing procedure for the active state complex is similar to that of resting state complexes. Focused refinement was performed on the LBD-TMD gating core and individual LBD and TMD domain layers of the receptor. CNIH density was further improved by applying first symmetry expansion on aligned particles from the TMD reconstruction, followed by focused classification on CNIH alone, and finally focused refinement on CNIH together with surrounding receptor transmembrane helices. Particles lacking CNIH2 found in these datasets were not of high enough quality to provide a high-resolution structure.
Extended Data Figure 4
Extended Data Figure 4. Cryo-EM analysis of A1/2_γ8/C2 and A1/2_γ8 complexes.
a, Local resolution and Fourier shell correlation (FSC) of focused refinement maps at the TMD, CNIH2, LBD and NTD. Euler angle distribution of particles for cryo-EM reconstruction of the resting state A1/2_γ8/C2 complex. 3D maps are coloured based on local resolution estimation. Masked (red) or unmasked (blue) FSC of corresponding maps are both shown where FSC=0.143 (black line). b, Local resolution and FSC of focused refinements at the TMD and LBD. Euler angle distribution of particles for cryo-EM reconstruction of the resting state A1/2_γ8 complex. c, Local resolution, FSC of focused refinements at the TMD, CNIH2 and LBD. Euler angle distribution of particles for cryo-EM reconstruction of the active state A1/2_γ8/C2 complex. d, Model to map FSCs of A1/2_γ8/C2 LBD-TMD models in resting and active states, resting state NTD model and resting state A1/2_γ8 LBD-TMD model.
Extended Data Figure 5
Extended Data Figure 5. Features of A1/2_γ8/C2 NTD and LBD layers and quality of density in the TMD region.
a, Cryo-EM density and model of the resting state GluA1 (blue) and GluA2 (red) NTD dimer. GluA1-specific N-linked glycans are observed at N45 and N239 (green sticks). b, Cryo-EM density and model of A1/2 LBD dimer in the resting state. Density and model for the competitive antagonist NBQX bound to its orthosteric site in the LBD cleft. c, Top view of cryo-EM density and model of A1/2 LBD tetramer in the resting state. d, Cryo-EM density and model of A1/2 LBD dimer in the active state demonstrating a closure of the LBD ‘clamshell’. e, Top view of cryo-EM density and model of A1/2 LBD tetramer in the active state. Density and model of desensitization blocker cyclothiazide (CTZ) bound at the LBD dimer interface are shown in the insert. f, Cryo-EM density and model of transmembrane helices of A1/2_γ8/C2 in the resting state.
Extended Data Figure 6
Extended Data Figure 6. Cryo-EM data processing workflow of GluA2_γ8 homomeric complex.
Automatic particle picking was first applied on the raw images which had similar features to the A1/A2_γ8/C2 heteromeric complex (scale bar, 50nm). 2D classifications were then performed to remove particles lacking AMPAR features. In several side view 2D class averages, an additional layer of density (marked by a red arrowhead) beneath the micelle can be observed. Next, selected particles were used for separate 3D classifications on the full-length receptor (left panel) or on masked-out LBD-TMD regions (right panels). In each of the two classifications, ~10% of low-quality particles were removed and the remaining AMPAR-shaped class averages are presented (side- and bottom views). An additional layer was observed in the full-length classification (indicated by red arrow). 3D refinement was performed on all classes individually, slices of the TMD region from the refined maps are also shown, with γ8 densities only apparent at the B’D’ sites (indicated by green arrowheads).
Extended Data Figure 7
Extended Data Figure 7. γ8 and CNIH2 receptor binding sites and their relevant bound lipids.
a, Overlay of the A’C’ and B’D’ binding sites, showing reorientations of five residues along the M1 helices (GluA1 M1, red; GluA2 M1, blue). These changes are likely mediated by γ8 engaging GluA1 M1. b, Strong lipid densities (light blue, density shown in grey mesh) line the cavity between GluA2 M1 and M4. F515, F517 and L518 from GluA2 pre-M1 interact with the lipids from the upper leaflet. Other residues from GluA2 M1, M2 and GluA1 M3 involved in these interactions are shown as stick. c, LL1 binds to the γ8 N224 side chain, connecting TARP-γ8 to the GluA1 M2 pore helix. LL2 bridges between CNIH2 and the GluA2 M1 and M2 helices. d, ‘Open book’ view of the A’C’ binding site, displaying how the UL1, LL2 and LL3 lipids engage the receptor (left) and the CNIH2 M1 and M2 helices (right). Side chains in close proximity to lipids are shown. e, Superposition of CNIHs and their binding peripheral helices from the resting state A1/2_γ8/C2 (orange) and A2_C3 (grey, PDB 6PEQ) complexes. While the upper parts of CNIHs’ M1 and M2 helices are aligned together, the lower part of CNIH2 is kinked away from the receptor relative to CNIH3, this permits the accommodation of three CNIH2 binding-relevant lipids. Distance between W26 (C2) and C811 (A1) in A1/2_γ8/C2 and W26 (C3) and C815 (A2) in A2_C3 are measured. M1 and M4 from A1/A2_γ8/C2 resting state are coloured as in Figure 1. M1 and M4 for A2_C3 (PDB 6PEQ) are coloured in grey. Three CNIH2 binding-relevant lipids LL2, LL3 and UL1 are shown as pink stick. f, A density modeled as cholesterol occupies the pocket between CNIH2 M3 and M4, observed after focused refinement.
Extended Data Figure 8
Extended Data Figure 8. Features of the A1/2_γ8/C2 and A1/2_γ8 conduction pore.
a, Density of M2/M3 gating regions and their fit against models in the resting and active state. b, Pore dimensions of resting state A1/2_γ8 (left) and the resting (middle) and active (right) state of A1/2_γ8/C2 depicted by space-filling representation (HOLE program) with relevant side chains indicated as sticks. A comparison of pore radius across these three structures indicates a similar diameter of the receptor gate in resting state A1/2_γ8 (grey) and A1/2_γ8/C2 (orange), with a clear expansion observed in the active state A1/2_γ8/C2 (red) complex. Diameter differences at the Q/R site are mainly caused by conformational variations at R586 side chain among these three models. c, Pore dimensions measured between Cα of GluA1 Q582 and GluA2 R586 in resting state A1/2_γ8 (left), A1/2_γ8/C2 (middle) and active state A1/2_γ8/C2 (right). Upon receptor activation, the distance between GluA2 R586 is increased by ~1 Å in A1/2_γ8/C2. d, Distance measured between Cα of GluA1 C585 and GluA2 C589 at A1/2_γ8 resting state (left), A1/2_γ8/C2 resting (middle) and active (right) state. The corresponding EM densities are shown as mesh. Upon receptor activation, the distance between GluA2 C589 also increased by ~1.5 Å in A1/2_γ8/C2. All diameter labels are measured in Å. e, Charge distribution maps of the intracellular face of A1/2_γ8/C2 (red: -5 kBT/e, blue: 5 kBT/e) in the resting (top) and active (bottom) state indicate a dilation of the pore entrance in the direction of GluA2, but not GluA1 during receptor activation.
Extended Data Figure 9
Extended Data Figure 9. Conformational changes of A1/2_γ8/C2 during receptor activation.
a, Top view superposition along the pore axis of A1/2_γ8/C2 in resting (grey) and active (red) states shows dilation of receptor and rotation of γ8 and C2 during activation. b, Superposition of A1/2_γ8/C2 in resting (grey) and active (coloured) states along the pore axis shows the conformational change of GluA2 M1 and M3 linkers as well as the LBD region upon receptor activation. The GluA2 M3 linker moves towards M1 linker, while the latter approaches γ8 ‘acidic’ β4 loop. The LBD ‘KGK’ motif also moves towards the γ8 ‘acidic’ loop. c, d, Conformational change of γ8 and C2 during receptor activation. Models are aligned along the pore axis. The translation of the Cα atoms from the resting to active state is indicated as arrows for every second residue. Arrows indicate the direction and distance of helical movements; these were determined for all Cα atoms between the two states relative to the COM of a given auxiliary subunit. Auxiliary subunits come together on the GluA1 pre-M1 side (c), but are separated on the GluA2 pre-M1 side (d). Zoomed-in panel (c) indicates a contact between the γ8 M4 helix and the base of the GluA1 M1/2 cytoplasmic loop formed during receptor activation.
Extended Data Figure 10
Extended Data Figure 10. Flag IP, immunostaining, and electrophysiology of CNIH homologues and CNIH2 mutants in complex with GluA1 or GluA2 homomers.
a, Flag IP of CNIH homologues and CNIH2 mutants in complex with Flag tagged GluA2 homomers. CNIH12CHIM, CNIH 1 and CNIH2 chimera with a fragment of CNIH2 (51-RERLKNIERICCLLRK-66) inserted into CNIH1 between P50 and L51; F3L, CNIH2 F3L; F5L, CNIH2 F5L; F8L, CNIH2 F8L; CNIH2 3FL, mutate all three phenylalanine 3, 5, 8 in CNIH2 to leucine; FT, flow through. IPs were performed reproducibly (3 times); refer to the Supplementary Figure for uncropped blots. b, Surface CNIH fluorescence (left), Total CNIH fluorescence (middle) and Surface/Total ratio (right) for CNIH homologues and CNIH2 mutants in complex with GluA2 (Surface CNIH (AU) - No CNIH: 0.21 ± 0.15, n=80; CNIH1: 6.60 ± 0.63, n=46; CNIH2: 7.54 ± 0.56, n=55; CNIH3: 8.07 ± 0.64, n=61; CNIH12CHIM: 8.56 ± 0.69, n=61; F3L: 4.42 ± 0.80, n=17; F5L: 4.25 ± 0.40, n=50; F8L: 8.36 ± 0.75, n=34; 3FL: 1.67 ± 0.22, n=50; Kruskal-Wallis test: H(8) = 256.3, p<0.0001. Total CNIH (AU) - No CNIH: 0.02 ± 0.06, n=80; CNIH1: 21.5 ± 2.03, n=46; CNIH2: 25.8 ± 2.08, n=55; CNIH3: 25.2 ± 2.19, n=61; CNIH12CHIM: 25.0 ± 1.49, n=61; F3L: 12.7 ± 1.85, n=17; F5L: 16.2 ± 1.97, n=50; F8L: 24.6 ± 2.00, n=34; 3FL: 27.3 ± 2.42, n=50; Kruskal-Wallis test: H(8) = 230.1, p<0.0001. Surface/Total - CNIH1: 0.34 ± 0.03, n=46; CNIH2: 0.39 ± 0.04, n=55; CNIH3: 0.42 ± 0.04, n=61; CNIH12CHIM: 0.36 ± 0.02, n=61; F3L: 0.41 ± 0.08, n=17; F5L: 0.35 ± 0.03, n=50; F8L: 0.39 ± 0.04, n=34; 3FL: 0.07 ± 0.01, n=50; One-sample Wilcoxon test (Median = 0), p<0.0001; further details in Supplementary Table 3. Homologues CNIH1, CNIH2 and CNIH3 show robust surface expression. CNIH2 mutants F3L, F5L and F8L, as well as the CNIH12CHIM chimera, also traffic to the cell surface, whereas 3FL does not. F3L and F5L CNIH2 mutants show decreased total and, consequently, surface expression levels; to ensure the AMPARs in our electrophysiology experiments were still saturated with CNIHs we used a 1:2 AMPAR:CNIH co-transfection ratio. Increasing this ratio further to 1:4 for F3L & F5L did not affect the gating properties, suggesting that the observed change in AMPAR modulation by these mutants is not caused by their lower (surface) expression. c, Representative images showing surface CNIH (green), total CNIH (magenta) and total GluA2 (blue). d, Equilibrium current (Fig. 3a data set): (% peak) – GluA2 alone: 1.03 ± 0.19, n=15; CNIH2 WT: 24.72, ± 4.55, n=9; F3L: 9.25 ± 1.16, n=7; F5L: 8.96 ± 1.16, n=9; F8L: 8.05 ± 1.00, n=6; 3FL: 2.01 ± 0.28, n=9; Welch’s ANOVA with Dunnett’s multiple comparisons test: W(5,17.48) = 27.95, p<0.0001). e, Equilibrium current (Fig. 3c data set): GluA2 alone: 1.33 ± 0.50, n=6; CNIH1: 3.52 ± 0.56, n=12; CNIH12CHIM: 10.93 ± 1.16, n=11; CNIH2: 19.77 ± 1.93, n=7; Welch’s ANOVA with Dunnett’s multiple comparisons test, W(3,15.36) = 40.08, p<0.0001); further details in Supplementary Table 2.
Fig. 1
Fig. 1. Physiology and architecture of the GluA1/2_γ8 /CNIH2 complex.
a,b, Auxiliary subunits slow desensitization rates of recombinant receptors (a, left). Native AMPARs show diverse properties (a, right), with A1/2_γ8 +CNIH2 recapitulating CA1 & CA3-like kinetics (b, weighted τdes (ms), mean ± SEM). Recombinant receptors: GluA1/2: 6.01 ± 0.31, n=9; +γ8: 9.29 ± 0.53, n=12; +CNIH2+γ8: 19.71 ± 1.27, n=9. Neuronal receptors: CA1 pyramidal: 21.03 ± 1.19, n=14; CA3 pyramidal 24.51 ± 1.69, n=5; DG granule cell: 8.38 ± 1.01, n=6; CA1 stratum radiatum interneurons: 4.48 ± 0.55, n=8; Welch’s ANOVA tests with Dunnett’s multiple comparisons test - Recombinant: W(2,15.11) = 60.68, p<0.0001; Neurons: W(3,11.60) = 76.28, p<0.0001; see Supplementary Table 1 for details). Boxes represent 25 % to 75 % percentile, whiskers minimum/maximum values and central line median. c-e, Cryo-EM maps, depicting the LBD and TMD domain layers. Core subunits positioned to AC/BD, and auxiliary subunits at A’C’/B’D’ sites are shown. (c) Front view, depicting γ8 at the B’D’ sites. (d) Side view, visualising CNIH2 at A’C’ sites. Inset: lipids concentrating at the TMD, beneath the GluA2 pre-M1 helix. (e) Bottom view, highlighting CNIH2 binding to GluA2 transmembrane helices M1-3 (red), and γ8 to the GluA1 M1-3 helices (blue). f, Model of CNIH2, including the M1/2 and M3/4 cytosolic loops, docking to its binding site (M1GluA2 [red] M4GluA1 [blue]). g, CNIH2 Phe3, -5, -8 slotting into its binding site close to Cys528 (GluA2) and Leu785 (GluA1). h, CNIH2 contacts at the bottom of the binding site, mediated by Phe23 and Lys66; lipid (UL1) penetrates the A’C’ site and interacts with GluA2 Phe546. i, A’C’ (left) and B’D’ (right) site surface representation. M1A2 and M4A1 residues contacted by CNIH2 are coloured depending on the number of atoms contributing to the interaction (red: high, blue: low). Contacts were counted using ‘findNeighbors’ in ProDy’, with a 4.5 Å cutoff between heavy atoms.
Fig. 2
Fig. 2. Gating transitions of the A1/2_γ8/C2 octamer.
a, View onto a GluA1/GluA2 LBD dimer and M3 gating helices (bold) in the resting state. b, Side view onto the M3 gate with open (bold colour) and resting (soft colour) states overlain, depicting rearrangement of the M3 linkers and M3 side chains relative to pre-M1. c, Comparison of GluA1 and GluA2 conduction path; resting state (grey) is superimposed on the active state (colour). Divergence from the closed gate at the top of M3 is more pronounced in GluA2 (Cα distances between opposing T621 (GluA1), and T625 (GluA2) indicated). Also shown is the selectivity filter with the Q/R site. d, Top view onto the closed-(grey) and open-state (colour) models at the level of the M3 gate. The dilation of the gate-surrounding helices is measured between opposing pre-M1 helices. Rotation angles were calculated by averaging angular displacements of all Cα atoms in each auxiliary subunit between the two states relative to center of mass of each auxiliary subunits. e, Side view showing outward expansion of the upper part of GluA1 M1 and M3 and the γ8 β-sheet, accompanied by inward movement of the γ8 M4 helix towards the GluA1 M12 loop. f, CNIH2 undergoes a ~3° pivot (‘tilt’) on activation, moving its M12 loop closer to the pore axis.
Fig. 3
Fig. 3. Mechanism of AMPAR modulation by CNIH2.
a, Mutations of three phenylalanines in the CNIH2 N-terminus speed GluA2 desensitization: weighted τdes (ms), mean ± SEM – GluA2 alone: 6.16 ± 0.35, n=15; CNIH2: 44.32 ± 4.58, n=9; F3L: 27.73 ± 1.58, n=7; F5L: 24.85 ± 1.43, n=9; F8L: 22.57 ± 1.40, n=6; 3FL: 10.07 ± 0.46, n=9; Welch’s ANOVA with Dunnett’s multiple comparisons test: W(5,17.83) = 85, p<0.0001; further details in Supplementary Table 2. Boxes represent 25 % to 75 % percentile, whiskers minimum/maximum values and central line median. b, Sequence alignment of mouse CNIH1-3, highlighting the conserved N-terminal phenylalanines and the M2-N region, where CNIH1 lacks 16 residues; Pro70 is shown in cyan. c, The CNIH2 M2-N helix contributes to modulation of GluA2 kinetics, demonstrated by a gain-of-function when transplanted onto CNIH1: weighted τdes (ms), mean ± SEM – GluA2 alone: 6.03 ± 0.47, n=6; CNIH1: 12.22 ± 1.20, n=12; CNIH12chimera: 23.48 ± 1.39, n=11; CNIH2: 40.45 ± 4.32, n=7; Welch’s ANOVA with Dunnett’s multiple comparisons test: W(3,15.30) = 64.09, p<0.0001; further details in Supplementary Table 2. Box plot parameters as in b. d, Superposition of CNIH2 (orange) and CNIH3 (grey; PDB 6PEQ), using the top of their M1 and M2 helices. CNIH2 M2-N (purple) kinks at Pro70 (cyan) and diverges from CNIH3 by ~ 10° (inset); the N-terminal phenylalanines are also indicated. An interaction with the M3/4 loop through Val115 and Arg65 is shown, Arg55 and Arg59 project toward the pore axis. e, Molecular mechanism underlying AMPAR modulation by CNIH2.

Comment in

References

    1. Traynelis SF, et al. Glutamate receptor ion channels: structure, regulation, and function. Pharmacol Rev. 2010;62:405–496. doi: 10.1124/pr.109.002451. - DOI - PMC - PubMed
    1. Greger IH, Watson JF, Cull-Candy SG. Structural and Functional Architecture of AMPA-Type Glutamate Receptors and Their Auxiliary Proteins. Neuron. 2017;94:713–730. doi: 10.1016/j.neuron.2017.04.009. - DOI - PubMed
    1. Jonas P. The Time Course of Signaling at Central Glutamatergic Synapses. News Physiol Sci. 2000;15:83–89. - PubMed
    1. Schwenk J, et al. High-resolution proteomics unravel architecture and molecular diversity of native AMPA receptor complexes. Neuron. 2012;74:621–633. doi: 10.1016/j.neuron.2012.03.034. - DOI - PubMed
    1. Shanks NF, et al. Differences in AMPA and kainate receptor interactomes facilitate identification of AMPA receptor auxiliary subunit GSG1L. Cell Rep. 2012;1:590–598. doi: 10.1016/j.celrep.2012.05.004. - DOI - PMC - PubMed

Publication types

MeSH terms

LinkOut - more resources