

Forecasting the Tuberculosis Incidence Using a Novel Ensemble Empirical Mode Decomposition-Based Data-Driven Hybrid Model in Tibet, China
- PMID: 34079304
- PMCID: PMC8164697
- DOI: 10.2147/IDR.S299704
Forecasting the Tuberculosis Incidence Using a Novel Ensemble Empirical Mode Decomposition-Based Data-Driven Hybrid Model in Tibet, China
Abstract
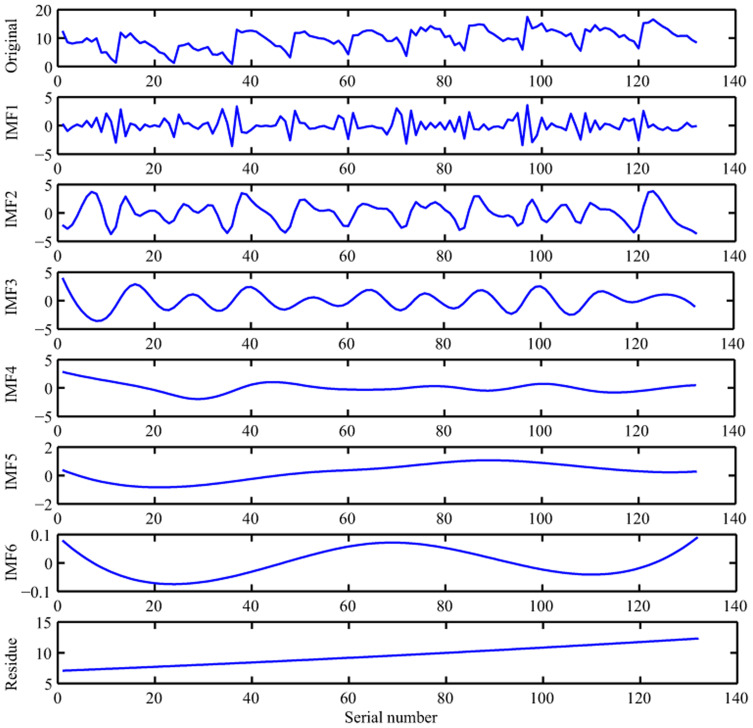
Objective: The purpose of this study is to develop a novel data-driven hybrid model by fusing ensemble empirical mode decomposition (EEMD), seasonal autoregressive integrated moving average (SARIMA), with nonlinear autoregressive artificial neural network (NARNN), called EEMD-ARIMA-NARNN model, to assess and forecast the epidemic patterns of TB in Tibet.
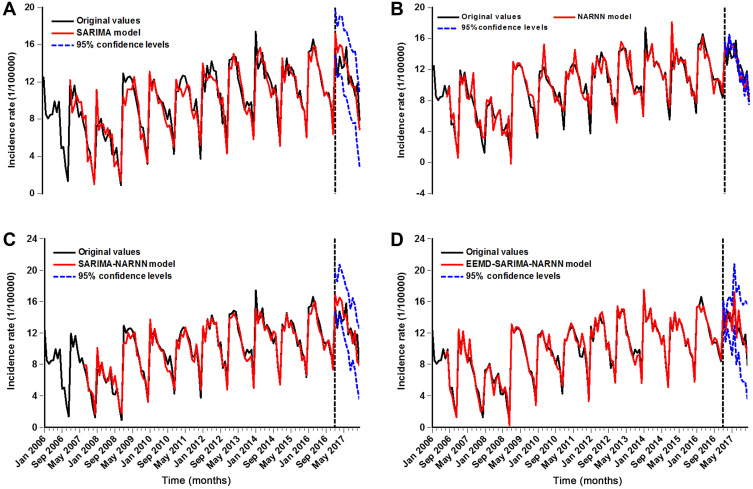
Methods: The TB incidence from January 2006 to December 2017 was obtained, and then the time series was partitioned into training subsamples (from January 2006 to December 2016) and testing subsamples (from January to December 2017). Among them, the training set was used to develop the EEMD-SARIMA-NARNN combined model, whereas the testing set was used to validate the forecasting performance of the model. Whilst the forecasting accuracy level of this novel method was compared with the basic SARIMA model, basic NARNN model, error-trend-seasonal (ETS) model, and traditional SARIMA-NARNN mixture model.
Results: By comparing the accuracy level of the forecasting measurements including root-mean-square error, mean absolute deviation, mean error rate, mean absolute percentage error, and root-mean-square percentage error, it was shown that the EEMD-SARIMA-NARNN combined method produced lower error rates than the others. The descriptive statistics suggested that TB was a seasonal disease, peaking in late winter and early spring and a trough in autumn and early winter, and the TB epidemic indicated a drastic increase by a factor of 1.7 from 2006 to 2017 in Tibet, with average annual percentage change of 5.8 (95% confidence intervals: 3.5-8.1).
Conclusion: This novel data-driven hybrid method can better consider both linear and nonlinear components in the TB incidence than the others used in this study, which is of great help to estimate and forecast the future epidemic trends of TB in Tibet. Besides, under present trends, strict precautionary measures are required to reduce the spread of TB in Tibet.
Keywords: forecasting; incidence rate; statistical models; time series analysis; tuberculosis.
© 2021 Li et al.
Conflict of interest statement
The authors report no conflicts of interest in this work.
Figures
Similar articles
-
Temporal trends analysis of tuberculosis morbidity in mainland China from 1997 to 2025 using a new SARIMA-NARNNX hybrid model.BMJ Open. 2019 Jul 31;9(7):e024409. doi: 10.1136/bmjopen-2018-024409. BMJ Open. 2019. PMID: 31371283 Free PMC article.
-
An Advanced Data-Driven Hybrid Model of SARIMA-NNNAR for Tuberculosis Incidence Time Series Forecasting in Qinghai Province, China.Infect Drug Resist. 2020 Mar 24;13:867-880. doi: 10.2147/IDR.S232854. eCollection 2020. Infect Drug Resist. 2020. PMID: 32273731 Free PMC article.
-
Time series model for forecasting the number of new admission inpatients.BMC Med Inform Decis Mak. 2018 Jun 15;18(1):39. doi: 10.1186/s12911-018-0616-8. BMC Med Inform Decis Mak. 2018. PMID: 29907102 Free PMC article.
-
Applying SARIMA, ETS, and hybrid models for prediction of tuberculosis incidence rate in Taiwan.PeerJ. 2022 Sep 21;10:e13117. doi: 10.7717/peerj.13117. eCollection 2022. PeerJ. 2022. PMID: 36164599 Free PMC article.
-
Forecasting tuberculosis incidence: a review of time series and machine learning models for prediction and eradication strategies.Int J Environ Health Res. 2024 Jun 25:1-16. doi: 10.1080/09603123.2024.2368137. Online ahead of print. Int J Environ Health Res. 2024. PMID: 38916208 Review.
Cited by
-
Estimating the COVID-19 prevalence and mortality using a novel data-driven hybrid model based on ensemble empirical mode decomposition.Sci Rep. 2021 Nov 1;11(1):21413. doi: 10.1038/s41598-021-00948-6. Sci Rep. 2021. PMID: 34725416 Free PMC article.
-
Deep evolutionary fusion neural network: a new prediction standard for infectious disease incidence rates.BMC Bioinformatics. 2024 Jan 23;25(1):38. doi: 10.1186/s12859-023-05621-5. BMC Bioinformatics. 2024. PMID: 38262917 Free PMC article.
-
Spatial and temporal analysis and forecasting of TB reported incidence in western China.BMC Public Health. 2024 Sep 13;24(1):2504. doi: 10.1186/s12889-024-19994-6. BMC Public Health. 2024. PMID: 39272092 Free PMC article.
-
Estimating the Effects of the COVID-19 Outbreak on the Reductions in Tuberculosis Cases and the Epidemiological Trends in China: A Causal Impact Analysis.Infect Drug Resist. 2021 Nov 6;14:4641-4655. doi: 10.2147/IDR.S337473. eCollection 2021. Infect Drug Resist. 2021. PMID: 34785913 Free PMC article.
-
A hybrid forecasting technique for infection and death from the mpox virus.Digit Health. 2023 Oct 3;9:20552076231204748. doi: 10.1177/20552076231204748. eCollection 2023 Jan-Dec. Digit Health. 2023. PMID: 37799502 Free PMC article.
References
-
- WHO. Global tuberculosis report 2020. Available from: https://apps.who.int/iris/handle/10665/336069. Accessed December25, 2020.
LinkOut - more resources
Full Text Sources
