. 2021 May 17:13:658605.
doi: 10.3389/fnagi.2021.658605. eCollection 2021.

Molecular Pathobiology of the Cerebrovasculature in Aging and in Alzheimers Disease Cases With Cerebral Amyloid Angiopathy

Affiliations

Molecular Pathobiology of the Cerebrovasculature in Aging and in Alzheimers Disease Cases With Cerebral Amyloid Angiopathy

Joseph O Ojo et al. Front Aging Neurosci. .

Abstract

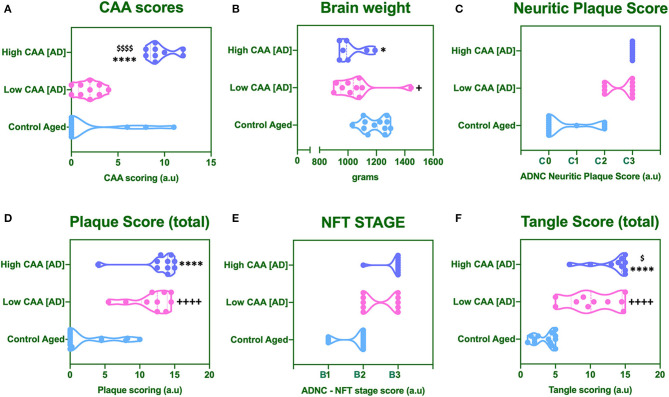
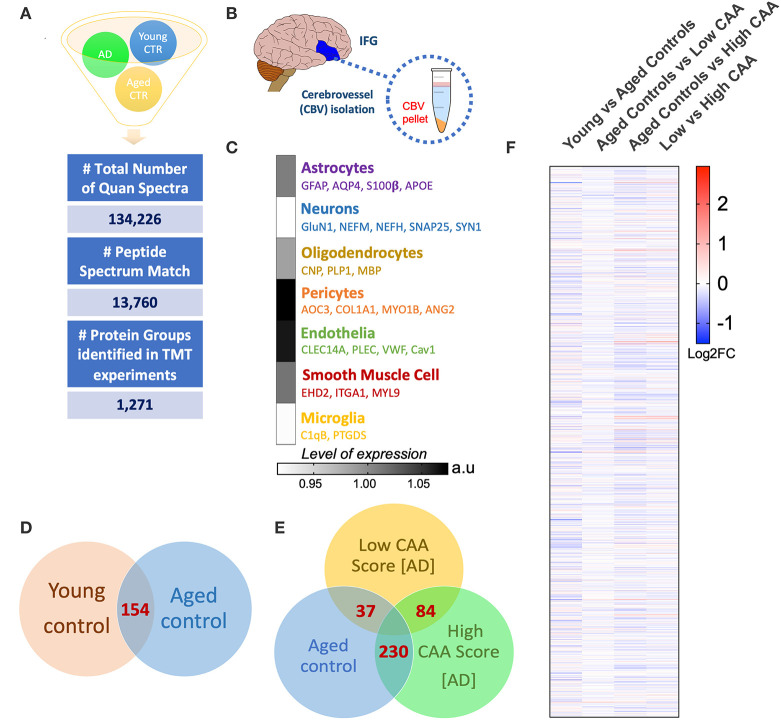
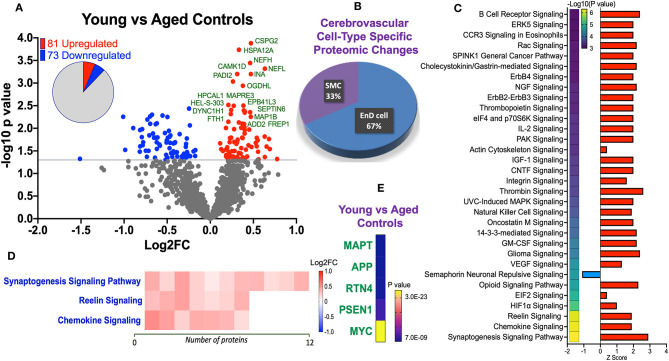
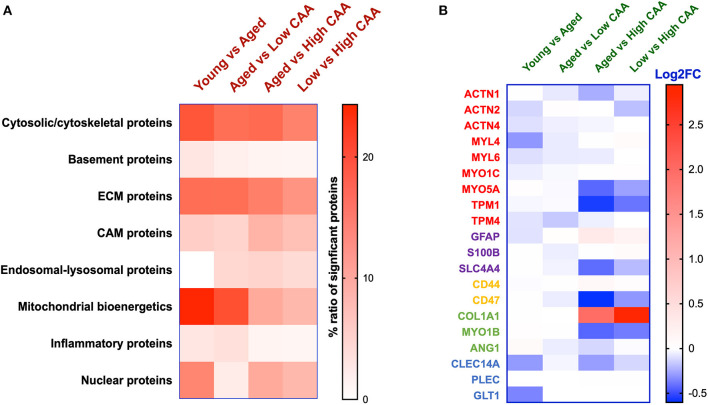
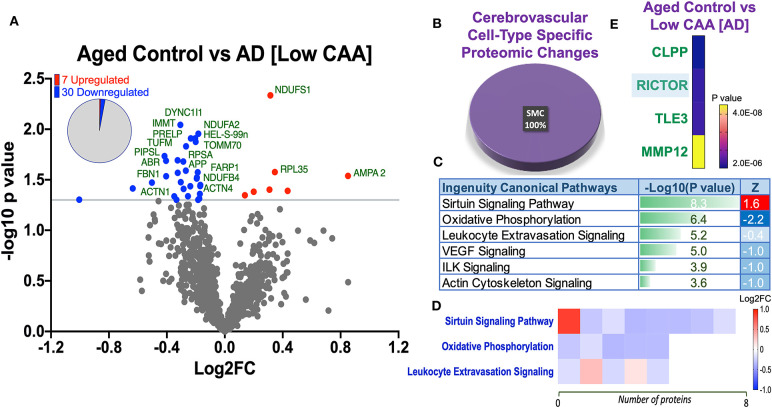
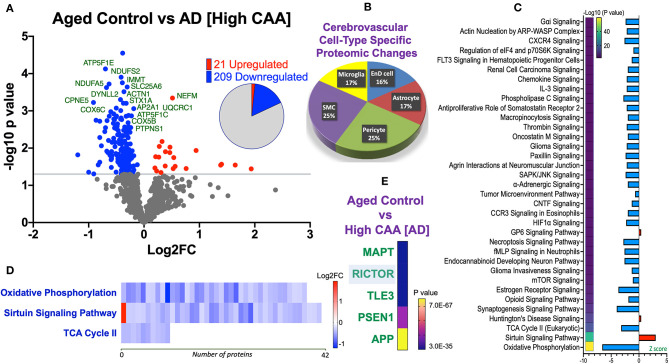
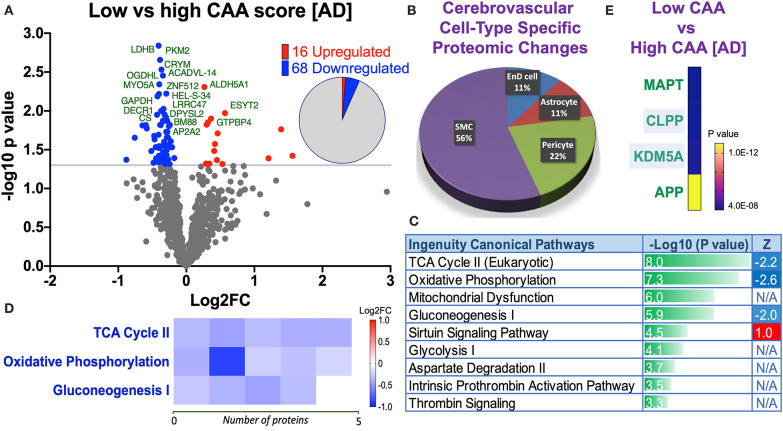
Cerebrovascular dysfunction and cerebral amyloid angiopathy (CAA) are hallmark features of Alzheimer's disease (AD). Molecular damage to cerebrovessels in AD may result in alterations in vascular clearance mechanisms leading to amyloid deposition around blood vessels and diminished neurovascular-coupling. The sequelae of molecular events leading to these early pathogenic changes remains elusive. To address this, we conducted a comprehensive in-depth molecular characterization of the proteomic changes in enriched cerebrovessel fractions isolated from the inferior frontal gyrus of autopsy AD cases with low (85.5 ± 2.9 yrs) vs. high (81 ± 4.4 yrs) CAA score, aged-matched control (87.4 ± 1.5 yrs) and young healthy control (47 ± 3.3 yrs) cases. We employed a 10-plex tandem isobaric mass tag approach in combination with our ultra-high pressure liquid chromatography MS/MS (Q-Exactive) method. Enriched cerebrovascular fractions showed very high expression levels of proteins specific to endothelial cells, mural cells (pericytes and smooth muscle cells), and astrocytes. We observed 150 significantly regulated proteins in young vs. aged control cerebrovessels. The top pathways significantly modulated with aging included chemokine, reelin, HIF1α and synaptogenesis signaling pathways. There were 213 proteins significantly regulated in aged-matched control vs. high CAA cerebrovessels. The top three pathways significantly altered from this comparison were oxidative phosphorylation, Sirtuin signaling pathway and TCA cycle II. Comparison between low vs. high CAA cerebrovessels identified 84 significantly regulated proteins. Top three pathways significantly altered between low vs. high CAA cerebrovessels included TCA Cycle II, Oxidative phosphorylation and mitochondrial dysfunction. Notably, high CAA cases included more advanced AD pathology thus cerebrovascular effects may be driven by the severity of amyloid and Tangle pathology. These descriptive proteomic changes provide novel insights to explain the age-related and AD-related cerebrovascular changes contributing to AD pathogenesis. Particularly, disturbances in energy bioenergetics and mitochondrial biology rank among the top AD pathways altered in cerebrovessels. Targeting these failed mechanisms in endothelia and mural cells may provide novel disease modifying targets for developing therapeutic strategies against cerebrovascular deterioration and promoting cerebral perfusion in AD. Our future work will focus on interrogating and validating these novel targets and pathways and their functional significance.

Keywords: Alzheimers disease; cerebral amyloid angiopathy; cerebrovasculature; endothelial cells; mass spectrometry; mural cells; perivascular cells; proteomics.


Conflict of interest statement

JR was employed by company Boehringer Ingelheim Pharmaceuticals, Inc. The remaining authors declare that the research was conducted in the absence of any commercial or financial relationships that could be construed as a potential conflict of interest.

Figures

Figure 1
Figure 1
Cerebral amyloid angiopathy [CAA] (A), mean brain weight in grams (B) and neuropathological scores for Neuritic Plaque (C), Total Amyloid plaque score (D), NFT staging (E), and total tangle pathology score (F). Data was analyzed by one way ANOVA with Holm-Sidak post-hoc test. *P < 0.05 and ****P < 0.0001 (for Control Aged vs. High CAA group); +P < 0.05 and ++++P < 0.0001 (for Control Aged vs. Low CAA group); $P < 0.05, and $$$$P < 0.0001 (for Low vs. High CAA group).
Figure 2
Figure 2
Summary of liquid chromatography/mass spectrometry (LC/MS) and proteomic analyses of isolated cerebrovascular tissue from the inferior frontal gyrus in Alzheimer's disease (AD) and young/aged matched control cases. (A) Shows identified total number of quantified spectra, peptide spectrum matches and non-redundant master protein groups from all plexes used for quantitative proteomic analyses of (B) isolated cerebrovascular tissue from the inferior frontal gyrus [IFG]. (C) Data shows expression levels of distinct genes associated with specific cell types identified from our proteomic analyses of the isolated cerebrovasculature. Data represent abundant ratio expressed in arbitrary units. Venn diagram in (D,E) shows overlapping significantly regulated proteins by t-test in the comparisons between young vs. aged healthy controls cases and Low CAA vs. High CAA vs. Age-matched controls, respectively. (F) Shows heat map of proteins identified from our proteomic analyses between young vs. aged controls, aged control vs. low CAA, aged controls vs. high CAA and low vs. high CAA groups (data represent Log2 fold change).
Figure 3
Figure 3
Proteomic changes, cell origin, signaling pathways, upstream regulator factors observed in the cerebrovasculature isolated from the inferior frontal gyrus of young and aged controls. (A) Volcano plot of differentially expressed proteins in young and aged controls (pie chart inset shows up/down-regulated proteins, significant cut off set at 1.3 and red and blue points indicated up- or down-regulated significant proteins, respectively). (B) Pie Chart show origin of cell types where significant proteins from the comparisons between young and aged controls are observed. Data are generated from the number of significantly regulated proteins per specific cell type (from the PanglaoDB omic database), expressed as a percentage. (C) Canonical pathways identified from ingenuity pathway analyses [data depict –log10 (P-value) and Z score generated from Fischer test of an overlap with the IPA knowledgebase; blue—downregulated and red—upregulated], and (D) shows heat map of the top 3 pathways and the corresponding number of significantly regulated proteins altered per pathway and their Log2 fold change expression level. (E) Shows Top 5 identified upstream regulators from the ingenuity pathway analyses of differentially regulated proteins in young vs. aged control cases.
Figure 4
Figure 4
Ratio of significantly regulated proteins per subcellular localization or biological function and Cell specific proteins expression levels identified in cerebrovasculature of young and aged controls, and AD cases staged by low vs. high CAA score. (A) Data shows percentage of significantly altered proteins associated with a biological function or subcellular localization. ECM—Extracellular matrix protein, CAM—cellular adhesion molecule. (B) Data shows cell specific proteins expression levels. Proteins in red represents smooth muscle cell markers, purple (astrocytes), yellow (microglia), pericytes (green), blue (endothelial cells). Data shows Log2 fold change (note: not all cell specific proteins depicted passed the set cut-off value of P < 0.05).
Figure 5
Figure 5
Proteomic changes, cell origin, signaling pathways, upstream regulator factors observed from the cerebrovasculature isolated from the inferior frontal gyrus of low CAA vs. aged-matched control cases. (A) Volcano plot of differentially expressed proteins in low CAA vs. aged-matched control cases (pie chart inset shows up/down-regulated proteins, significant cut off set at 1.3 and red and blue points indicated up- or down-regulated significant proteins, respectively). (B) Pie Chart show origin of cell types where significant proteins from the comparisons between low CAA vs. aged-matched control cases are observed. Data are generated from the number of significantly regulated proteins per specific cell type (from the PanglaoDB omic database), expressed as a percentage. (C) Canonical pathways identified from ingenuity pathway analyses [data depict –log10 [P-value] and Z score generated from Fischer test of an overlap with the IPA knowledgebase; blue—downregulated and red—upregulated], and (D) shows heat map of the top 3 pathways and the corresponding number of significantly regulated proteins altered per pathway and their Log2 fold change expression level. (E) Shows Top 4 identified upstream regulators from the ingenuity pathway analyses of differentially regulated proteins in low CAA vs. aged-matched control cases (light blue highlighted text indicates that the upstream regulator is predicted to be activated).
Figure 6
Figure 6
Proteomic changes, cell origin, signaling pathways, upstream regulator factors observed from the cerebrovasculature isolated from the inferior frontal gyrus of high CAA vs. aged-matched control cases. (A) Volcano plot of differentially expressed proteins in high CAA vs. aged-matched control cases (pie chart inset shows up/down-regulated proteins, significant cut off set at 1.3 and red and blue points indicated up- or down-regulated significant proteins, respectively). (B) Pie Chart show origin of cell types where significant proteins from the comparisons between high CAA vs. aged-matched control cases are observed. Data are generated from the number of significantly regulated proteins per specific cell type (from the PanglaoDB omic database), expressed as a percentage. (C) Canonical pathways identified from ingenuity pathway analyses [data depict –log10 (P-value) and Z score generated from Fischer test of an overlap with the IPA knowledgebase; blue—downregulated and red—upregulated], and (D) shows heat map of the top 3 pathways and the corresponding number of significantly regulated proteins altered per pathway and their Log2 fold change expression level. (E) Shows Top 5 identified upstream regulators from the ingenuity pathway analyses of differentially regulated proteins in high CAA vs. aged-matched control cases (light blue highlighted text indicates that the upstream regulator is predicted to be activated).
Figure 7
Figure 7
Proteomic changes, cell origin, signaling pathways, upstream regulator factors observed from the cerebrovasculature isolated from the inferior frontal gyrus of low and high CAA [AD] cases. (A) Volcano plot of differentially expressed proteins in low vs. high CAA [AD] cases (pie chart inset shows up/down-regulated proteins, significant cut off set at 1.3 and red and blue points indicated up- or down-regulated significant proteins, respectively). (B) Pie Chart show origin of cell types where significant proteins from the comparisons between low and high CAA [AD] cases are observed. Data are generated from the number of significantly regulated proteins per specific cell type (from the PanglaoDB omic database), expressed as a percentage. (C) Canonical pathways identified from ingenuity pathway analyses (data depict –log10 [P-value] and Z score generated from Fischer test of an overlap with the IPA knowledgebase; blue—downregulated and red—upregulated), and (D) shows heat map of the top 3 pathways and the corresponding number of significantly regulated proteins altered per pathway and their Log2 fold change expression level. (E) Shows Top 4 identified upstream regulators from the ingenuity pathway analyses of differentially regulated proteins in low and high CAA [AD] cases (light blue highlighted text indicates that the upstream regulator is predicted to be activated).

Similar articles

Cited by

References

    1. Alonzo N. C., Hyman B. T., Rebeck G. W., Greenberg S. M. (1998). Progression of cerebral amyloid angiopathy: accumulation of amyloid- β40 in affected vessels. J. Neuropathol. Exp. Neurol. 57, 353–359. 10.1097/00005072-199804000-00008 - DOI - PubMed
    1. Badhwar A., Brown R., Stanimirovic D. B., Haqqani A. S., Hamel E. (2017). Proteomic differences in brain vessels of Alzheimer's disease mice: normalization by PPARI 3 agonist pioglitazone. J. Cereb. Blood Flow Metab. 37, 1120–1136. 10.1177/0271678X16655172 - DOI - PMC - PubMed
    1. Bai B., Wang X., Li Y., Chen P. C., Yu K., Dey K. K., et al. . (2020). Deep multilayer brain proteomics identifies molecular networks in Alzheimer's disease progression. Neuron 105, 975–991.e7. 10.1016/j.neuron.2019.12.015 - DOI - PMC - PubMed
    1. Beach T. G., Wilson J. R., Sue L. I., Newell A., Poston M., Cisneros R., et al. . (2007). Circle of Willis atherosclerosis: association with Alzheimer's disease, neuritic plaques and neurofibrillary tangles. Acta Neuropathol. 113, 13–21. 10.1007/s00401-006-0136-y - DOI - PubMed
    1. Bell R. D., Winkler E. A., Singh I., Sagare A. P., Deane R., Wu Z., et al. . (2012). Apolipoprotein e controls cerebrovascular integrity via cyclophilin A. Nature 485, 512–516. 10.1038/nature11087 - DOI - PMC - PubMed

LinkOut - more resources