

Compositional Data Analysis of Periodontal Disease Microbial Communities
- PMID: 34079525
- PMCID: PMC8165185
- DOI: 10.3389/fmicb.2021.617949
Compositional Data Analysis of Periodontal Disease Microbial Communities
Abstract
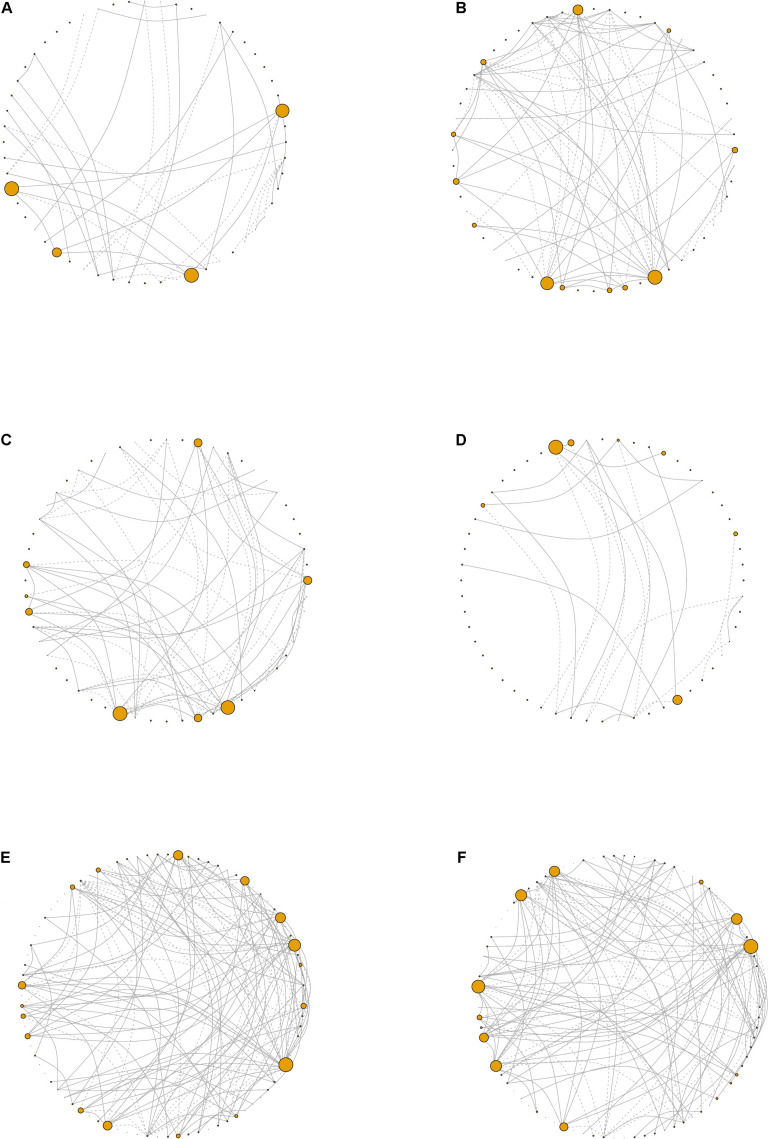
Periodontal disease (PD) is a chronic, progressive polymicrobial disease that induces a strong host immune response. Culture-independent methods, such as next-generation sequencing (NGS) of bacteria 16S amplicon and shotgun metagenomic libraries, have greatly expanded our understanding of PD biodiversity, identified novel PD microbial associations, and shown that PD biodiversity increases with pocket depth. NGS studies have also found PD communities to be highly host-specific in terms of both biodiversity and the response of microbial communities to periodontal treatment. As with most microbiome work, the majority of PD microbiome studies use standard data normalization procedures that do not account for the compositional nature of NGS microbiome data. Here, we apply recently developed compositional data analysis (CoDA) approaches and software tools to reanalyze multiomics (16S, metagenomics, and metabolomics) data generated from previously published periodontal disease studies. CoDA methods, such as centered log-ratio (clr) transformation, compensate for the compositional nature of these data, which can not only remove spurious correlations but also allows for the identification of novel associations between microbial features and disease conditions. We validated many of the studies' original findings, but also identified new features associated with periodontal disease, including the genera Schwartzia and Aerococcus and the cytokine C-reactive protein (CRP). Furthermore, our network analysis revealed a lower connectivity among taxa in deeper periodontal pockets, potentially indicative of a more "random" microbiome. Our findings illustrate the utility of CoDA techniques in multiomics compositional data analysis of the oral microbiome.
Keywords: C-reactive protein; CLR; compositional data analysis; microbiome; oral microbiome; periodontal disease.
Copyright © 2021 Sisk-Hackworth, Ortiz-Velez, Reed and Kelley.
Conflict of interest statement
The authors declare that the research was conducted in the absence of any commercial or financial relationships that could be construed as a potential conflict of interest.
Figures

Similar articles
-
An application of compositional data analysis to multiomic time-series data.NAR Genom Bioinform. 2020 Oct 2;2(4):lqaa079. doi: 10.1093/nargab/lqaa079. eCollection 2020 Dec. NAR Genom Bioinform. 2020. PMID: 33575625 Free PMC article.
-
Multi-omics Analysis of Periodontal Pocket Microbial Communities Pre- and Posttreatment.mSystems. 2017 Jun 20;2(3):e00016-17. doi: 10.1128/mSystems.00016-17. eCollection 2017 May-Jun. mSystems. 2017. PMID: 28744486 Free PMC article.
-
Variable selection in microbiome compositional data analysis.NAR Genom Bioinform. 2020 May 13;2(2):lqaa029. doi: 10.1093/nargab/lqaa029. eCollection 2020 Jun. NAR Genom Bioinform. 2020. PMID: 33575585 Free PMC article.
-
Compositional data analysis of the microbiome: fundamentals, tools, and challenges.Ann Epidemiol. 2016 May;26(5):330-5. doi: 10.1016/j.annepidem.2016.03.002. Epub 2016 Mar 31. Ann Epidemiol. 2016. PMID: 27255738 Review.
-
Understanding the microbial components of periodontal diseases and periodontal treatment-induced microbiological shifts.J Med Microbiol. 2021 Jan;70(1). doi: 10.1099/jmm.0.001247. Epub 2020 Dec 4. J Med Microbiol. 2021. PMID: 33295858 Review.
Cited by
-
Ecological shifts of salivary microbiota associated with metabolic-associated fatty liver disease.Front Cell Infect Microbiol. 2023 Feb 14;13:1131255. doi: 10.3389/fcimb.2023.1131255. eCollection 2023. Front Cell Infect Microbiol. 2023. PMID: 36864882 Free PMC article.
-
In Vitro Infection of Human Macrophages with Porphyromonas gingivalis W83.Int J Mol Sci. 2025 Jan 26;26(3):1054. doi: 10.3390/ijms26031054. Int J Mol Sci. 2025. PMID: 39940820 Free PMC article.
-
Macroscopic Changes in Oral Mucosa and Hygiene Indicators in Smokers.Curr Health Sci J. 2021 Jul-Sep;47(3):383-392. doi: 10.12865/CHSJ.47.03.08. Epub 2021 Sep 30. Curr Health Sci J. 2021. PMID: 35003770 Free PMC article.
-
Features of the oral microbiome in Japanese elderly people with 20 or more teeth and a non-severe periodontal condition during periodontal maintenance treatment: A cross-sectional study.Front Cell Infect Microbiol. 2022 Oct 6;12:957890. doi: 10.3389/fcimb.2022.957890. eCollection 2022. Front Cell Infect Microbiol. 2022. PMID: 36275030 Free PMC article.
-
Oral Microbiome and Cognition Among Black Cancer Caregivers.Nurs Res. 2025 Jan-Feb 01;74(1):47-55. doi: 10.1097/NNR.0000000000000785. Epub 2024 Oct 1. Nurs Res. 2025. PMID: 39378356
References
-
- Aitchison J. (1982). The statistical analysis of compositional data. J. R. Stat. Soc. B 44 139–160.
-
- Apatzidou D., Lappin D. F., Hamilton G., Papadopoulos C. A., Konstantinidis A., Riggio M. P. (2017). Microbiome associated with peri-implantitis versus periodontal health in individuals with a history of periodontal disease. J. Oral Microbiol. 9:1325218. 10.1080/20002297.2017.1325218 - DOI
-
- Bauer B., Jordán F., Podani J. (2010). Node centrality indices in food webs: rank orders versus distributions. Ecol. Complexity 7 471–477. 10.1016/j.ecocom.2009.11.006 - DOI
Associated data
LinkOut - more resources
Full Text Sources
Research Materials
Miscellaneous