

Infection by Diverse HIV-1 Subtypes Leads to Different Elevations in HERV-K Transcriptional Levels in Human T Cell Lines
- PMID: 34079529
- PMCID: PMC8165174
- DOI: 10.3389/fmicb.2021.662573
Infection by Diverse HIV-1 Subtypes Leads to Different Elevations in HERV-K Transcriptional Levels in Human T Cell Lines
Abstract
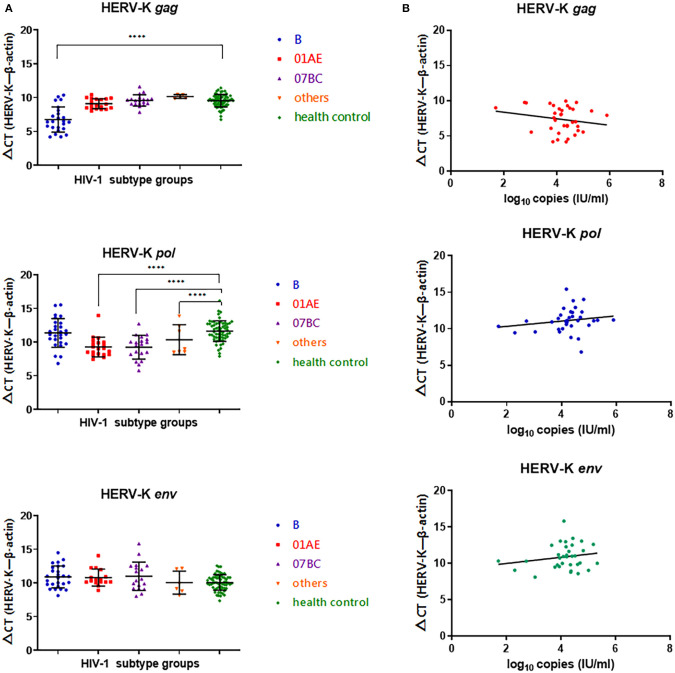
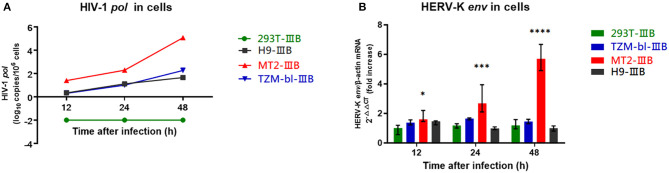
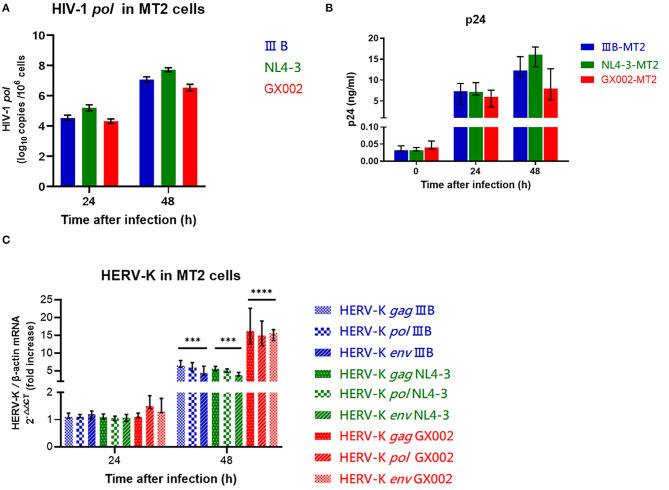
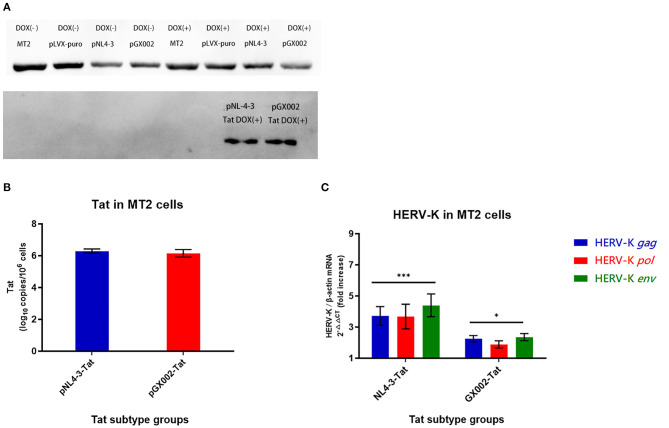
Human endogenous retroviruses (HERVs) make up ~8% of the human genome, and for millions of years, they have been subject to strict biological regulation. Many HERVs do not participate in normal physiological activities in the body. However, in some pathological conditions, they can be abnormally activated. For example, HIV infection can cause abnormal activation of HERVs, and under different infection conditions, HERV expression may be different. We observed significant differences in HERV-K transcription levels among HIV-1 subtype-infected individuals. The transcriptional levels in the HERV-K gag region were significantly increased in HIV-1 B subtype-infected patients, while the transcriptional levels in the HERV-K pol region were significantly increased in CRF01_AE and CRF07_BC subtype-infected patients. In vitro, the transcriptional levels of HEVR-K were increased 5-fold and 15-fold in MT2 cells transfected with two different HIV-1 strains (B and CRF01_AE, respectively). However, there was no significant difference in transcriptional levels among regions of HERV-K. When MT2 cells were infected with different subtypes of HIV-1 Tat proteins (B, CRF01_AE), which is constructed by lentiviruses, and the transcription levels of HERV-K were increased 4-fold and 2-fold, respectively. Thus, different subtypes of HIV-1 have different effects on HERV-K transcription levels, which may be caused by many factors, not only Tat protein.
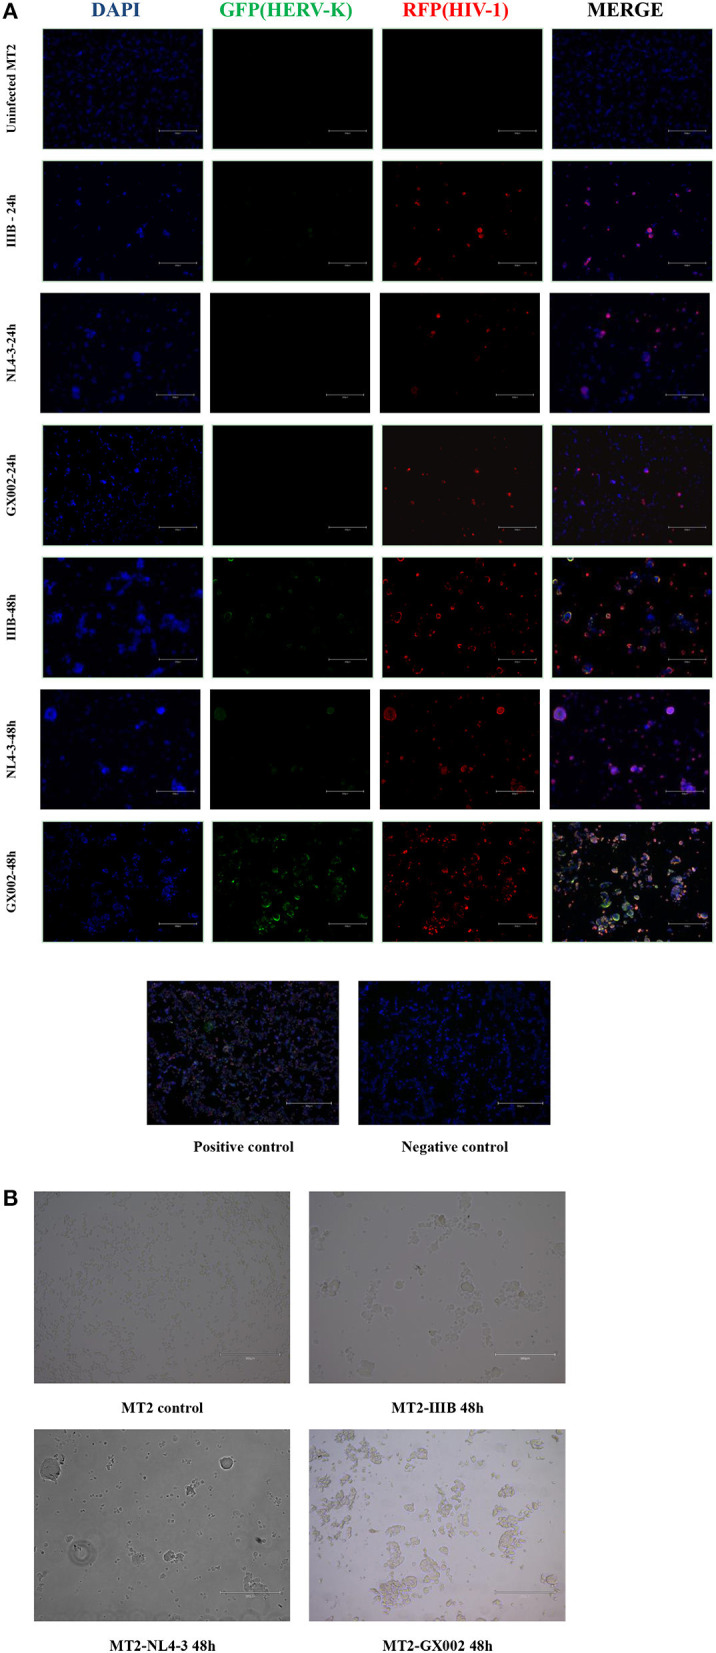
Keywords: CRF01_AE; HERV-K (HML-2); HIV-1; RNAscope; Tat.
Copyright © 2021 Li, Guo, Li, Huang, Pei, Wang, Liu, Jia, Li, Bao, Wang, Han, Han, Li and Li.
Conflict of interest statement
The authors declare that the research was conducted in the absence of any commercial or financial relationships that could be construed as a potential conflict of interest.
Figures
Similar articles
-
Expression of human endogenous retrovirus type K (HML-2) is activated by the Tat protein of HIV-1.J Virol. 2012 Aug;86(15):7790-805. doi: 10.1128/JVI.07215-11. Epub 2012 May 16. J Virol. 2012. PMID: 22593154 Free PMC article.
-
HIV-1 Infection of Primary CD4+ T Cells Regulates the Expression of Specific Human Endogenous Retrovirus HERV-K (HML-2) Elements.J Virol. 2017 Dec 14;92(1):e01507-17. doi: 10.1128/JVI.01507-17. Print 2018 Jan 1. J Virol. 2017. PMID: 29046457 Free PMC article.
-
Modulation of human endogenous retrovirus (HERV) transcription during persistent and de novo HIV-1 infection.Retrovirology. 2015 Mar 24;12:27. doi: 10.1186/s12977-015-0156-6. Retrovirology. 2015. PMID: 25886562 Free PMC article.
-
Human Endogenous Retroviruses Are Ancient Acquired Elements Still Shaping Innate Immune Responses.Front Immunol. 2018 Sep 10;9:2039. doi: 10.3389/fimmu.2018.02039. eCollection 2018. Front Immunol. 2018. PMID: 30250470 Free PMC article. Review.
-
Human endogenous retroviruses in neurologic disease.APMIS. 2016 Jan-Feb;124(1-2):116-26. doi: 10.1111/apm.12486. APMIS. 2016. PMID: 26818266 Review.
Cited by
-
A New HIV-1 K28E32-Reverse Transcriptase Variant Associated with the Rapid Expansion of CRF07_BC among Men Who Have Sex with Men.Microbiol Spectr. 2022 Oct 26;10(5):e0254522. doi: 10.1128/spectrum.02545-22. Epub 2022 Oct 10. Microbiol Spectr. 2022. PMID: 36214682 Free PMC article.
-
The relationship between HERVs and exogenous viral infections: A focus on the value of HERVs in disease prediction and treatment.Virulence. 2025 Dec;16(1):2523888. doi: 10.1080/21505594.2025.2523888. Epub 2025 Jul 1. Virulence. 2025. PMID: 40590391 Free PMC article. Review.
-
Limited nucleotide changes of HIV-1 subtype B Rev response element in China affect overall Rev-RRE activity and viral replication.Front Microbiol. 2022 Dec 12;13:1044676. doi: 10.3389/fmicb.2022.1044676. eCollection 2022. Front Microbiol. 2022. PMID: 36578566 Free PMC article.
-
PRMT3 reverses HIV-1 latency by increasing chromatin accessibility to form a TEAD4-P-TEFb-containing transcriptional hub.Nat Commun. 2025 May 15;16(1):4529. doi: 10.1038/s41467-025-59578-5. Nat Commun. 2025. PMID: 40374607 Free PMC article.
-
Characteristics of Subtype and Molecular Transmission Networks among Newly Diagnosed HIV-1 Infections in Patients Residing in Taiyuan City, Shanxi Province, China, from 2021 to 2023.Viruses. 2024 Jul 22;16(7):1174. doi: 10.3390/v16071174. Viruses. 2024. PMID: 39066336 Free PMC article.
References
-
- Abraha A., Nankya I. L., Gibson R., Demers K., Tebit D. M., Johnston E., et al. . (2009). CCR5- and CXCR4-tropic subtype C human immunodeficiency virus type 1 isolates have a lower level of pathogenic fitness than other dominant group M subtypes: implications for the epidemic. J. Virol. 83, 5592–5605. 10.1128/JVI.02051-08 - DOI - PMC - PubMed
-
- Armbruester V., Sauter M., Krautkraemer E., Meese E., Kleiman A., Best B., et al. . (2002). A novel gene from the human endogenous retrovirus K expressed in transformed cells. Clin. Cancer Res. 8, 1800–1807. - PubMed
LinkOut - more resources
Full Text Sources