Clinical Trial
. 2021 May 17:12:599805.
doi: 10.3389/fimmu.2021.599805. eCollection 2021.

Innate Lymphoid Cells Activation and Transcriptomic Changes in Response to Human Dengue Infection

Collaborators, Affiliations
Clinical Trial

Innate Lymphoid Cells Activation and Transcriptomic Changes in Response to Human Dengue Infection

Tiraput Poonpanichakul et al. Front Immunol. .

Abstract

Background: Dengue virus (DENV) infection has a global impact on public health. The clinical outcomes (of DENV) can vary from a flu-like illness called dengue fever (DF), to a more severe form, known as dengue hemorrhagic fever (DHF). The underlying innate immune mechanisms leading to protective or detrimental outcomes have not been fully elucidated. Helper innate lymphoid cells (hILCs), an innate lymphocyte recently discovered, functionally resemble T-helper cells and are important in inflammation and homeostasis. However, the role of hILCs in DENV infection had been unexplored.

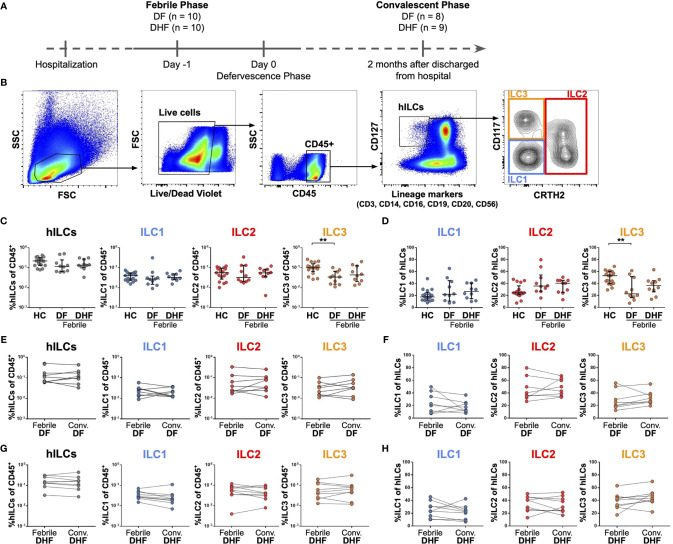
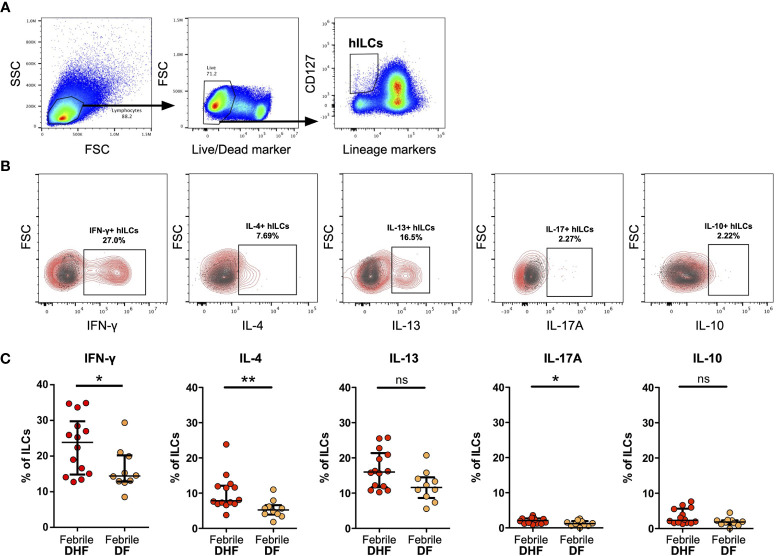
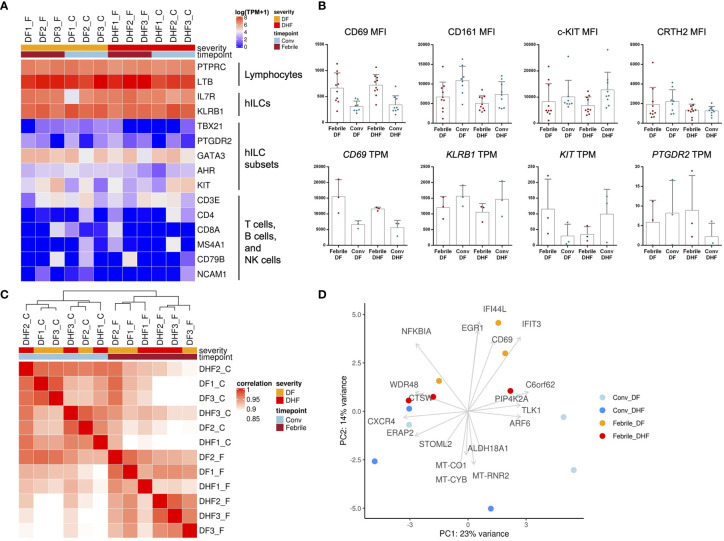
Methods: We performed flow cytometry to investigate the frequency and phenotype of hILCs in peripheral blood mononuclear cells from DENV-infected patients of different disease severities (DF and DHF), and at different phases (febrile and convalescence) of infection. Intracellular cytokine staining of hILCs from DF and DHF were also evaluated by flow cytometry after ex vivo stimulation. Further, the hILCs were sorted and subjected to transcriptome analysis using RNA sequencing. Differential gene expression analysis was performed to compare the febrile and convalescent phase samples in DF and DHF. Selected differentially expressed genes were then validated by quantitative PCR.

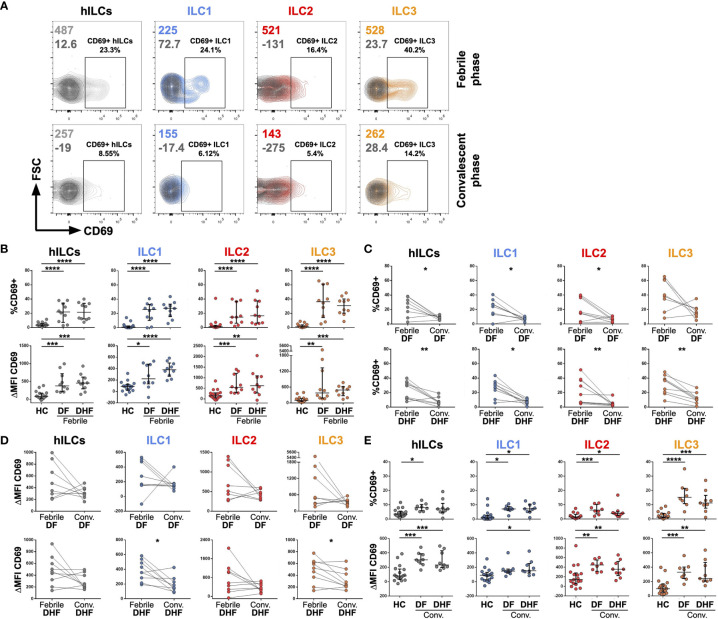
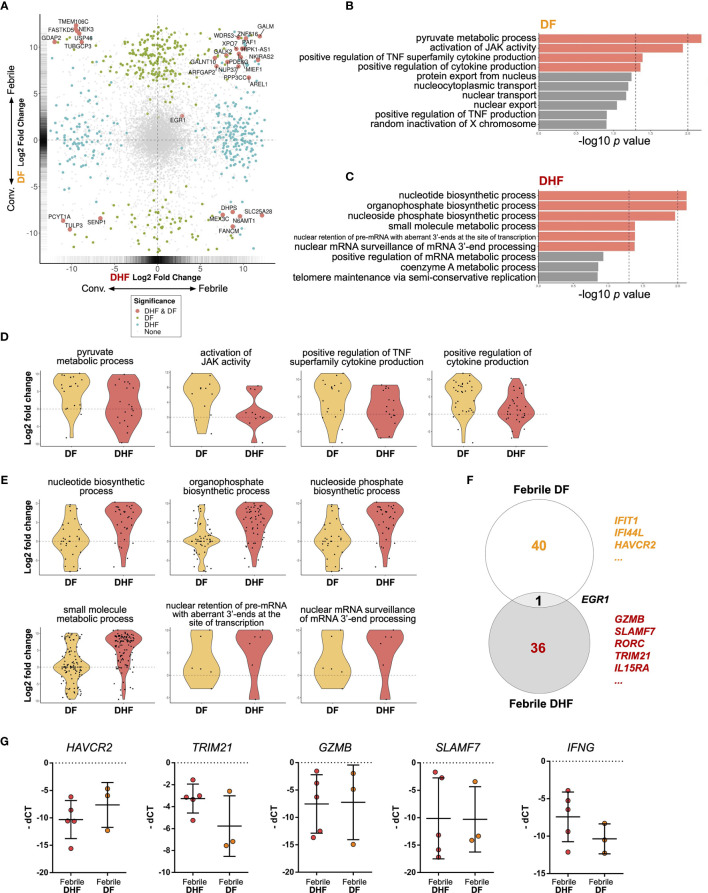
Results: Phenotypic analysis showed marked activation of all three hILC subsets during the febrile phase as shown by higher CD69 expression when compared to paired convalescent samples, although the frequency of hILCs remained unchanged. Upon ex vivo stimulation, hILCs from febrile phase DHF produced significantly higher IFN-γ and IL-4 when compared to those of DF. Transcriptomic analysis showed unique hILCs gene expression in DF and DHF, suggesting that divergent functions of hILCs may be associated with different disease severities. Differential gene expression analysis indicated that hILCs function both in cytokine secretion and cytotoxicity during the febrile phase of DENV infection.

Conclusions: Helper ILCs are activated in the febrile phase of DENV infection and display unique transcriptomic changes as well as cytokine production that correlate with severity. Targeting hILCs during early innate response to DENV might help shape subsequent immune responses and potentially lessen the disease severity in the future.

Keywords: Dengue; ILCs; RNA-seq; immune response to dengue; innate immunity; innate lymphoid cells; transcriptome; viral infection.


Conflict of interest statement

The authors declare that the research was conducted in the absence of any commercial or financial relationships that could be construed as a potential conflict of interest.

Figures

Figure 1
Figure 1
Frequencies of hILCs during the course of DENV infection. (A) Study design (B) Flow cytometry analysis gating strategy for hILCs and their subsets from PBMC. (C, D) Percentage of total hILCs and hILC subsets in febrile phase of dengue fever (DF), dengue hemorrhagic fever (DHF) patients and healthy donors (HC). ILC subsets frequencies were determined by percentage of CD45+ lymphocyte (C) or total hILCs (D). (E, F) Percentage of total hILCs and ILC subsets of matched samples at febrile and convalescent phases of DF patients. ILC subset frequencies were determined by percentage of CD45+ lymphocyte (E) or total hILCs (F). (G, H) Percentage of total hILCs and ILC subsets of matched samples at febrile and convalescent phases of DHF patients. ILC subsets frequencies were determined by percentage of CD45+ lymphocyte (G) or total hILCs (H). The results were presented as Median ± IQR. Data were analyzed using Mann-Whitney test (C, D) or Wilcoxon matched-pairs signed rank test (E–H) (**p < 0.01).
Figure 2
Figure 2
Activation of hILCs during the febrile phase of DENV infection. (A) Representative contour plot of CD69 expression (light grey, blue, red, and orange) as compared with isotype control (dark grey) on total hILC and each hILC subsets in febrile phase and convalescent phases. (B) Percentage of CD69+ (upper panel) and ΔMFI (CD69 MFI - isotype control MFI) (lower panel) for total hILCs and each hILC subset in febrile phase of dengue fever (DF) patients and dengue hemorrhagic fever (DHF) patients compared to healthy donors (HC). (C) Percentage of CD69+ and (D) ΔMFI for total and hILC subsets of febrile phase compared to matched convalescent of DF (upper panel) and DHF (lower panel). Each line connected data of the same patient between two timepoints. Wilcoxon matched-pairs signed rank test was used for statistical comparison, p < 0.05 was considered as a statistically significant difference. (E) Percentage of CD69+ (upper panel) and ΔMFI (lower panel) for total and hILC subsets in convalescent phase of DF and DHF patients compared to healthy donors (HC). The results were presented as Median ± IQR. Data were analyzed using Mann-Whitney test (B, E) or Wilcoxon matched-pairs signed rank test (C, D) (*p < 0.05, **p < 0.01, ***p < 0.001, ****p < 0.0001).
Figure 3
Figure 3
Intracellular cytokine staining of hILCs from febrile DF and DHF after PMA/ionomycin ex vivo stimulation (A) Flow cytometry analysis gating strategy of total hILCs from PBMC. (B) Representative contour plots of IFN-γ, IL-4, IL-13, IL-17A, and IL-10 expression (red) overlaid on FMO control (grey). (C) Percentage of IFN-γ, IL-4, IL-13, IL-17A, and IL-10 expression of hILCs in febrile phase of DF and DHF patients. The results were presented as median ± IQR. Data were analyzed using Mann-Whitney test (*p < 0.05, **p < 0.01; ns, not significant).
Figure 4
Figure 4
Transcriptome analysis of hILCs from DENV-infected patients. (A) Heatmap showing expression level (in TPM) of known hILCs and their subsets’ signature genes as compared to those of T cells, B cells and NK cells in each sample arranged according to disease severity (DF, DHF) and timepoints (febrile, convalescence). (B) Bar plots show mean MFI from previous flow cytometry experiment (upper panel) and gene expression levels in TPM (lower panel) for CD69, CD161 (KLRB1), c-kit (CD117, KIT), and CRTH2 (CD294, PTGDR2). (C) Correlation of global transcriptome profiles of hILCs in all samples. Unbiased hierarchical clustering shows high correlation amongst samples according to timepoints (febrile phase clustered together and away from convalescence). (D) PCA plot with top contribution genes for PC1 and PC2 shows separation between febrile and convalescent phase on PC2 which were contributed by the expression of CD69, EGR1, IFIT3, NFKBIA, and IFI44L. Sample number indicated on top of heatmap; DF1_F (DF sample number 1, febrile phase), DF1_C (DF, sample number 1, convalescent phase).
Figure 5
Figure 5
Differential gene expression analysis of hILCs between febrile and convalescent phase of DENV infection (A) Plot comparing the fold change of DF (febrile over convalescent phase) (Y axis) to the fold change of DHF (febrile over convalescent phase) (X axis) depicts transcripts differentially expressed between disease severity and timepoint. Colored dots denote transcripts that are differentially expressed at least 2-fold higher as well as adjust p value less than 0.01. Blue or green colored dots denote differentially expressed in DF or DHF respectively. Red colored dots denote transcripts that are differentially expressed by both DF and DHF. (B, C) Bar plots show significant GO term enrichment from DE genes comparing febrile and convalescent phases in (B) DF and (C) DHF patients. (D, E) Violin plots show fold change of expression levels of matched samples between febrile and convalescent phases. Each dot represents a gene in the designated GO term by each patient. (D) show enriched GO term in DF patients and (E) shows GO term enriched in DHF patients. (F) Venn diagram shows number of differentially expressed genes in DF (febrile over convalescent phase), DHF (febrile over convalescent phase) and both after shrinkage algorithm ‘apeglm’ was applied. Immune-related genes are listed beside the diagram. (G) Expression levels of HAVCR2, TRIM21, GZMB, SLAMF7, and IFNG by quantitative PCR (delta Ct value (dCt) = Ct value of ACTB - Ct value of interested gene). Bar showing median ± IQR.

Similar articles

Cited by

References

    1. Bhatt S, Gething PW, Brady OJ, Messina JP, Farlow AW, Moyes CL, et al. . The Global Distribution and Burden of Dengue. Nature (2013) 496:504–7. 10.1038/nature12060 - DOI - PMC - PubMed
    1. World Health Organization . Dengue Haemorrhagic Fever: Diagnosis, Treatment, Prevention and Control. Geneva: World Health Organization; (1997).
    1. World Health Organization . GACVS Statement on Dengvaxia ® (Cyd-Tdv) (2017). Available at: https://www.who.int/vaccine_safety/committee/GACVS-StatementonDengvaxia-... (Accessed May 15, 2020).
    1. Halstead SB. Safety Issues From a Phase 3 Clinical Trial of a Live-Attenuated Chimeric Yellow Fever Tetravalent Dengue Vaccine. Hum Vaccines Immunother (2018) 14:2158–62. 10.1080/21645515.2018.1445448 - DOI - PMC - PubMed
    1. Sridhar S, Luedtke A, Langevin E, Zhu M, Bonaparte M, Machabert T, et al. . Effect of Dengue Serostatus on Dengue Vaccine Safety and Efficacy. N Engl J Med (2018) 379:327–40. 10.1056/NEJMoa1800820 - DOI - PubMed

Publication types