. 2021 May 17:12:670427.
doi: 10.3389/fimmu.2021.670427. eCollection 2021.

Pig Liver Esterases Hydrolyze Endocannabinoids and Promote Inflammatory Response

Affiliations

Pig Liver Esterases Hydrolyze Endocannabinoids and Promote Inflammatory Response

Qiongqiong Zhou et al. Front Immunol. .

Abstract

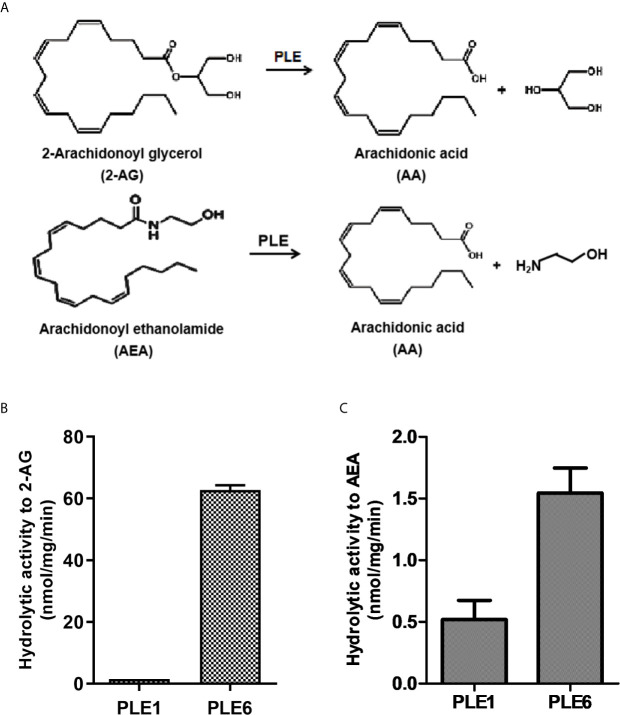
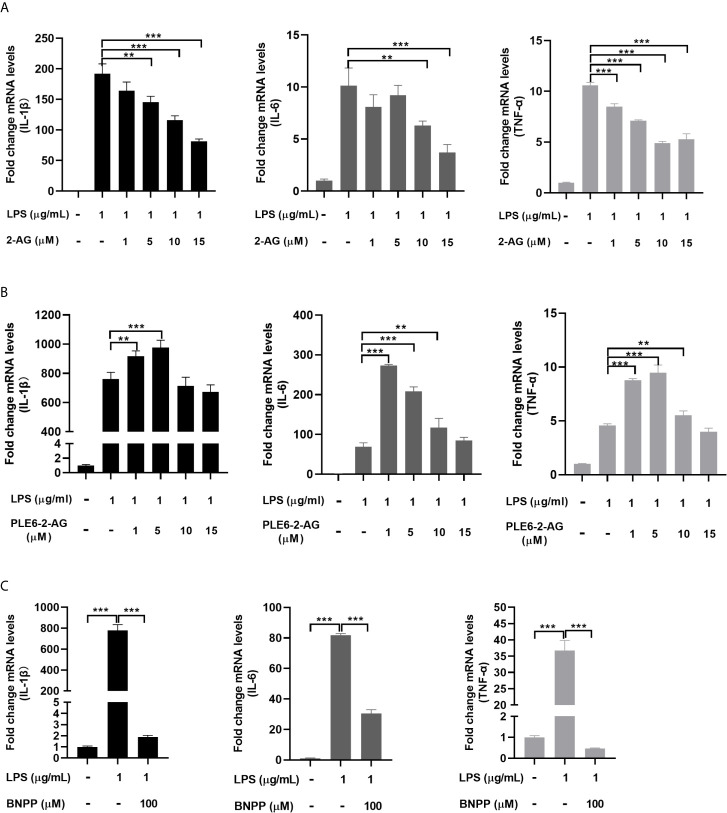
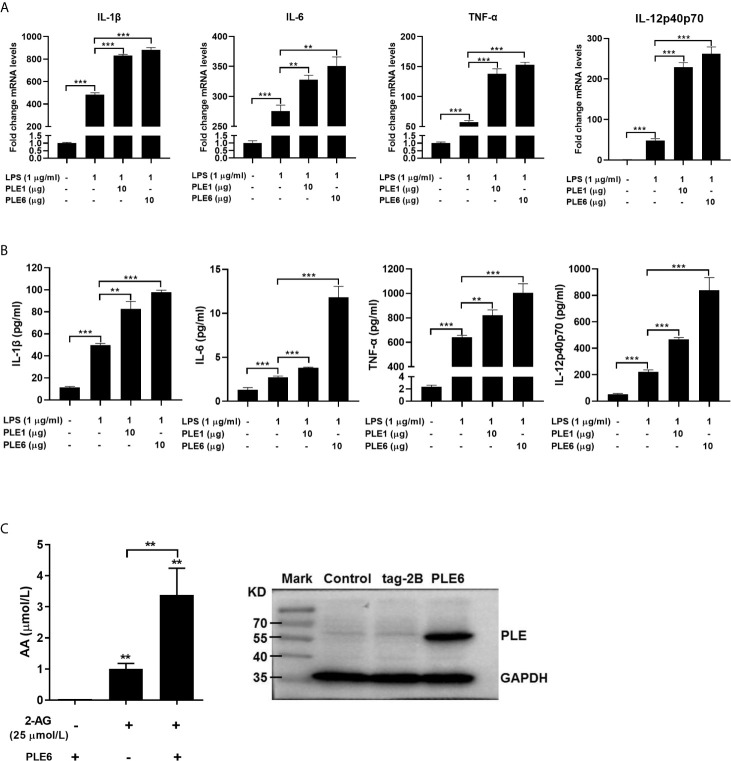
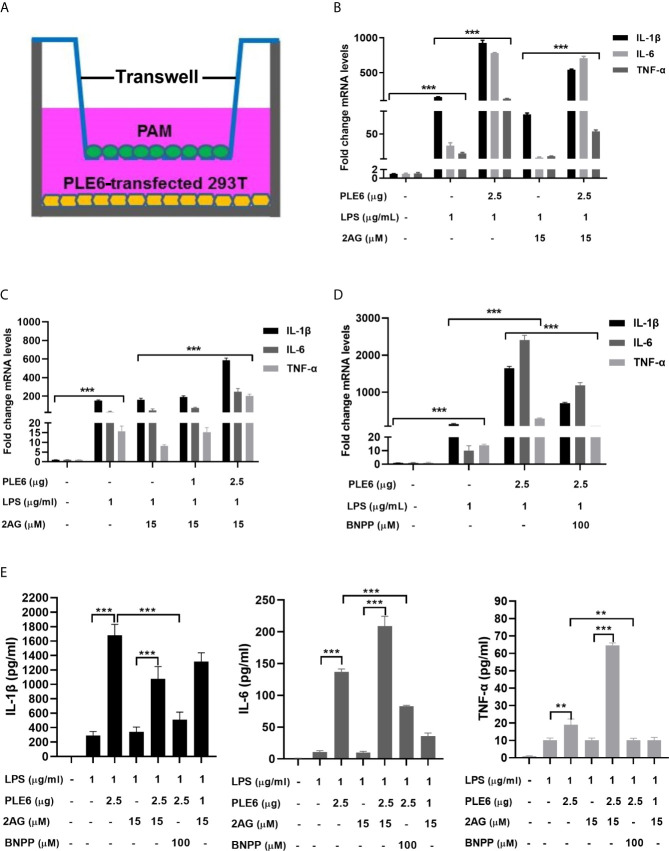
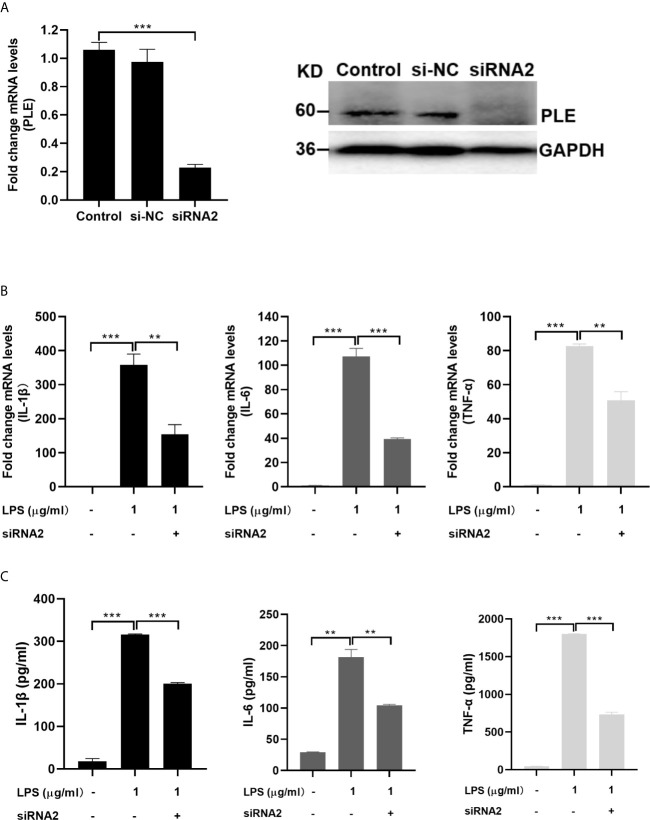
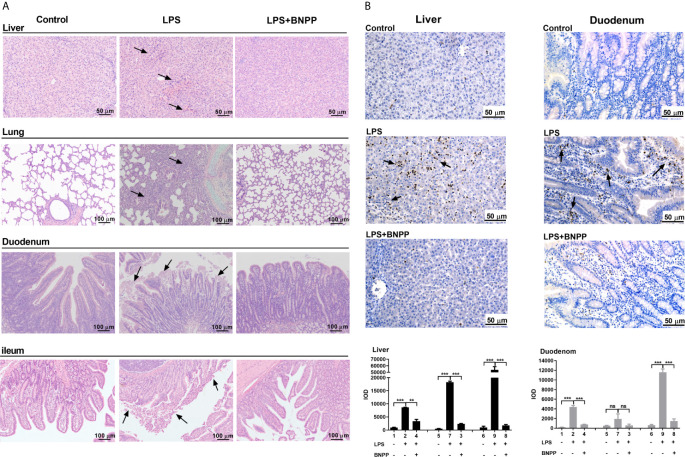
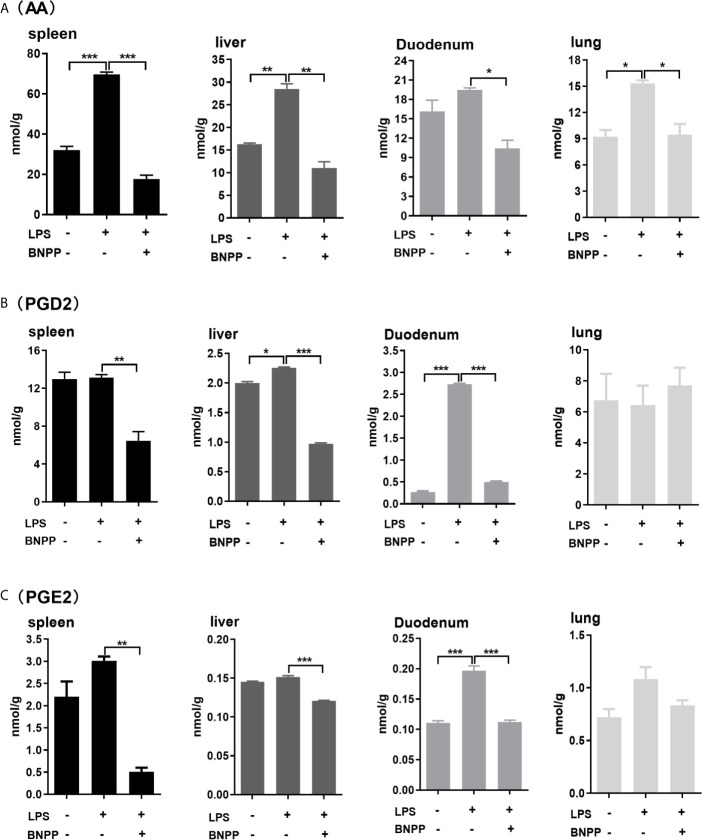
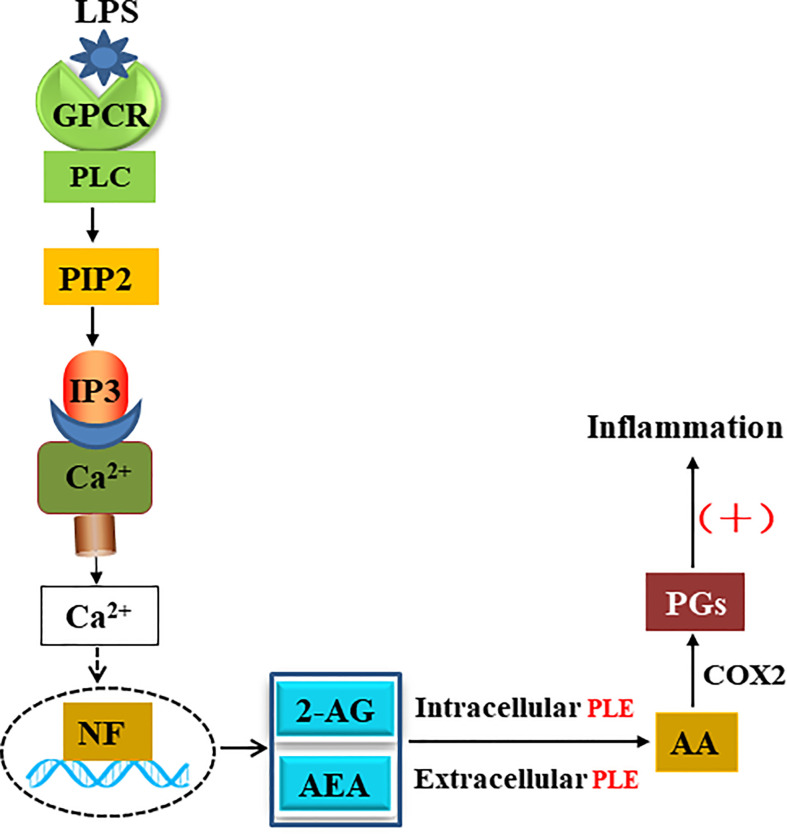
Endocannabinoids are endogenous ligands of cannabinoid receptors and activation of these receptors has strong physiological and pathological significance. Structurally, endocannabinoids are esters (e.g., 2-arachidonoylglycerol, 2-AG) or amides (e.g., N-arachidonoylethanolamine, AEA). Hydrolysis of these compounds yields arachidonic acid (AA), a major precursor of proinflammatory mediators such as prostaglandin E2. Carboxylesterases are known to hydrolyze esters and amides with high efficiency. CES1, a human carboxylesterase, has been shown to hydrolyze 2-AG, and shares a high sequence identity with pig carboxylesterases: PLE1 and PLE6 (pig liver esterase). The present study was designed to test the hypothesis that PLE1 and PLE6 hydrolyze endocannabinoids and promote inflammatory response. Consistent with the hypothesis, purified PLE1 and PLE6 efficaciously hydrolyzed 2-AG and AEA. PLE6 was 40-fold and 3-fold as active as PLE1 towards 2-AG and AEA, respectively. In addition, both PLE1 and PLE6 were highly sensitive to bis(4-nitrophenyl) phosphate (BNPP), an aryl phosphodiester known to predominately inhibit carboxylesterases. Based on the study with BNPP, PLEs contributed to the hydrolysis of 2-AG by 53.4 to 88.4% among various organs and cells. Critically, exogenous addition or transfection of PLE6 increased the expression and secretion of proinflammatory cytokines in response to the immunostimulant lipopolysaccharide (LPS). This increase was recapitulated in cocultured alveolar macrophages and PLE6 transfected cells in transwells. Finally, BNPP reduced inflammation trigged by LPS accompanied by reduced formation of AA and proinflammatory mediators. These findings define an innovative connection: PLE-endocannabinoid-inflammation. This mechanistic connection signifies critical roles of carboxylesterases in pathophysiological processes related to the metabolism of endocannabinoids.

Keywords: Carboxylesterases; arachidonic acid; endocannabinoid; inflammation; pig liver esterase; prostaglandins.


Conflict of interest statement

The authors declare that the research was conducted in the absence of any commercial or financial relationships that could be construed as a potential conflict of interest.

Figures

Figure 1
Figure 1
Hydrolysis of 2-AG and AEA by purified PLE1 and PLE6. (A) Reaction diagram for 2-AG and AEA hydrolysis. (B) Hydrolysis of 2-AG. (C) Hydrolysis of AEA. Substrates (2-AG or AEA) at 200 µM was prepared in Tris-HCl buffer (50 mM, pH 7.4) and then mixed with purified PLE1 or PLE6 (10 µg). After incubation for 10 min at 37°C, the reactions were terminated, and the formation of AA was monitored with LC-MS/MS. The data in Figures 1B and C are presented as the mean ± standard error of the mean (SEM) of 3 independent experiments.
Figure 2
Figure 2
Effect of 2-AG, PLE6-hydrolyzed 2-AG and BNPP on the LPS-stimulated mRNA expression of proinflammatory cytokines in PAMs. (A) Effect of 2-AG on the LPS-stimulated mRNA expression of proinflammatory cytokines. PAMs were cultured and incubated with LPS (1 µg/mL) and 2-AG at various concentration (1 µM, 5 µM, 10 µM, 15 µM) for 24 h. Total RNA was isolated and analyzed for the mRNA level of IL-1β, IL-6 and TNF-α by RT-qPCR. (B) Effect of PLE6 hydrolyzed 2-AG on the LPS-stimulated mRNA expression of proinflammatory cytokines. PAMs were cultured and incubated with LPS (1 µg/mL) and a 0.5-h preincubation mixture of PLE6 with 2-AG at various concentration (1 µM, 5 µM, 10 µM, 15 µM) for 24 h. Total RNA was isolated and analyzed for the mRNA level of IL-1β, IL-6 and TNF-α by RT-qPCR. (C) Effect of BNPP on the LPS-stimulated mRNA expression of proinflammatory cytokines. PAMs were cultured and preincubated with BNPP (100 µM) for 3 h, and then LPS (1 µg/mL) was treated for another 24 h. The levels of inflammatory factors in the cell lysates were detected. Statistical significance was indicated by asterisks (**P < 0.01; ***P < 0.001).
Figure 3
Figure 3
Enhanced LPS-stimulation on the expression of proinflammatory cytokines in PAMs by addition of PLE1/6 or increased AA secretion in transfected PLE6. (A) Enhanced LPS-stimulation on the mRNA expression of proinflammatory cytokines in PAMs by addition of purified PLE1 or PLE6. PAMs were cultured for 24 h, and then treated with LPS (1 µg/ml) and PLE1 or PLE6 (10 µg). After incubation for additional 6 h, total RNA was isolated and analyzed for the mRNA level of proinflammatory cytokines by RT-qPCR. (B) Enhanced LPS-stimulation on the protein expression of proinflammatory cytokines in PAMs. Cells were treated as Experiment A (above). However, culture supernatant was collected and analyzed by protein chip. (C) Increased AA secretion by PLE6 transfected cells. 293T cells were transfected with pCMV-tag-2B-PLE6 or the corresponding vector. The transfected cells were treated with 2-AG (25 µM). After treatment for 1 h, the supernatant was extracted and analyzed for the level of AA by LC-MS/MS (Left). The expression of transfected PLE6 was confirmed by Western blotting (Right). Data are presented as the mean ± SEM of 3 independent experiments. Statistical significance was indicated by asterisks (** P < 0.01; *** P < 0.001).
Figure 4
Figure 4
Enhanced LPS-stimulation on the expression of proinflammatory cytokines in coculture model of PAMs and 293T cells. (A) Diagrammatic presentation of the coculture model. (B) Enhanced LPS-stimulation on the expression of proinflammatory cytokines in coculture model. PAM and PLE6-transfected 293T cells (non-transfected cells as controls) were cocultured for 24 h along with LPS (1 µg/mL), 2-AG (15 µM) or both. total RNA was isolated and analyzed for the mRNA level of proinflammatory cytokines by RT-qPCR. (C) Enhanced LPS-stimulation on the expression of proinflammatory cytokines in coculture model as a function of the amount of PLE6. Coculture was performed as described for Experiment B (above). However, the transfection of PLE6 plasmid was performed at 1 and 2.5 µg. (D) Reduced PLE6 increases on the expression of proinflammatory cytokines by BNPP. Coculture was performed similarly as described. However, cells were cocultured in the presence of BNPP at 100 µM. Likewise, the mRNA expression of proinflammatory cytokines was determined. (E) Effect of PLE6, 2-AG, BNPP or in combination on protein expression of proinflammatory cytokines in the coculture model. Cells were cultured and treated similarly. The levels of proinflammatory cytokines was determined with a protein chip. The data in Figure 4 are presented as the mean ± SEM of 3 independent experiments. Statistical significance was indicated by asterisks (** P < 0.01; *** P < 0.001).
Figure 5
Figure 5
Decreased LPS-stimulation on the expression of proinflammatory cytokines in PAMs by transfection of siRNA2 targeting PLEs. (A) The expression of PLEs was confirmed by RT-qPCR (left) and western blotting (Right). si-NC: si negative control. (B) Decreased LPS-stimulation on the mRNA expression of proinflammatory cytokines in PAMs by transfection of siRNA2 targeting PLEs. PAMs were cultured for 24 h, and then transfected with siRNA. After incubation for 24 h, LPS (1 µg/mL) was treated for additional 6 h Then, total RNA was isolated and analyzed for the mRNA level of proinflammatory cytokines by RT-qPCR. (C) Decreased LPS-stimulation on the protein expression of proinflammatory cytokines in PAMs by transfection of siRNA2 targeting PLEs. Cells were treated as Experiment B (above). However, culture supernatant was collected and analyzed by ELISA. Data are presented as the mean ± SEM of 3 independent experiments. Statistical significance was indicated by asterisks (** P < 0.01; *** P < 0.001).
Figure 6
Figure 6
PLE inactivation attenuates tissue injury and the inflammatory response in vivo. (A) Pathological examination (H&E staining) of pig tissues. Pigs (n=3) were treated with sterile saline or LPS (25 µg/kg) or the combination of LPS and BNPP (25 mg/kg, i.p., given prior to 1 h of LPS induction). Then, tissue injuries were detected after 24 h. (B) Neutrophil infiltration was assessed by MPO staining (brown staining), and quantitative analysis was performed by CaseViewer software. Representative images are shown, and the black arrow shows the damage in the tissues. Integral optical density (IOD) is the value of the light absorbed or transmitted by the result of dye staining in different tissue cells under the same illumination condition. The numbers in the figures represent the corresponding pigs. Statistical significance was indicated by asterisks (**P < 0.01; ***P < 0.001).
Figure 7
Figure 7
Levels of AA (A), PGD2 (B) and PGE2 (C) in tissues from pigs treated with BNPP and LPS. Pigs (n = 3) were treated with BNPP (25 mg/kg, i.p.) initially and 1 h later with LPS (25 µg/kg, i.p.) in pigs. Animals were euthanized 24 h after LPS administration. Tissues were harvested, extracted and analyzed for the level of AA, PGD2 and PGE2 with LC-MS/MS. The data in Figure 7 are presented as the mean ± SEM of 3 independent experiments. Statistical significnce was considered at values of P < 0.05 and indicated by an asterisk (*P < 0.05; **P < 0.01; ***P < 0.001).
Figure 8
Figure 8
Function of PLEs in eCBs metabolism and inflammatory response.

Similar articles

Cited by

References

    1. Holmes R, Wright M, Laulederkind S, Cox L, Hosokawa M, Imai T, et al. . Recommended Nomenclature for Five Mammalian Carboxylesterase Gene Families: Human, Mouse and Rat Genes and Proteins. Mamm Genome (2010) 21:427–41. 10.1007/s00335-010-9284-4 - DOI - PMC - PubMed
    1. Yan B. Hydrolytic Enzymes in Metabolism of Drugs and Other Xenobiotics. In: P Anzenbacher, UM Zanger, editors. Weinheim: WILEY-VCH Verlag GmbH & Co. KGaA; (2013). p. 165–98.
    1. Aguilera CM, Gomez-Llorente C, Tofe I, Gil-Campos M, Cañete R, Gil Á. Genome-Wide Expression in Visceral Adipose Tissue From Obese Prepubertal Children. Int J Mol Sci (2015) 16:7723–37. 10.3390/ijms16047723 - DOI - PMC - PubMed
    1. Qiao Q, Bouwman FG, van Baak MA, Roumans NJT, Vink RG, Coort SLM, et al. . Adipocyte Abundances of CES1, Cryab, ENO1 and GANAB are Modified in-Vitro by Glucose Restriction and are Associated With Cellular Remodelling During Weight Regain. Adipocyte (2019) 8:190–200. 10.1080/21623945.2019.1608757 - DOI - PMC - PubMed
    1. Qian Y, Markowitz JS. Natural Products as Modulators of CES1 Activity. Drug Metab Dispos (2020) 48:993–1007. 10.1124/dmd.120.000065 - DOI - PubMed

Publication types