

doi: 10.1093/ckj/sfab060.
eCollection 2021 Jun.
Electrolyte abnormalities in patients hospitalized with COVID-19
Affiliations
- PMID: 34079619
- PMCID: PMC7989524
- DOI: 10.1093/ckj/sfab060
Item in Clipboard
Electrolyte abnormalities in patients hospitalized with COVID-19
Clin Kidney J.
.
No abstract available
Figures
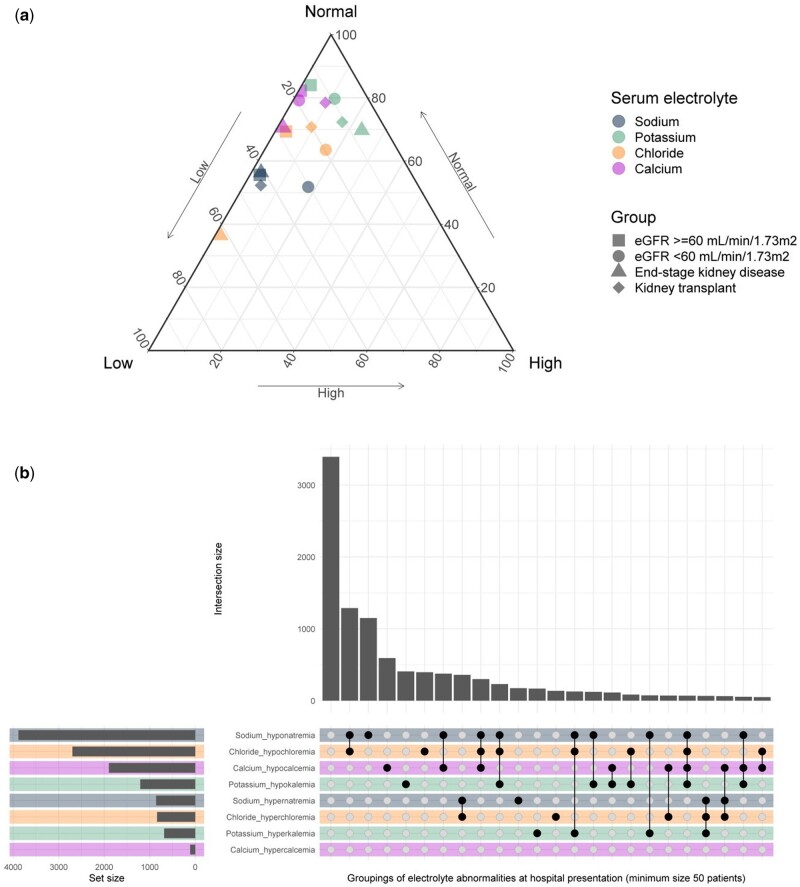
Electrolyte disorders at admission for patients hospitalized with COVID-19, with breakdown of (A) electrolytes by category (normal, high, low) for subgroups and (B) co-occurrence of electrolyte disorders. Panel A shows a ternary plot with balance of normal, high and low levels for each of four serum electrolytes (sodium, potassium, chloride and calcium), stratified by kidney group (normal eGFR, eGFR <60 mL/min/1.73 m2, ESKD and kidney transplant). The three axes show the percent breakdown for each individual electrolyte group dyad and the clustering of points in the upper left of the triangle indicates that most electrolytes were normal, while low levels were seen next most commonly. Elevated electrolyte levels were least common, although 18% of patients with an eGFR <60 mL/min/1.73 m2 had high sodium/hypernatremia (blue–gray circle) and 23% of those with ESKD had high potassium/hyperkalemia (green triangle). Panel B shows electrolyte abnormalities and their co-occurrence. Horizontal bars (‘set size’) show the prevalence of specific individual electrolyte abnormalities, while vertical bars (‘intersection size’) show the co-occurrence. Overall, hyponatremia was the most common electrolyte disorder, followed by hypochloremia, hypocalcemia and hypokalemia. Hypercalcemia was the least common electrolyte abnormality overall. Of the cohort, only 3393 (32.7%) had completely normal electrolytes on admission (first vertical bar, with no electrolyte abnormalities selected in the grid). The most common presentation of abnormality was hyponatremia and hypochloremia together (second vertical bar and selected in the grid) in 1289 (12.4%), followed by hyponatremia alone (third vertical bar and selected in the grid) in 1150 (11.1%). Colors in both panels encode specific electrolytes. These figures include only patients without missing values (n = 10 366) and exclude serum magnesium and phosphorus, as these electrolytes had a significant amount of missingness.
References
LinkOut - more resources
Full Text Sources
