Review
. 2021 Apr 15;11(2):107-142.
eCollection 2021.

Diffusion-weighted MRI of the liver: challenges and some solutions for the quantification of apparent diffusion coefficient and intravoxel incoherent motion

Affiliations
Review

Diffusion-weighted MRI of the liver: challenges and some solutions for the quantification of apparent diffusion coefficient and intravoxel incoherent motion

Yi Xiang J Wang et al. Am J Nucl Med Mol Imaging. .

Abstract

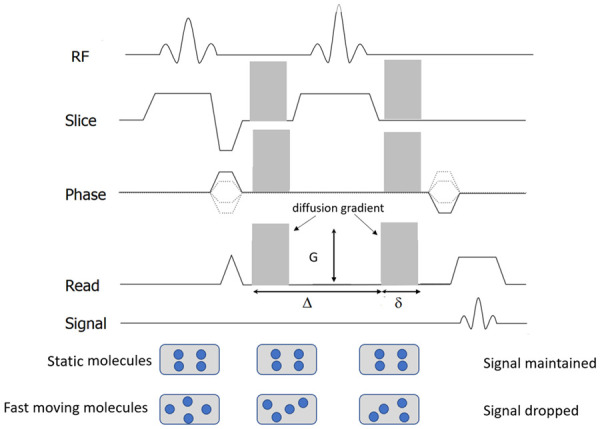
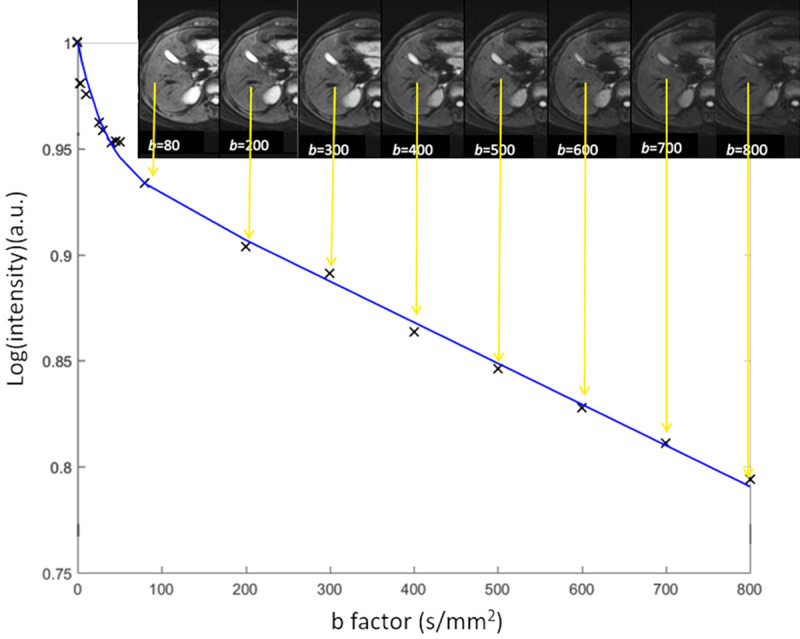
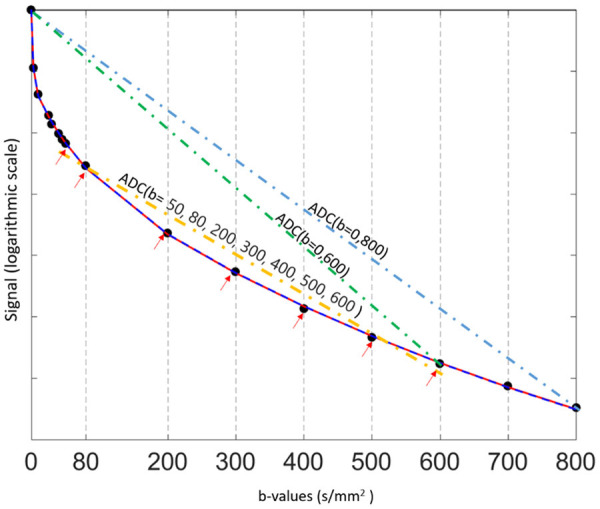
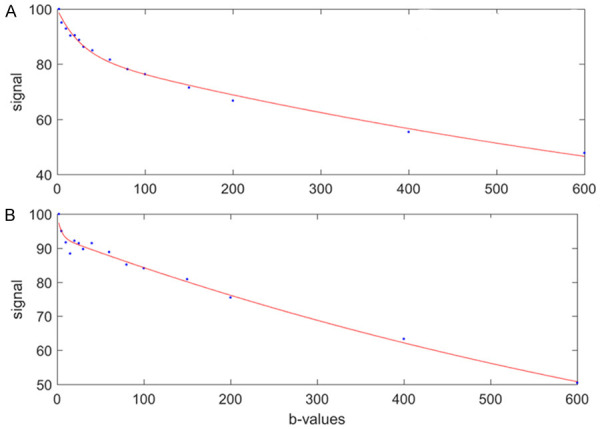
Diffusion-weighted imaging (DWI) is sensitive to the mobility of water molecule at cellular and macromolecular level, much smaller than the spatial resolution of the images. It is commonly based on single shot echo-planar imaging sequence with the addition of motion-probing gradient pulses and fat suppression. DWI is increasingly incorporated into routine body magnetic resonance imaging protocols. However, the liver is particularly affected by physiological motions such as respiration; the left liver is also affected by cardiac motion artifacts and susceptibility artefact due to contents in the stomach. Intravoxel incoherent motion (IVIM) DWI data analysis requires high-quality data acquisition using multiple b-values and confidence in the measurements at low b-values. This article reviews the technical developments of DWI and its applications in the liver. Challenges and some solutions for the quantification of apparent diffusion coefficient and intravoxel incoherent motion are discussed. Currently, acquisition protocols vary between research groups; patient preparation and data post-processing are not standardized. Increased standardization, both in data acquisition and in image analysis, is imperative so to allow generation of reliable DW-MRI biomarker measures that are broadly applicable.

Keywords: Liver; MRI; diffusion weighted imaging; intravoxel incoherent motion (IVIM); magnetic resonance imaging.


Conflict of interest statement

None.

Figures

Figure 1
Figure 1
Diagram of diffusion-weighted sequence. It is based on T2-weighted spin-echo sequencing with application of two equal gradient pulses (a dephasing gradient and a rephasing gradient) on each side of the 180° radiofrequency pulse. Static molecules are dephased by the first diffusion gradient and rephased by the second diffusion gradient; therefore measured high signal intensity is maintained. In contrast, moving molecules undergo dephasing by the first diffusion gradient but are not entirely rephased by the second gradient because of their motion, thereby resulting in signal loss. Diffusion sensitizing is commonly applied in three orthogonal directions at the same time for DW-MRI.
Figure 2
Figure 2
A simplified scheme shows diffusion-weighted imaging ADC calculation with various b-values. For each image voxel (or region-of-interest) acquired at same anatomic position at increasing b value, logarithm of relative signal intensity is plotted against b-values. Slope of line (monoexponential fit) is ADC of that image voxel (or region-of-interest). Note that gallbladder cyst also shows high signal on most of b-value images due to relatively long T2 relaxation time. This is the phenomenon known as “T2-shine through”.
Figure 3
Figure 3
Relationship between diffusion-weighted signal and b-values ( 0, 3, 10, 25, 30, 40, 45, 50, 80, 200, 300, 400, 500, 600, 700, and 800 s/mm2) in a normal liver. In a semi-logarithmic projection, a mono-exponential curve gives a straight line, whose slope is ADC. The first part (0 < b < 50 s/mm2) of the fitting curve represents both diffusion and perfusion, whereas the second part (> 50 s/mm2) reflects mostly diffusion. The ADC (i.e. the slope) varies considerably (and is overestimated) when b = 0 s/mm2 is used to calculate it. In this example, ADC (b = 0, 600) > ADC (b = 0, 800) > ADC (b = 50, 80, 200, 300, 400, 500, 600).
Figure 4
Figure 4
MRI of a 31-year-old male patient with a pathologically verified hepatocellular carcinoma of Edmondson-Steiner grade III. The patient suffered intrahepatic recurrence at 8 months after tumor resection. A 6.3 cm tumor in right lobe of the liver shows heterogeneous hyperintensity on T2-weighted image (A), hypointensity on 20-min hepatobiliary phase (B) and restricted diffusion on the diffusion-weighted image with a b-value of 700 s/mm2 (C). ADC (D) shows lower signal intensity compared with that of liver parenchyma. [Reproduced with permission from reference [51]].
Figure 5
Figure 5
A colon cancer patient with a small metastasis nodule in liver (arrow). (A) Fat suppressed T2 weighed image; (B) Diffusion weighted image (b = 1000 s/mm2); (C) ADC map. This small metastasis nodule is best shown on diffusion weighted image with high signal (B). ADC shows this nodule has restricted diffusion.
Figure 6
Figure 6
Plots show logarithm of relative signal intensity vs. b-values from normal liver parenchyma. There is an initially steeper decrease in plotted signal values at low b-values which represents substantial perfusion component, and a more gradual attenuation of signal at higher b-values which mainly represent diffusion component. Using simple monoexponential apparent diffusion coefficient (ADC) line fitted to data (dotted green line) provides suboptimal characterization of signal attenuation behaviour. IVIM: Intravoxel incoherent motion.
Figure 7
Figure 7
IVIM signal bi-exponential decay curve is better fitted with threshold b-value of 60 s/mm2 than with threshold b-value of 200 s/mm2. (A) Six consecutive healthy participants’ liver IVIM bi-exponential segmented fitting curves with threshold b value of 60 s/mm2, all demonstrating very good fitting. (B) The same six study participants’ IVIM bi-exponential segmented fitting curves with threshold b-value of 200 s/mm2. Compared with (A), it can be visually noted that the fittings in (B) are less optimal. Data include 15 b-values of 2, 4, 7, 10, 15, 20, 30, 46, 60, 72, 100, 150, 200, 400, 600 s/mm2, and fitting starts from b = 2 s/mm2 image. M: male; F: females. [Reproduced with permission from reference [69]].
Figure 8
Figure 8
IVIM results of full fitting, segmented fittings with threshold b = 60 s/mm2 (b 60) and 200 s/mm2 (b 200). Results of full fitting have excellent agreement, subject-by-subject, with those of segmented fitting using threshold b of 60 s/mm2. Upper row for healthy men males (n = 26) and lower row for healthy women (n = 36). Each line represents one subjects. [Reproduced with permission from reference [69]].
Figure 9
Figure 9
An example of region of interest (ROI) drawn over right liver parenchyma (b = 2 s/mm2 image) for IVIM bio-exponential processing. This ROI excludes apparent vasculature as well as keeps certain distance from the liver borders so to minimize the potential impact of respiratory motion.
Figure 10
Figure 10
Bi-exponential segmented fitting curve of parenchyma in a healthy liver. The b-value distribution is 0, 2, 4, 7, 10, 15, 20, 30, 46, 60, 72, 100, 150, 200, 400, 600 s/mm2, and fitting starts from b = 0 image. When a higher threshold b-value (such as b = 200 s/mm2) is used, the Dslow value (slope of blue Dslow2 line) will be smaller than when a lower threshold b-value (such as b = 60 s/mm2) is selected (slope of green Dslow1 line). On the other hand, the computed PF is larger when a higher threshold b-value is used (height of pf2) than when a lower threshold b-value is used (height of pf1).
Figure 11
Figure 11
1.5T liver IVIM diffusion images with b-value = 0, 1, 2, 15 s/mm2. The signal difference between b = 0 s/mm2 image and b = 1 or 2 s/mm2 images is dramatic, particularly the vessels show high signal without diffusion gradient while showing dark signal when the diffusion gradient is on even at b = 1 s/mm2. [Reproduced with permission from reference [72]].
Figure 12
Figure 12
Bi-exponential full fitting curves of three portions of liver parenchyma from three healthy livers. On b = 0 images, small ROIs are drawn on liver parenchyma excluding bright pixels which would contain ‘visible’ vessel. The b-value distribution is 0, 2, 4, 7, 10, 15, 20, 30, 46, 60, 72, 100, 150, 200, 400, 600 s/mm2, and fitting starts from b = 0 image. Note despite the ROIs do not contain visible vessel, a steep drop of signal from b = 0 to b = 2 can still be seen, this would be caused by sub-pixel micro-vessels which show high signal on b = 0 image while low signal on b = 2 image. [Reproduced with permission from reference [6]].
Figure 13
Figure 13
Results of the initially analyzed subjects from the study of Li et al. [80]. b-values distribution: 0, 2, 5, 10, 15, 20, 25, 30, 40, 60, 80, 100, 150, 200, 400, 600 s/mm2, and threshold b-value is 60 s/mm2, 3T scanner. (A) Four healthy volunteers and three liver fibrosis patients cannot be separated by Dslow when b = 0 image is included for bi-exponential IVIM analysis; while the volunteers and three liver fibrosis patients can be separated by Dslow when b = 0 image is not included for bi-exponential decay IVIM analysis. (B) The same study subjects as in (A), healthy volunteers and liver fibrosis patients cannot be separated by PF when b = 0 image was included for analysis; while volunteers and three liver fibrosis patients can be separated by PF when b = 0 image was not included for analysis. (C): Seven healthy volunteers (green dots) and six liver fibrosis patients (red dots) can be separated by 3-dimensional display of three IVIM parameters (PF, Dfast, Dslow). [Reproduced with permission from reference [78]].
Figure 14
Figure 14
An example of ‘vessel-pixel-removal’ postprocessing of Sb0 image (b-value = 0 s/mm2) and Sb2 image (b-value = 2 s/mm2). (A1) The original Sb0 image. (A2) A vertical line is drawn along the right border of vertebral body, the liver left to this line is excluded from analysis; (A3) The liver right to the vertical line is segmented manually, resulting in an area0. (A3) The pixels with signal 50% higher than the mean signal of segmented liver is tentatively excluded; (A4) The pixels with signal 45% higher than the mean signal of segmented liver is tentatively excluded. (A5-A11) follow the same rule as (A3 and A4). (A7) With the pixels of signal 35% higher than the mean signal excluded shows best results (compromise) in removing ‘bright’ vessel pixels in this case. (A8-A11) are considered to have too much ‘over-kill’. (B1) The original Sb2 image; (B2) The right liver is segmented similarly to (A3), resulting in an area2, and the pixels with signal 50% lower than the mean signal of segmented liver is excluded. (B3-B9) follow the same rule as (B2). (B6) With the pixels of signal 30% lower than the mean signal of segmented liver excluded show best results (compromise) in removing ‘signal-void ‘vessel pixels’ for this case. (B7-B9) are considered to have too much ‘over-kill’. [Reproduced with permission from reference [79]].
Figure 15
Figure 15
Correlation between DDVD and IVIM parameters. Data are from 26 healthy volunteers, 4 patients without fibrosis and 12 patients with various degree of viral hepatitis type-b induced fibrosis. A moderate and significant correlation is found between DDVD vs. PF, DDVD vs. Dfast, and DDVD vs. Dslow. A shift of threshold b-value from 60 s/mm2 to 200 s/mm2 only minimally weakens the correlation (Pearson r value from 0.501 to 0.452). [Results derived from reference [79], with permission].
Figure 16
Figure 16
Correlations between DDVD (b0b2) vs. DDVD (b0b15) and DDVD (b0b2) vs. DDVD (b0b10). Hereby b0b2, b0b10, and b0b15 refer to the signal differences between b = 0 image and b = 2 s/mm2 image, between b = 0 image and b = 10 s/mm2 image, and between b = 0 image and b = 15 s/mm2 image, respectively. (A and B) are with data from reference 79 containing both healthy livers and fibrotic livers. (C) is with data from reference 69 containing only healthy livers. One line represents one study subject. As expected, DDVD (b0b15) values are all higher than DDVD (b0b2) values (A). In (B and C), the means of DDVD (b0b2) values and DDVD (b0b15, or b0b10) values are taken as 1, and individual values are normalised with the mean value. (B) shows, for those with DDVD (b0b2) value above 1, the corresponding DDVD (b0b15) values are also mostly above 1. For those with DDVD (b0b2) value between 1~0.8. the corresponding DDVD (b0b15) values are also mostly between 1~0.8. (C) shows the similar trend as in (B). (B and C) show DDVD (b0b15) or DDVD (b0b10) values are less scattered than DDVD (b0b2) values. [Original data from references [69,79], reproduced with permission].
Figure 17
Figure 17
Bi-exponential segmented fitting curves of two liver IVIM scans with ROI (region-of-interest) based analysis. The b-value distribution is 2, 5, 10, 15, 20, 25, 30, 40, 60, 80, 100, 150, 200, 400, and 600 s/mm2, and fitting starts from b = 2 image. (A) represents a good fit and (B) represents an unacceptable fit that does not provide reliable measure. [Reproduced with permission from reference [6]].
Figure 18
Figure 18
DDVD (b0b2) measure (Y-axis) of healthy volunteers and their age (X-axis). Results of women (pink balls) show a trend of decreasing as age increases. Young and middle-aged women tend to have higher DDVD measure than that of men (blue squares) of similar age. [Reproduced with permission from reference [69]].
Figure 19
Figure 19
Relationship between IVIM measures and age in healthy volunteers. As the age increases, men’s Dslow shows a weak trend of decreasing, while women’s Dslow has significant reduction. Men and women’s PF and Dfast show a trend of increasing. Compared with young women, young men tend to have lower DDVD and Dslow measures and higher PF and Dfast measures; while around the age group of 40-55 years, all these measures are similar between men and women. The IVIM post-processing was based on segmented fittings with threshold b = 60 s/mm2 (full fitting shows similar trends). Blue square: males, red ball: females. [Modified with permission from reference [69]].
Figure 20
Figure 20
Histology results (right and left, both biopsy sample HE staining, magnification: × 100) from a patient with viral hepatitis-B induced liver cirrhosis (stage-4) in the study in reference 80. The Dslow was 0.75 × 10⁻³ mm-2/s, the reference for normal young livers was 1.16 × 10⁻³ mm2/s.
Figure 21
Figure 21
IVIM parameter three-dimensional plot of three studies by (A) Wang et al. [84], (B) Xiao et al. [79], and Li et al. (C) [80]. All modified with permission. The initial plot of Wang et al. in [84] has been re-drawn. (A) Green dots, liver of healthy volunteers; pink dot: stage-1/2 fibrotic livers; red dot: stage-3/4 fibrotic livers; (B) Green dot, liver of healthy volunteers; blue dots: 1 patient with mild simple steatosis and 3 viral hepatitis-b patients without liver fibrosis; orange dots: stage-1/2 patients; pink dots: stage-3/4 patients. (C) Green dot, liver of healthy volunteers; yellow dot: viral hepatitis-B patients without fibrosis; red dot: fibrotic livers.
Figure 22
Figure 22
Correlation between IVIM readout PF and serum liver function biomarker of albumin (normal range: 40-55 g/L). Vertical redline separates normal range and abnormal values which is further marked by red arrow. The patients’ result in this study shows if PF value is above 0.12, then albumin value will not be abnormally low. [Reproduced with permission from reference [80]].
Figure 23
Figure 23
Relationship between IVIM measures and severity of inflammatory in liver fibrosis patients caused by viral hepatitis-B. (A) Correlation between fibrosis grading and inflammation. Inflammation grading includes grade-0, grade-1, and grade-2. There is a positive correlation between fibrosis grading and inflammation grading (P = 0.0448). Scatter plots and mean of Dslow (B), Dfast (C) and PF (D) for inflammation grade-1 (n = 19) and grade-2 (n = 8) patients with liver fibrosis (one fibrosis patient with inflammation grade-0 is not included). Infl G1: inflammation grade-1, Infl G2: inflammation grade-2. [Reproduced with permission from reference [80]].
Figure 24
Figure 24
Graphical demonstration of the correlations among PF, Dfast, and Dslow. The mean measures of PF, Dslow, and Dfast for 16 patients are re-scaled to be 1. Each line or dot represents one study subject. Most of the PF measurements smaller than 1 are associated with Dfast smaller than 1, and vice versa. The lowest PF measurement is associated with the lowest Dfast measurement, and highest three PF measurements are associated with the highest three Dfast measurements (A, D). On the other hand, the associations between Dslow vs. PF or between Dslow vs. Dfast are scattered (B, C, E, F). A number of Dslow measurements larger than 1 are associated with PF or Dfast measurements smaller than 1. Pearson correlation coefficient r was 0.865 (P < 0.001) for PF vs. Dfast (not significant for Dslow vs. PF and Dslow vs. Dfast). [Reproduced with permission from reference 83]].

References

    1. Norris DG. The effects of microscopic tissue parameters on the diffusion weighted magnetic resonance imaging experiment. NMR Biomed. 2001;14:77–93. - PubMed
    1. Mills R. Self-diffusion in normal and heavy-water in range 1-45 degrees. J Phys Chem. 1973;77:685–688.
    1. Stejskal EO, Tanner JE. Spin diffusion measurements: spin echoes in the presence of a time-dependent field gradient. J Cheml Phys. 1965;42:288–92.
    1. Le Bihan D, Breton E, Lallemand D, Grenier P, Cabanis E, Laval-Jeantet M. MR imaging of intravoxel incoherent motions: application to diffusion and perfusion in neurologic disorders. Radiology. 1986;161:401–7. - PubMed
    1. Le Bihan D, Turner R, Moonen CT, Pekar J. Imaging of diffusion and microcirculation with gradient sensitization: design, strategy, and significance. J Magn Reson Imaging. 1991;1:7–28. - PubMed

LinkOut - more resources