

Quantitative assessment of cerebral metabolism and hemodynamics in small-for-gestational-age (SGA) newborns
- PMID: 34079704
- PMCID: PMC8107312
- DOI: 10.21037/qims-20-1040
Quantitative assessment of cerebral metabolism and hemodynamics in small-for-gestational-age (SGA) newborns
Abstract
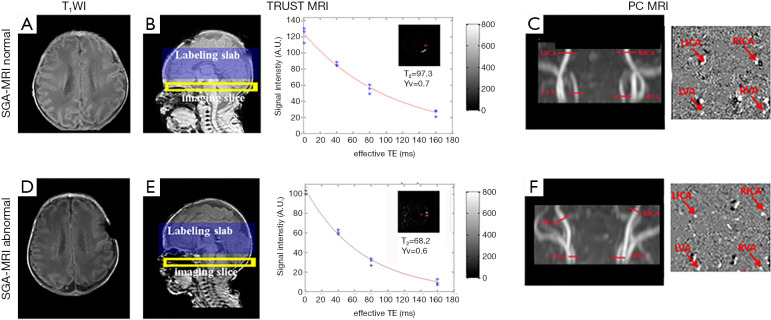
Background: Small-for-gestational-age (SGA) newborns represent approximately 10% of births worldwide and 45% of births in some countries. It has been suggested that SGA might cause learning difficulties and behavioral abnormalities in childhood, yet the neurobiological basis for this is poorly understood. In this study, we employed several advanced imaging techniques-including T2-relaxation-under-spin-tagging (TRUST) magnetic resonance imaging (MRI), and phase-contrast (PC) MRI-to quantify oxygen extraction fraction (OEF), global cerebral blood flow (CBF), and cerebral metabolic rate of oxygen (CMRO2) to elucidate pathophysiological vulnerabilities of SGA neonates.
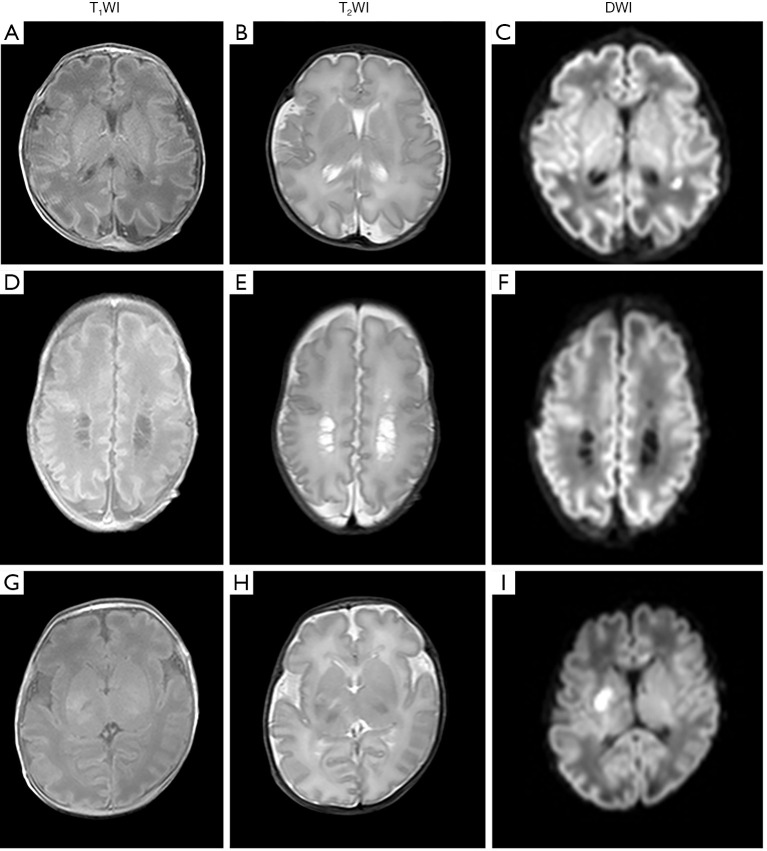
Methods: A total of 41 newborns were enrolled in this study, consisting of 29 SGA and 12 appropriate-for-gestational-age (AGA) neonates. The SGA group was further divided into subgroups with and without abnormalities on structural MRI, denoted as SGA-a (N=17) and SGA-n (N=12). TRUST and PC MRI were performed to determine OEF, CBF, and CMRO2. Linear regression analyses were performed to examine physiological parameters' dependence on scan age, gender, and group. Similar analyses were conducted for birth weight and brain volume. Receiver operating characteristic (ROC) curves were used to test physiological parameters' ability to different diagnostic groups.
Results: Regression analysis revealed that CMRO2 was significantly lower (P=0.04) in the SGA group relative to the AGA group. When further stratifying the SGA participants into SGA-a and SGA-n subgroups, the SGA-a subgroup was found to have the most pronounced physiological deficits, with a lower CMRO2 (P=0.004) and lower CBF (P=0.007) than those in the AGA group. Conversely, CMRO2 (P=0.40) and CBF (P=0.90) in the SGA-n subgroup were not different from those of the AGA group. Accordingly, CBF in the SGA-a group was significantly lower (P=0.01) than that of the SGA-n group and CMRO2 also showed a difference (P=0.09). Additionally, CMRO2 (P=0.002) and CBF (P=0.04) showed an age-related increase during this early developmental period. In analyzing the SGA-a subgroup relative to the remaining neonates, the area under curve (AUC) values were 0.6, 0.6, 0.7, 0.8, and 0.5 for birth weight, OEF, CMRO2, CBF, and brain volume, respectively. In analyzing the SGA-a subgroup relative to the SGA-n subgroup, AUC values were 0.5, 0.6, 0.7, 0.8, and 0.5 for birth weight, OEF, CMRO2, CBF, and brain volume.
Conclusions: Structural damage in SGA-a neonates is associated with cerebral hemodynamic and metabolic deficits. SGA neonates with normal CBF and CMRO2reveal minimal structural abnormalities. Physiological imaging may help identify SGA patients at high risk of developing irreversible brain damage.
Keywords: Small-for-gestational-age (SGA); T2-relaxation-under-spin-tagging (TRUST); cerebral blood flow (CBF); cerebral metabolic rate of oxygen (CMRO2); magnetic resonance imaging (MRI); oxygen extraction fraction (OEF); oxygen saturation fraction in venous blood (Yv); phase-contrast (PC).
2021 Quantitative Imaging in Medicine and Surgery. All rights reserved.
Conflict of interest statement
Conflicts of Interest: All authors have completed the ICMJE uniform disclosure form (available at http://dx.doi.org/10.21037/qims-20-1040). The authors have no conflicts of interest to declare.
Figures

Similar articles
-
Hemodynamic and Metabolic Assessment of Neonates With Punctate White Matter Lesions Using Phase-Contrast MRI and T2-Relaxation-Under-Spin-Tagging (TRUST) MRI.Front Physiol. 2018 Mar 19;9:233. doi: 10.3389/fphys.2018.00233. eCollection 2018. Front Physiol. 2018. PMID: 29615927 Free PMC article.
-
Neurophysiologic Profiling of At-Risk Low and Very Low Birth-Weight Infants Using Magnetic Resonance Imaging.Front Physiol. 2021 Mar 23;12:638868. doi: 10.3389/fphys.2021.638868. eCollection 2021. Front Physiol. 2021. PMID: 33833688 Free PMC article.
-
Multi-Parametric Evaluation of Cerebral Hemodynamics in Neonatal Piglets Using Non-Contrast-Enhanced Magnetic Resonance Imaging Methods.J Magn Reson Imaging. 2021 Oct;54(4):1053-1065. doi: 10.1002/jmri.27638. Epub 2021 May 6. J Magn Reson Imaging. 2021. PMID: 33955613 Free PMC article.
-
Blood oxygenation level-dependent (BOLD)-based techniques for the quantification of brain hemodynamic and metabolic properties - theoretical models and experimental approaches.NMR Biomed. 2013 Aug;26(8):963-86. doi: 10.1002/nbm.2839. Epub 2012 Aug 28. NMR Biomed. 2013. PMID: 22927123 Free PMC article. Review.
-
Cerebral oxygen extraction fraction MRI: Techniques and applications.Magn Reson Med. 2022 Aug;88(2):575-600. doi: 10.1002/mrm.29272. Epub 2022 May 5. Magn Reson Med. 2022. PMID: 35510696 Free PMC article. Review.
Cited by
-
Auditory Pathway Maturation in Full-term Small for Gestational Age Children: A Systematic Review with Meta-analysis.Int Arch Otorhinolaryngol. 2023 Apr 11;27(4):e744-e750. doi: 10.1055/s-0042-1758215. eCollection 2023 Oct. Int Arch Otorhinolaryngol. 2023. PMID: 37876702 Free PMC article. Review.
-
The Impact of Different Degrees of Intraventricular Hemorrhage on Mortality and Neurological Outcomes in Very Preterm Infants: A Prospective Cohort Study.Front Neurol. 2022 Mar 21;13:853417. doi: 10.3389/fneur.2022.853417. eCollection 2022. Front Neurol. 2022. PMID: 35386416 Free PMC article.
-
Cerebral Hemodynamic and Metabolic Abnormalities in Neonatal Hypocalcemia: Findings from Advanced MRI.AJNR Am J Neuroradiol. 2023 Oct;44(10):1224-1230. doi: 10.3174/ajnr.A7994. Epub 2023 Sep 14. AJNR Am J Neuroradiol. 2023. PMID: 37709354 Free PMC article.
References
LinkOut - more resources
Full Text Sources
Miscellaneous