

Associations between brain volumetry and relaxometry signatures and the Edmonton Frail Scale in frailty
- PMID: 34079723
- PMCID: PMC8107325
- DOI: 10.21037/qims-20-852
Associations between brain volumetry and relaxometry signatures and the Edmonton Frail Scale in frailty
Abstract
Background: Frailty is a geriatric condition characterized by a decreased reserve. The Edmonton frailty scale (EFS) has been widely used as an assessment tool in clinical practice. However, the brain's underlying pathophysiological changes in frailty and their associations with the EFS remain unclear. This study aimed to explore the associations between brain volumetry and relaxometry signatures and the EFS (and each domain score of the EFS) in frailty.
Methods: A total of 40 non-demented subjects were enrolled in this prospective study. Frailty assessment was performed for each subject according to the EFS. All subjects underwent synthetic magnetic resonance imaging (MRI) (MAGnetic resonance image Compilation, MAGiC) and three-dimensional fast spoiled gradient-recalled echo (3D-FSPGR) T1-weighted structural image acquisitions on a 3.0 T MR scanner. Brain segmentation was performed based on quantitative values obtained from the MAGiC and 3D-FSPGR images. Volumetry and relaxometry of the global brain and regional gray matter (GM) were also obtained. The associations between the total EFS score (and the score of each domain) and the brain's volumetry and relaxometry were investigated by partial correlation while eliminating the effects of age. Multiple comparisons of regional GM volumetry and relaxometry analyses were controlled by false discovery rate (FDR) correction. All data were analyzed using the SPSS 13.0 statistical package (IBM, Armonk, NY, USA) and MATLAB (MathWorks, Natick, MA, USA).
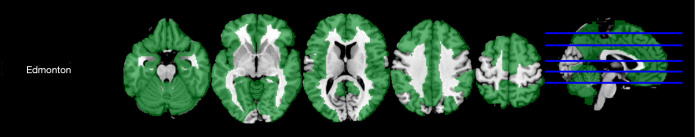
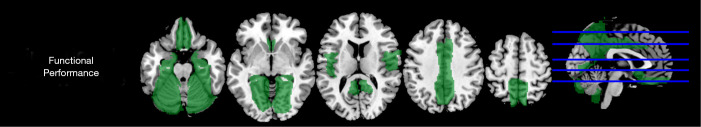
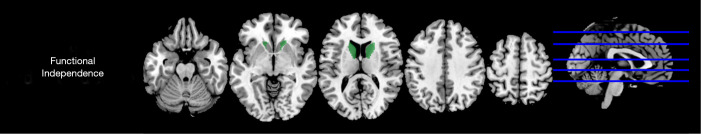
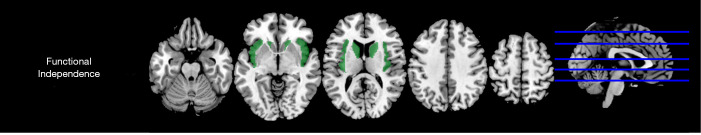
Results: For global volumetry, significant correlations were found between multiple global volumetry parameters and the EFS, as well as the cognition score, functional independence score, nutrition score, and functional performance score (P<0.05). For global relaxometry, notable positive correlations were found between the T2 values of gray and white matter (WM) and the EFS (r=0.357, P=0.026; r=0.357, P=0.026, respectively). Significant correlations were also identified between the T2 value of GM, the T1, T2, and PD values of WM, and the cognition score (r=0.426, P=0.007; r=0.456, P=0.003; r=0.377, P=0.018; r=0.424, P=0.007, respectively), functional independence score (r=-0.392, P=0.014; r=-0.611, P<0.001; r=-0.367, P=0.022; r=-0.569, P<0.001, respectively), and functional performance score (r=0.337, P=0.036; r=0.472, P=0.002; r=0.354, P=0.027; r=0.376, P=0.018, respectively). For regional GM volumetry, multiple regions showed significant negative correlations with the EFS (P<0.05). Notable negative correlations were found between multiple regional GM volume and the functional independence score (P<0.05). For regional GM relaxometry, the T1 and T2 values of several regions showed significant negative correlations with the functional independence score (T1 value of caudate, r=-0.617, P<0.001; T2 value of insula, r=-0.510, P=0.015; T2 value of caudate, r=-0.633, P<0.001, respectively). No significant correlation was found between the domain scores of the EFS and regional GM PD values (P>0.05).
Conclusions: In conclusion, brain volumetry and relaxometry signatures showed strong associations with the EFS and some EFS domain scores in frailty. These associations may reveal the possible underlying pathophysiology of the EFS and different domains of the EFS.
Keywords: Synthetic magnetic resonance imaging (MRI); frailty; relaxometry; the Edmonton frailty scale (EFS); volumetry.
2021 Quantitative Imaging in Medicine and Surgery. All rights reserved.
Conflict of interest statement
Conflicts of Interest: All authors have completed the ICMJE uniform disclosure form (available at http://dx.doi.org/10.21037/qims-20-852). Dr. MW reports grants from Beijing Municipal Science & Technology Commission, during the conduct of the study. Dr. MC reports grants from National Natural Science Foundation of China, grants from CAMS Innovation Fund for Medical Sciences, during the conduct of the study. The other authors have no conflicts of interest to declare.
Figures
Similar articles
-
Rapid quantification of global brain volumetry and relaxometry in patients with multiple sclerosis using synthetic magnetic resonance imaging.Quant Imaging Med Surg. 2022 Jun;12(6):3104-3114. doi: 10.21037/qims-21-970. Quant Imaging Med Surg. 2022. PMID: 35655839 Free PMC article.
-
A preliminary study of synthetic magnetic resonance imaging on the changes of subcortical gray matter nuclei in obstructive sleep apnea patients.Quant Imaging Med Surg. 2025 May 1;15(5):3911-3922. doi: 10.21037/qims-24-1830. Epub 2025 Apr 14. Quant Imaging Med Surg. 2025. PMID: 40384657 Free PMC article.
-
Age-Related Changes in Relaxation Times, Proton Density, Myelin, and Tissue Volumes in Adult Brain Analyzed by 2-Dimensional Quantitative Synthetic Magnetic Resonance Imaging.Invest Radiol. 2021 Mar 1;56(3):163-172. doi: 10.1097/RLI.0000000000000720. Invest Radiol. 2021. PMID: 32858581 Free PMC article.
-
Combined diffusion-relaxometry microstructure imaging: Current status and future prospects.Magn Reson Med. 2021 Dec;86(6):2987-3011. doi: 10.1002/mrm.28963. Epub 2021 Aug 19. Magn Reson Med. 2021. PMID: 34411331 Free PMC article. Review.
-
Utility of Frailty Screening Tools in Older Surgical Patients.Ann Geriatr Med Res. 2020 Jun;24(2):75-82. doi: 10.4235/agmr.20.0023. Epub 2020 Jun 24. Ann Geriatr Med Res. 2020. PMID: 32743327 Free PMC article. Review.
Cited by
-
Rapid quantification of global brain volumetry and relaxometry in patients with multiple sclerosis using synthetic magnetic resonance imaging.Quant Imaging Med Surg. 2022 Jun;12(6):3104-3114. doi: 10.21037/qims-21-970. Quant Imaging Med Surg. 2022. PMID: 35655839 Free PMC article.
-
Neuroimaging Findings in Nondemented Frail Individuals: A Systematic Review.J Cachexia Sarcopenia Muscle. 2025 Feb;16(1):e13719. doi: 10.1002/jcsm.13719. J Cachexia Sarcopenia Muscle. 2025. PMID: 39934085 Free PMC article.
-
Technical aspects and clinical applications of synthetic MRI: a scoping review.Diagnosis (Berl). 2025 Feb 7;12(2):163-174. doi: 10.1515/dx-2024-0168. eCollection 2025 May 1. Diagnosis (Berl). 2025. PMID: 39913860
-
Effects of Baduanjin exercise on cognitive frailty, oxidative stress, and chronic inflammation in older adults with cognitive frailty: a randomized controlled trial.Front Public Health. 2024 May 23;12:1385542. doi: 10.3389/fpubh.2024.1385542. eCollection 2024. Front Public Health. 2024. PMID: 38846613 Free PMC article. Clinical Trial.
-
Multimodal neuroimaging exploration of the mechanisms of sleep quality deterioration after SARS-CoV-2 Omicron infection.BMC Med. 2024 Jun 26;22(1):271. doi: 10.1186/s12916-024-03487-9. BMC Med. 2024. PMID: 38926881 Free PMC article.
References
LinkOut - more resources
Full Text Sources