. 2021 May 26;7(5):900-908.
doi: 10.1021/acscentsci.1c00254. Epub 2021 Apr 23.

Continuum Crystallization Model Derived from Pharmaceutical Crystallization Mechanisms

Affiliations

Continuum Crystallization Model Derived from Pharmaceutical Crystallization Mechanisms

Yael Tsarfati et al. ACS Cent Sci. .

Abstract

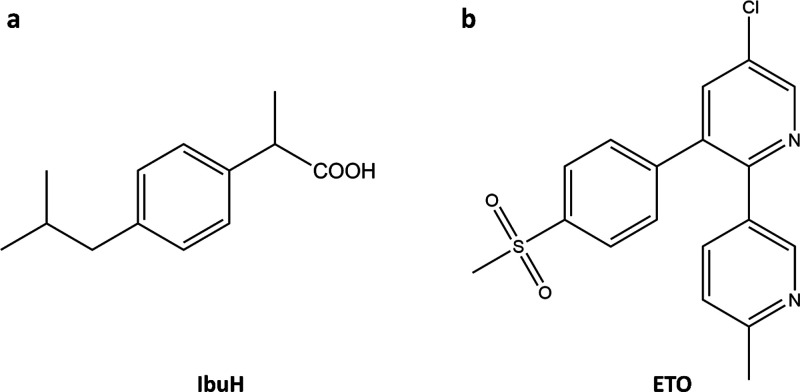
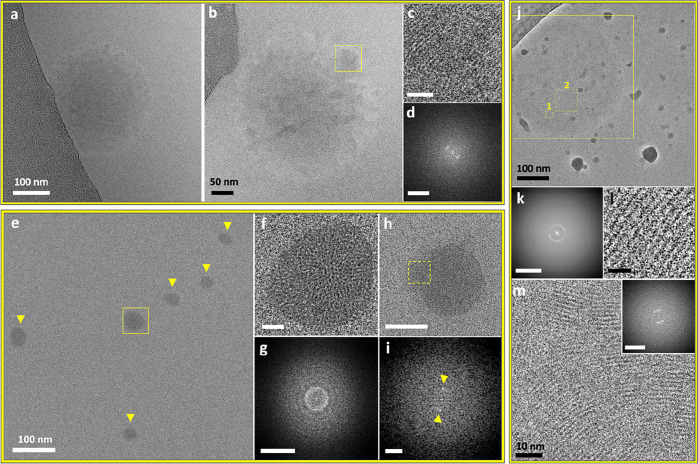
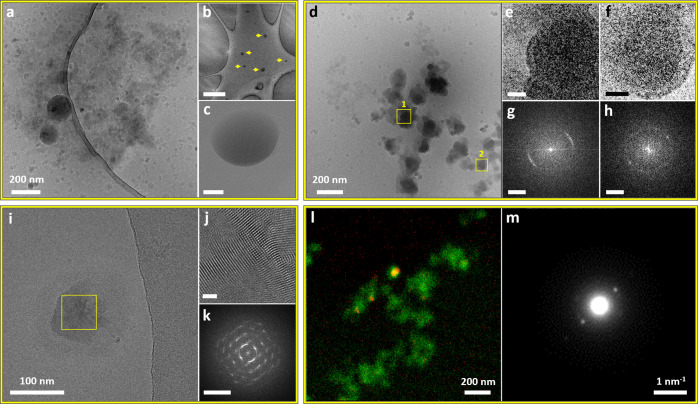
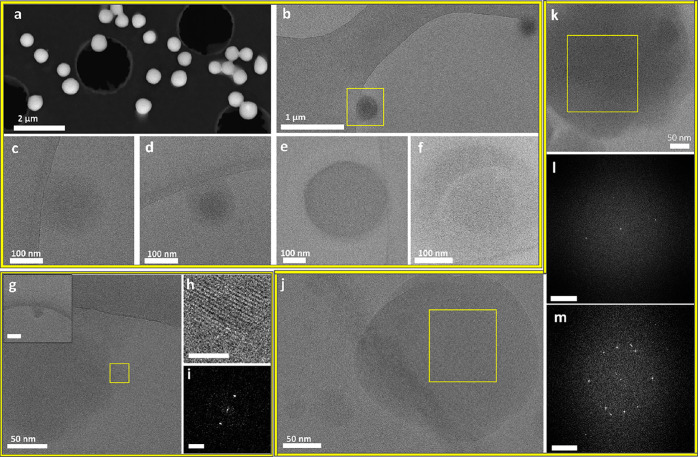
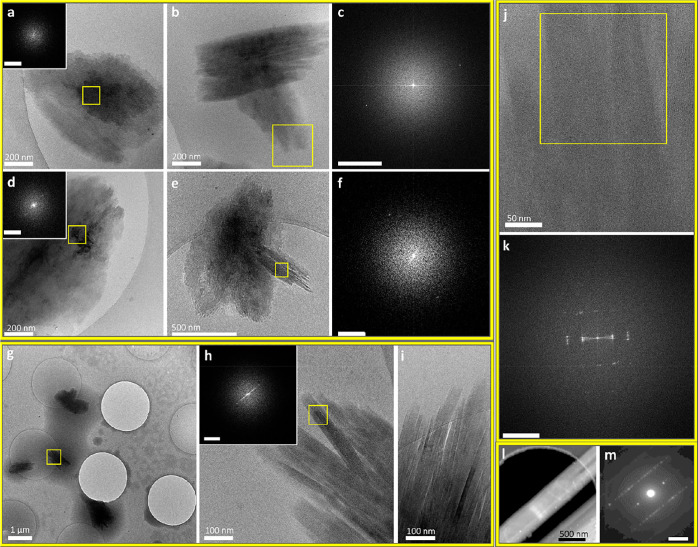
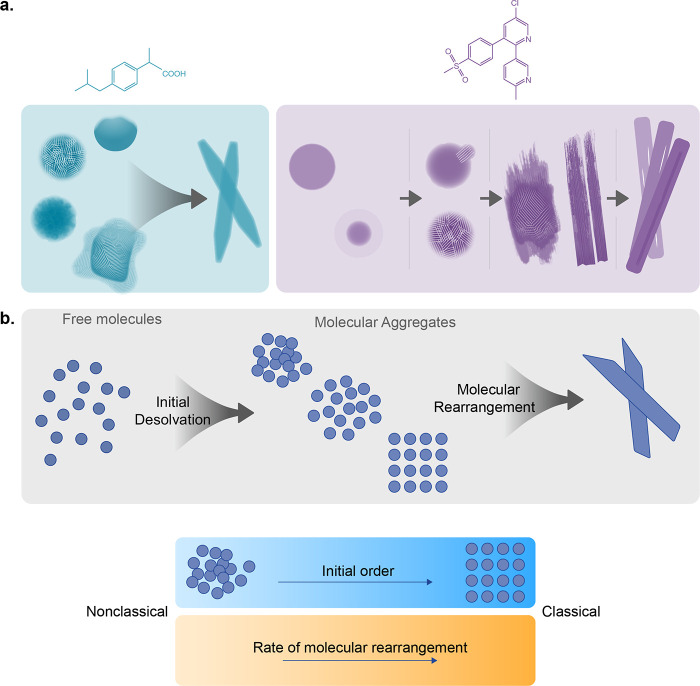
The crystallization mechanisms of organic molecules in solution are not well-understood. The mechanistic scenarios where crystalline order evolves directly from the molecularly dissolved state ("classical") and from initially formed amorphous intermediates ("nonclassical") are suggested and debated. Here, we studied crystallization mechanisms of two widely used analgesics, ibuprofen (IbuH) and etoricoxib (ETO), using direct cryogenic transmission electron microscopy (cryo-TEM) imaging. In the IbuH case, parallel crystallization pathways involved diverse phases of high and low density, in which the instantaneous formation of final crystalline order was observed. ETO crystallization started from well-defined round-shaped amorphous intermediates that gradually evolved into crystals. This mechanistic diversity is rationalized by introducing a continuum crystallization paradigm: order evolution depends on ordering in the initially formed intermediates and efficiency of molecular rearrangements within them, and there is a continuum of states related to the initial order and rearrangement rates. This model provides a unified view of crystallization mechanisms, encompassing classical and nonclassical pictures.


Conflict of interest statement

The authors declare no competing financial interest.

Figures

Figure 1
Figure 1
Molecular structures of (a) ibuprofen, IbuH; and (b) etoricoxib, ETO.
Figure 2
Figure 2
Cryo-TEM images of low-density intermediate phases in IbuH crystallization (resulting from IbuNa titration with HCl in aqueous medium). (a) Diffuse amorphous phase following titration with 2.2 mL of HCl. (b) Diffuse phase with a crystalline area, marked by the yellow square, following titration with 2.2 mL of HCl. (c) Magnified view of the marked area in part b displaying lattice fringes. Scale bar is 10 nm. (d) FFT of part c showing a d-spacing of 1.59 nm; scale bar is 2 nm–1. (e) Area with several intermediates marked by arrows and a yellow square. (f) Magnified view of the aggregate marked in part e. Scale bar is 10 nm. (g) FFT of part f. Scale bar is 2 nm–1. A bright distinct ring is apparent in part g (while absent in the FFT of the background, see Figure S8). The ring indicates randomly oriented crystalline domains with a 1.63 nm spacing. (h)Intermediate similar by morphology to those displayed in part e, exhibiting a crystalline domain, marked by the yellow square. Scale bar is 50 nm. (i) FFT of the region marked in part h, displaying FFT peaks (spots marked by arrows), corresponding to a d-spacing of 1.61. Scale bar is 1 nm–1. (j) Extensive polycrystalline phase, following titration with 6 mL of HCl, imaged using a Volta phase plate. The background contains high-contrast ice contamination. (k) FFT of the marked area in part j that contains the intermediate phase (the largest square), showing a d-spacing of 1.6 nm. Scale bar is 2 nm–1. (l) Representative image of a magnified crystalline area in part j (square 1), exhibiting lattice fringes with 1.55 nm spacing. Scale bar is 5 nm. (m) Representative image of a magnified crystalline area with multiple orientations in the intermediate in part j, corresponding to square 2. Inset: FFT of part m displaying a d-spacing of 1.61 nm. Scale bar is 2 nm–1. The sharpness and contrast of the background in parts e, f, and h were adjusted to better distinguish the aggregates. The original images are presented in Figure S4.
Figure 3
Figure 3
Cryo-TEM images of intermediate phases in IbuH crystallization, resulting from IbuNa titration with HCl in an aqueous medium. (a–c) Titration with 3 mL of HCl: (a) Spherical aggregates embedded in a cloudlike material. The background contains ice contamination. A low-magnification image of part a is presented in Figure S12. (b, c) Blotless samples. (b) Low-magnification image of several amorphous phases (marked by yellow arrows). Scale bar is 2 μm. (c) Magnified view of a representative aggregate shown in part b. Scale bar is 100 nm. (d) Dense aggregates following titration with 2.4 mL of HCl. (e, f) Magnified views of the areas marked by squares 1 and 2 in part d, exhibiting lattice fringes. Scale bars are 20 nm. (g, h) FFTs of parts e and f, respectively, showing a d-spacing of 1.57 nm. Scale bars are 0.5 nm–1. (i) Crystalline intermediate (titration with 1 mL of HCl). (j) Magnified view of the marked area in part i. Lattice fringes are apparent. Scale bar is 10 nm. (k) FFTs of part j displaying d-spacings from 1.57 nm down to 0.43 nm. Scale bar is 2 nm–1. (l, m) STED measurement, scanning an area with a cluster of underdeveloped dense nanocrystals (by a morphology similar to the aggregates displayed in parts d and i) following titration with 6 mL of HCl: (l) Color mix image of the scanned area with the HAADF signal in green, overlaid with the location of electron diffraction originating from crystalline diffraction around a d-spacing of 1.6 nm in red. (m) Averaged diffraction pattern derived from all diffraction patterns showing high correlation with 2-fold symmetry in the scanned area.
Figure 4
Figure 4
Amorphous ETO phases after 1 min (a), 3 min (c, d), and 15 min (b, e, f) following initial mixing (3.48 × 10⁻³ M ETO in water:MeOH = 9:1 (v/v) solution): (a) Representative SEM image of a dried sample. (b) Cryo-TEM image of an area containing two round amorphous aggregates. (c, d) Cryo-TEM images of diffuse round-shaped structures, showing a density gradient from the core to periphery. (e) Cryo-TEM image of an amorphous sphere displaying a uniform density and well-defined boundary. (f) Magnified view of the marked area in part b, showing a round aggregate with a denser core compared to its peripheral area. Cryo-TEM images of the crystallization intermediates after 45 min (g–i), 25 min (j), and 30 min (k–m) following initial mixing (3.48 × 10⁻³ M ETO in water:MeOH = 9:1 (v/v) solution): (g) Structure showing order in the peripheral area (marked in yellow). Inset: low-magnification view of part g. Scale bar is 200 nm. (h) Enlarged inverse FFT of part i, revealing the lattice fringes. Scale bar is 5 nm. (i) FFT of the marked area in part g, showing a d-spacing of 0.48 nm. Scale bar is 2 nm–1. (j) Round structure with a sharp border with the solution. Fringes are visible in the majority of the aggregate. (k) Aggregate with varying density. (l) FFT of the marked area in part k displaying a d-spacing of 0.36 nm. Scale bar is 2 nm–1. (m) FFT of the marked area in part j, displaying a d-spacing of 0.4, 0.36, and 0.98 nm, which correlate to the ones in the reported ETO crystal. Scale bar is 2 nm–1.
Figure 5
Figure 5
TEM and cryo-TEM images of (a–f) crystallization intermediates, 90 min aging, and (g–m) developed ETO needlelike crystals: (a) Sheetlike structure. Inset: FFT on the marked area displaying a d-spacing of 0.94 nm. Scale bar is 1 nm–1. (b) High-contrast structure with partial faceting. (c) FFT on the marked area of part b, displaying a d-spacing of 0.86 nm. Scale bar is 1 nm–1. (d) Large high-density structure. Inset: FFT on the marked area, displaying a d-spacing of 1.31 nm. Scale bar is 1 nm–1. (e) Low-magnification image of needles emerging from the high-density structure. (f) FFT of the marked area of part e, displaying a d-spacing of 0.58 nm. Scale bar is 1 nm–1. (g) High-contrast aggregates scattered on the grid. (h) Magnified view of the area marked in part g, showing bundles of needles. Inset: FFT of the marked area, revealing 1.14 nm spacing. Scale bar is 1 nm–1. (i) High-magnification cryo-TEM image of needles. (j) High-magnification cryo-TEM image of needles with similar thicknesses. (k) FFT of the marked area in part j, displaying a d-spacing of 0.41 nm. Scale bar is 2 nm–1. (l) Room-temperature dark-field STEM image of a needlelike crystal (from aged solution, drop-cast on a grid and dried overnight). (m) Averaged electron diffraction pattern of the thin areas found in part l. d-spacings derived from the diffraction pattern are 0.43 and 0.57 nm. Scale bar is 2 nm–1.
Figure 6
Figure 6
(a) Schematic of order evolution in IbuH and ETO crystallization. (b) Continuum crystallization model, where higher initial order and faster molecular rearrangements correspond to a “classical” end of the continuum.

Similar articles

Cited by

References

    1. Banfield J. F. Aggregation-Based Crystal Growth and Microstructure Development in Natural Iron Oxyhydroxide Biomineralization Products. Science 2000, 289, 751–754. 10.1126/science.289.5480.751. - DOI - PubMed
    1. Hirsch A.; Palmer B. A.; Elad N.; Gur D.; Weiner S.; Addadi L.; Kronik L.; Leiserowitz L. Biologically Controlled Morphology and Twinning in Guanine Crystals. Angew. Chem., Int. Ed. 2017, 56, 9420–9424. 10.1002/anie.201704801. - DOI - PubMed
    1. Grotzinger J. P.; James N. P.. Carbonate Sedimentation and Diagenesis in the Evolving Precambrian World; Grotzinger J. P., James N. P., Eds.; Society for Sedimentary Geology, 2000.
    1. Yaghi O. M.; O’Keeffe M.; Ockwig N. W.; Chae H. K.; Eddaoudi M.; Kim J. Reticular Synthesis and the Design of New Materials. Nature 2003, 423, 705–714. 10.1038/nature01650. - DOI - PubMed
    1. Krieg E.; Niazov-Elkan A.; Cohen E.; Tsarfati Y.; Rybtchinski B. Noncovalent Aqua Materials Based on Perylene Diimides. Acc. Chem. Res. 2019, 52, 2634–2646. 10.1021/acs.accounts.9b00188. - DOI - PubMed