. 2021 May 12;3(5):e0394.
doi: 10.1097/CCE.0000000000000394. eCollection 2021 May.

Leukocyte Activation Profile Assessed by Raman Spectroscopy Helps Diagnosing Infection and Sepsis

Affiliations

Leukocyte Activation Profile Assessed by Raman Spectroscopy Helps Diagnosing Infection and Sepsis

Anuradha Ramoji et al. Crit Care Explor. .

Abstract

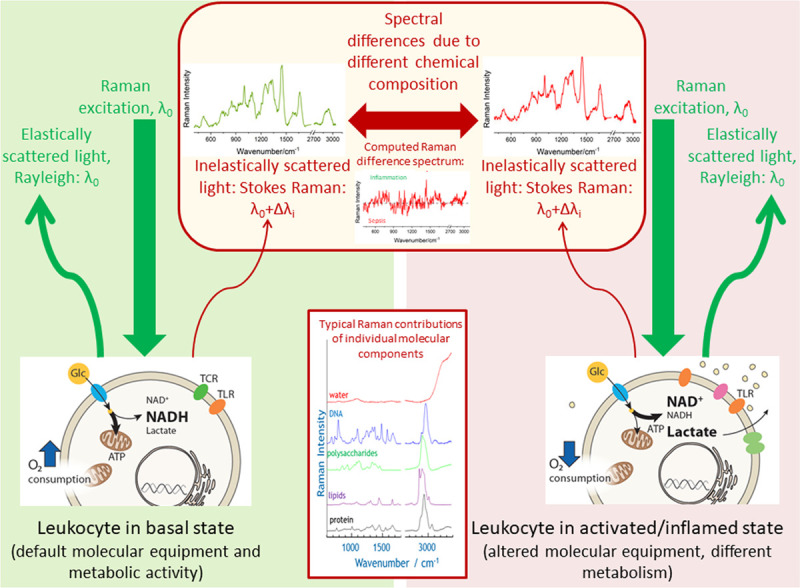
Objectives: Leukocytes are first responders to infection. Their activation state can reveal information about specific host immune response and identify dysregulation in sepsis. This study aims to use the Raman spectroscopic fingerprints of blood-derived leukocytes to differentiate inflammation, infection, and sepsis in hospitalized patients. Diagnostic sensitivity and specificity shall demonstrate the added value of the direct characterization of leukocyte's phenotype.

Design: Prospective nonrandomized, single-center, observational phase-II study (DRKS00006265).

Setting: Jena University Hospital, Germany.

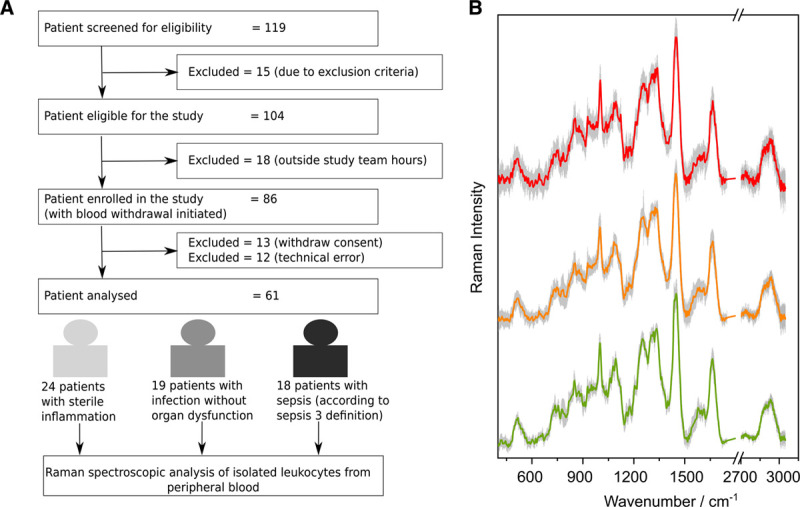
Patients: Sixty-one hospitalized patients (19 with sterile inflammation, 23 with infection without organ dysfunction, 18 with sepsis according to Sepsis-3 definition).

Interventions: None (blood withdrawal).

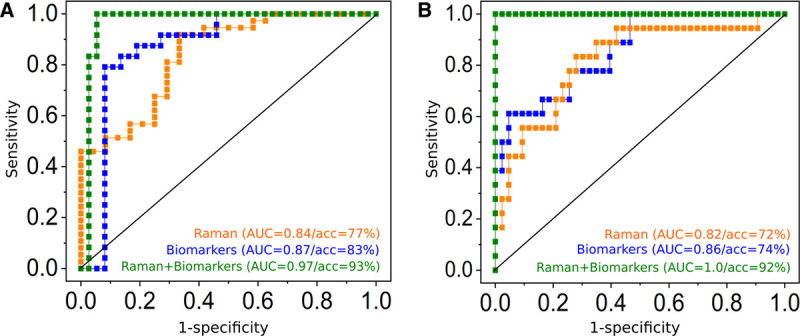
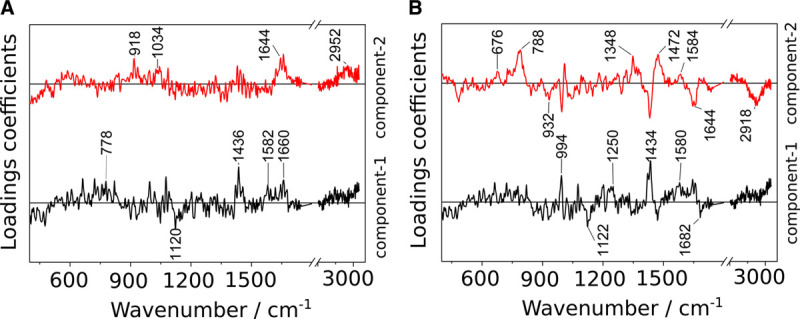
Measurements and main results: Individual peripheral blood leukocytes were characterized by Raman spectroscopy. Reference diagnostics included established clinical scores, blood count, and biomarkers (C-reactive protein, procalcitonin and interleukin-6). Binary classification models using Raman data were able to distinguish patients with infection from patients without infection, as well as sepsis patients from patients without sepsis, with accuracies achieved with established biomarkers. Compared with biomarker information alone, an increase of 10% (to 93%) accuracy for the detection of infection and an increase of 18% (to 92%) for detection of sepsis were reached by adding the Raman information. Leukocytes from sepsis patients showed different Raman spectral features in comparison to the patients with infection that point to the special immune phenotype of sepsis patients.

Conclusions: Raman spectroscopy can extract information on leukocyte's activation state in a nondestructive, label-free manner to differentiate sterile inflammation, infection, and sepsis.

Keywords: Raman spectroscopy; biomarker; immune response; infection and inflammation; leukocytes activation; sepsis diagnosis.


Conflict of interest statement

The authors have disclosed that they do not have any potential conflicts of interest.

Figures

Figure 1.
Figure 1.
Schematics visualizing the Raman effect and highlighting the molecular origin of different Raman spectra of leukocytes in different disease states. The Raman spectrum plots the wavelength shift Δλi as Raman intensity over wavenumber νi = 1/Δλi. Origin of that wavelength shift is the inelastic scattering of the monochromatic excitation light with wavelength λ0 on the different molecular vibrations of the chemical components in the leukocytes. Upon infection or exposure to pathogens, most immune cells undergo dramatic rewiring of their cellular energy metabolism which also affects immune cells’ phenotype and function (e.g., expression of different receptors [e.g., TCR = T cell receptor, TLR = toll-Like receptor). In basal state glucose (Glc) is used for efficient energy production (ATP = adenosine triphosphate) in the mitochondria. In activated state decoupling is observed with increased lactate production and increased levels of oxidized nicotinamide adenine dinucleotide (NAD+) (NADH = reduced form of NAD, H for hydrogen). As Raman spectroscopy probes intrinsic properties of the molecules (molecular vibrational states), it is a label-free method. Laser light intensities in the visible are low to keep Raman spectroscopy a nondestructive method. Spectral differences in complex biological systems, such as immune cells, are usually difficult to see by naked eye and require the use of statistical data analysis methods. The simplest way to visualize the variations between the groups is by computing a difference spectrum between the group means. In this work, also supervised statistical models are used to extract the spectral features characteristic for group differentiation as well as to assign class membership in an automated manner.
Figure 2.
Figure 2.
Patient flow chart and Raman spectra per patient group. A, Flow chart for patient recruitment during HemoSpec study. Technical error: not possible to withdraw the required volume of blood or nonavailability of the device. B, Mean preprocessed Raman spectra are shown together with sd (gray shadows) for sepsis (red, top), infection without organ failure (orange, center), and sterile inflammation (green, bottom). The spectra are shifted on the y-axis to avoid overlap.
Figure 3.
Figure 3.
Added value of Raman leukocyte analysis to detect infections (A) and to identify sepsis (B). Receiver operating characteristic (ROC) curves obtained from canonical-powered partial least squares (CPPLS) analysis. All models were validated using leave-one-patient-out cross-validation. Predictions using Raman spectroscopic data were obtained on a single-cell level and were aggregated to obtain a single value (median of all leukocytes) per patient (orange curves). A, ROC curves for infection detection (against sterile inflammation) using predictions based on Raman spectroscopic data (orange curve), biomarker scores (C-reactive protein, procalcitonin, and interleukin-6, blue curve), and on a combined model using Raman scores and biomarkers scores (green curve). B, ROC curves for sepsis detection (against sterile inflammation and infection without organ failure) using predictions from Raman spectroscopic data (orange curve), from biomarkers (blue curve) and using a combined CPPLS models using Raman scores and biomarker values (green curve). Scatterplots of the data used for sepsis detection based on Raman spectroscopic scores and biomarkers are shown in Figure S6 (http://links.lww.com/CCX/A583); the model loadings and the fitted model in Figure S7 (http://links.lww.com/CCX/A583). The combined models (green curves in A and B) show superior diagnostic power. Please note that balanced accuracies (acc) can be different from 1, also if area under the curve (AUC) is 1, as there is only a small margin between the patient groups. Thus, when a patient is excluded from the training data within the cross-validation loop, the model and the estimation of the optimal threshold change slightly. This might lead to a misprediction of some patients when the threshold is set for the prediction within the cross-validation loop, even if the cross-validated predicted values perfectly separate the groups.
Figure 4.
Figure 4.
Canonical-powered partial least squares coefficients for the first two latent variables in the Raman models for the detection of (A) infection and (B) sepsis. Respective scatter plots are depicted in Figure S5 (http://links.lww.com/CCX/A583).

References

    1. Rudd KE, Johnson SC, Agesa KM, et al. . Global, regional, and national sepsis incidence and mortality, 1990-2017: Analysis for the global burden of disease study. Lancet. 2020; 395:200–211 - PMC - PubMed
    1. Venet F, Chung C-S, Huang X, et al. . Lymphocytes in the development of lung inflammation: A role for regulatory CD4(+) T cells in indirect pulmonary lung injury. J Immunol. 2009; 183:3472–3480 - PMC - PubMed
    1. Bauer M, Coldewey SM, Leitner M, et al. . Deterioration of organ function as a hallmark in sepsis: The cellular perspective. Front Immunol. 2018; 9:1460. - PMC - PubMed
    1. Rubio I, Osuchowski MF, Shankar-Hari M, et al. . Current gaps in sepsis immunology: New opportunities for translational research. Lancet Infect Dis. 2019; 19:e422–e436 - PubMed
    1. Pierrakos C, Velissaris D, Bisdorff M, et al. . Biomarkers of sepsis: Time for a reappraisal. Crit Care. 2020; 24:287. - PMC - PubMed