. 2020 Nov;1(11):1066-1081.
doi: 10.1038/s43018-020-00131-2. Epub 2020 Nov 2.

The proliferative history shapes the DNA methylome of B-cell tumors and predicts clinical outcome

Affiliations

The proliferative history shapes the DNA methylome of B-cell tumors and predicts clinical outcome

Martí Duran-Ferrer et al. Nat Cancer. 2020 Nov.

Abstract

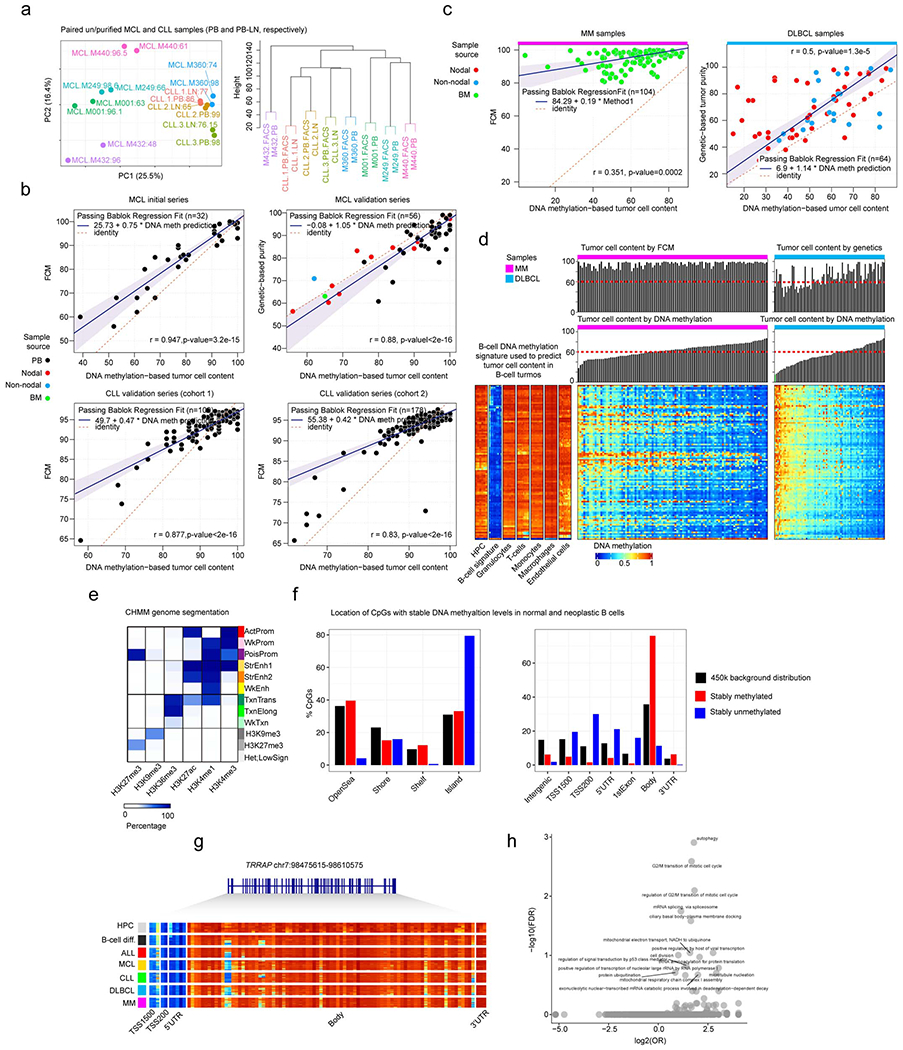
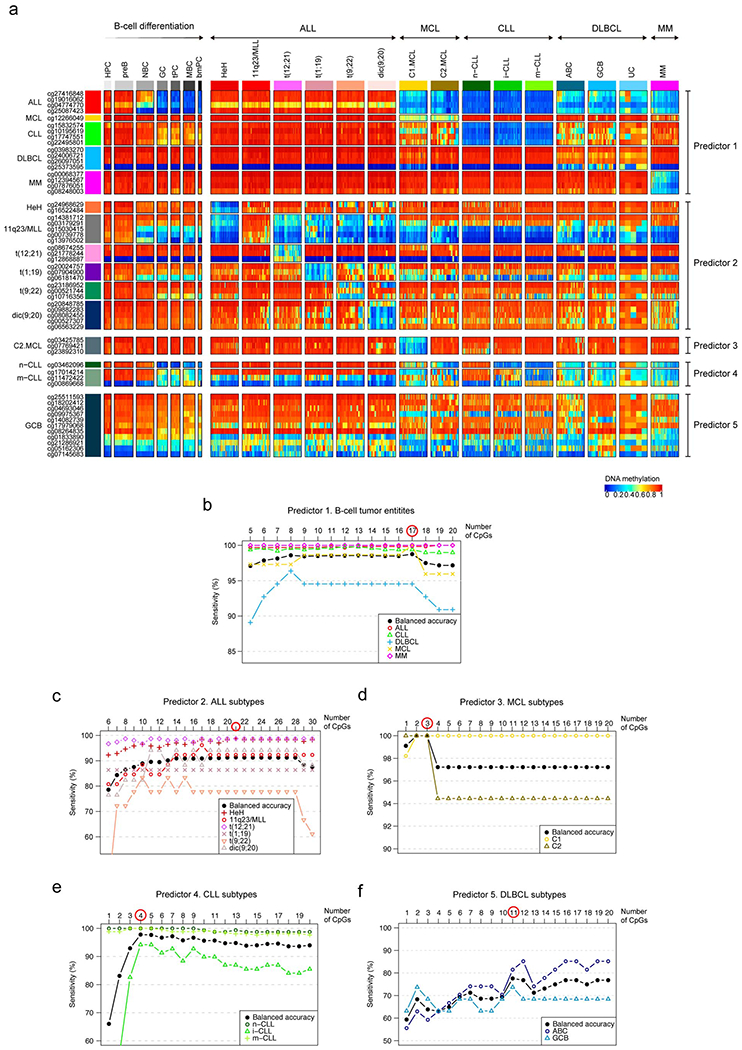
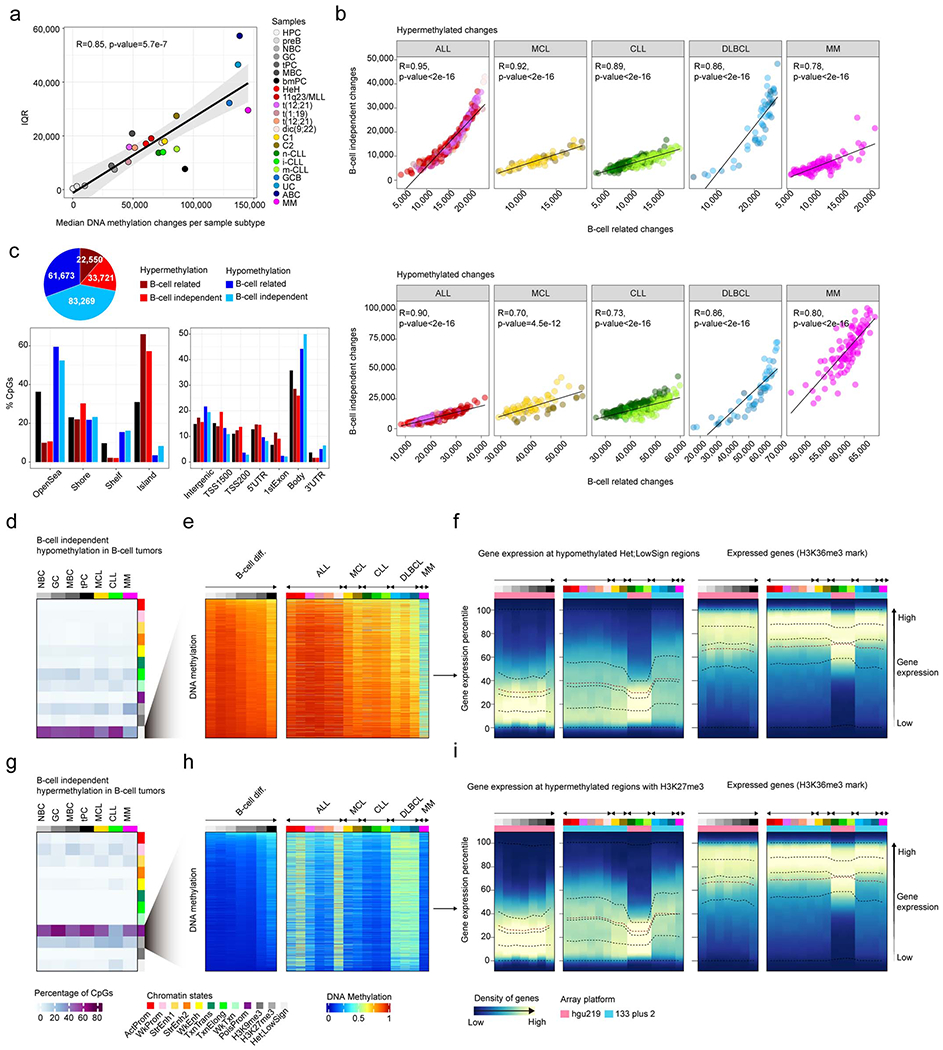
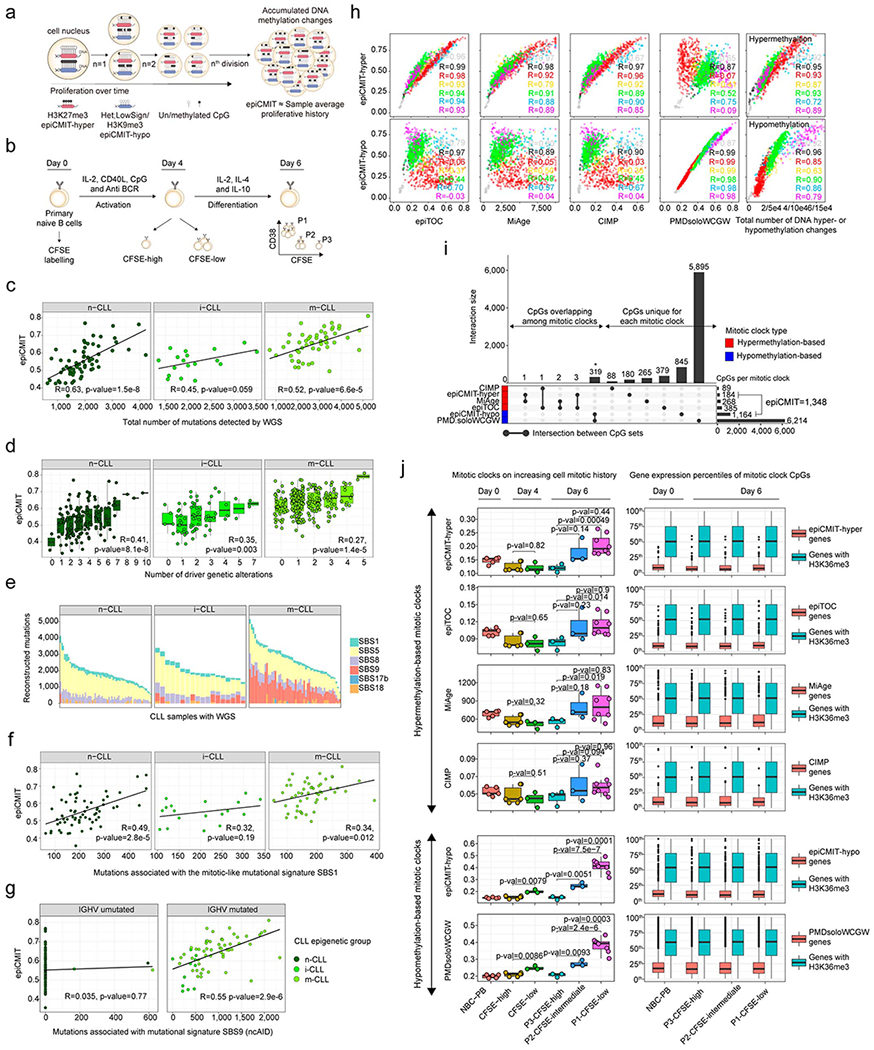
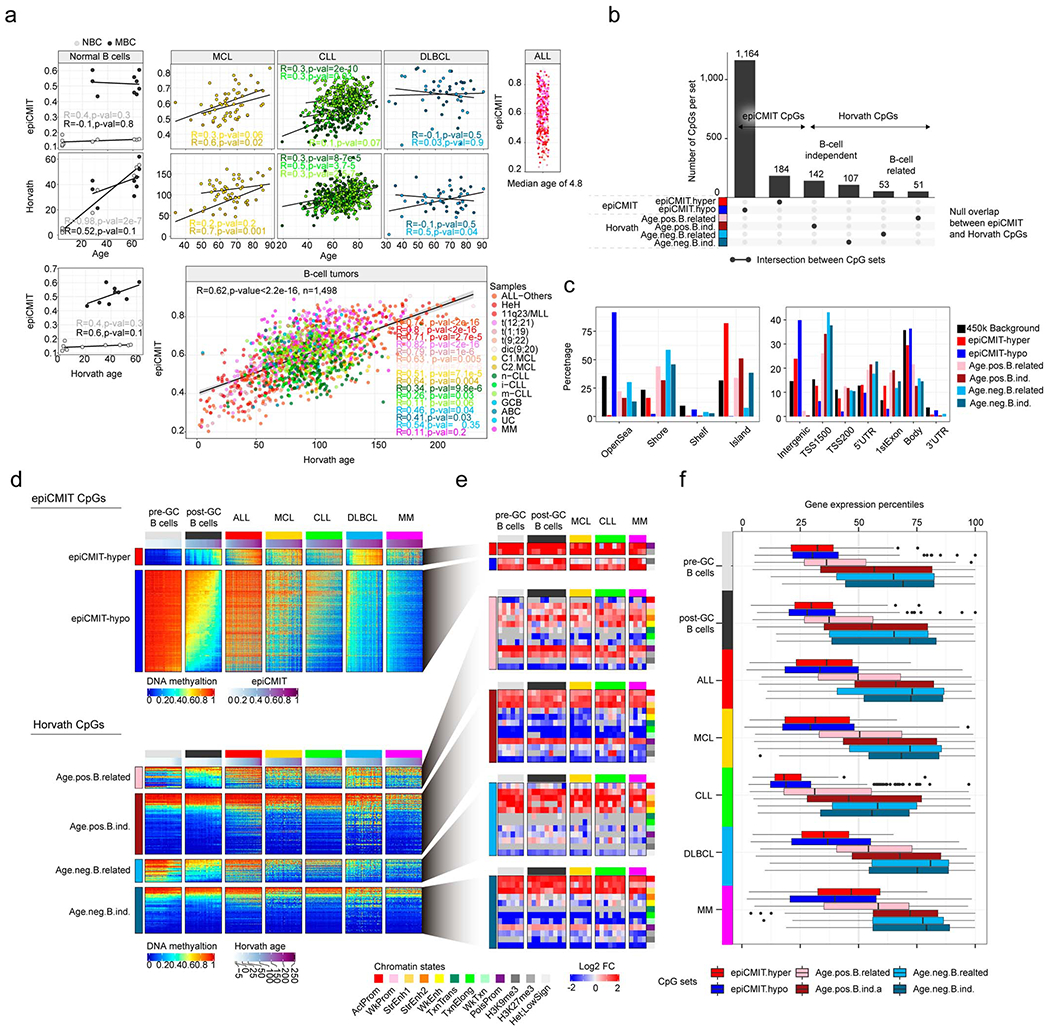
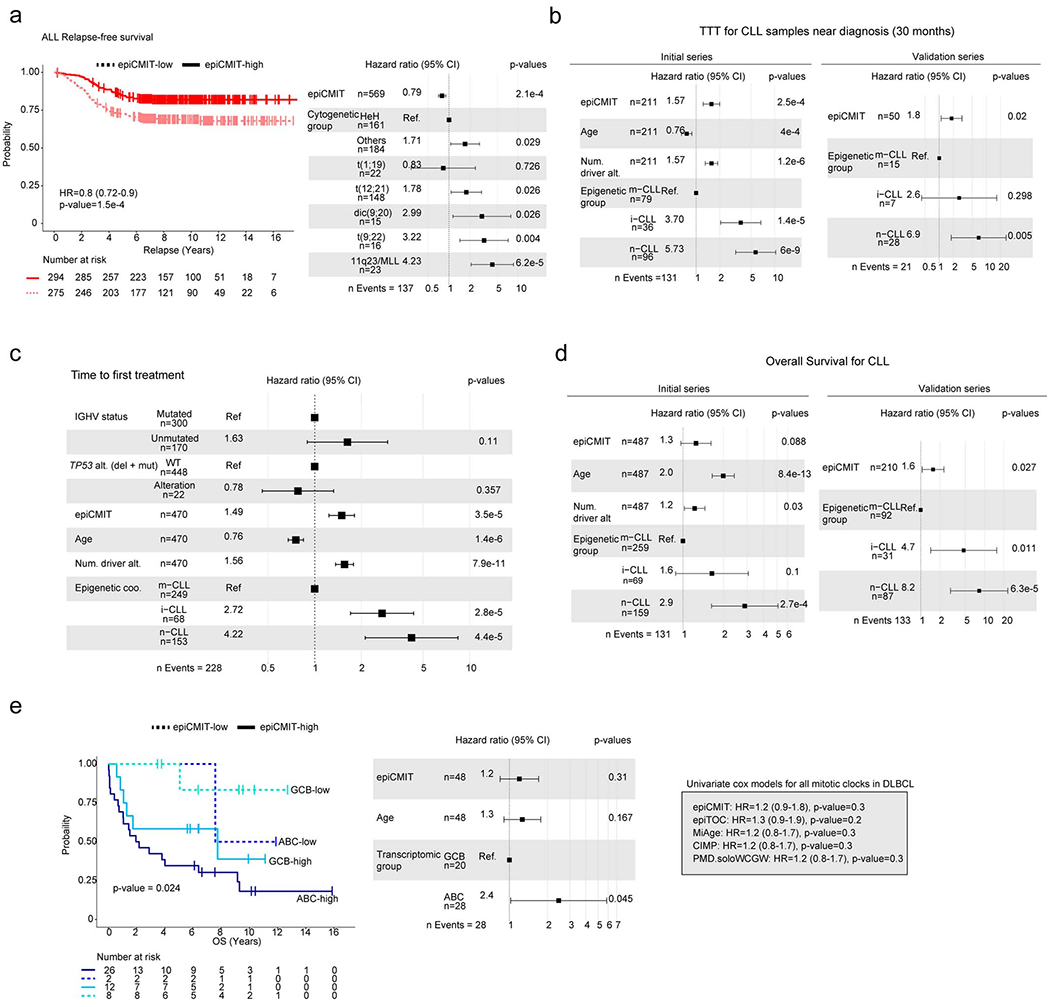
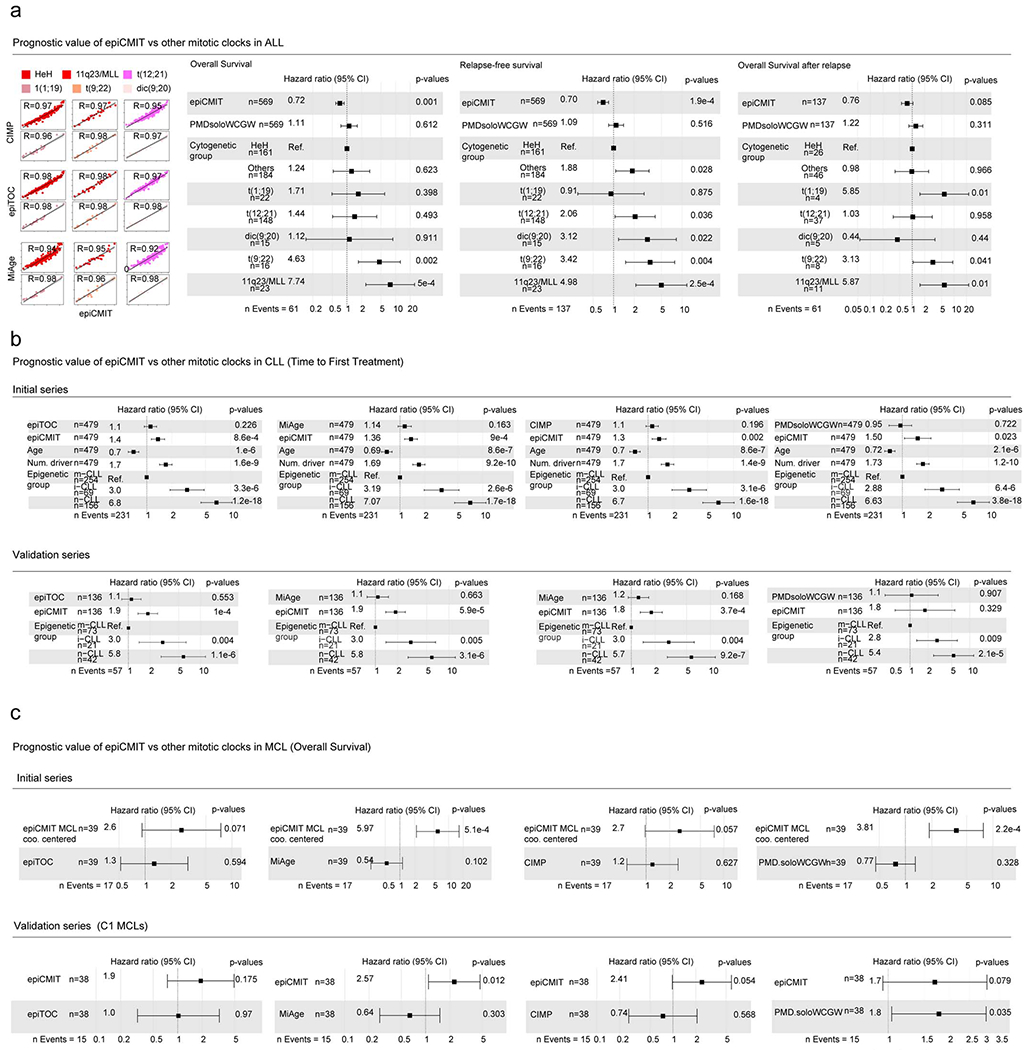
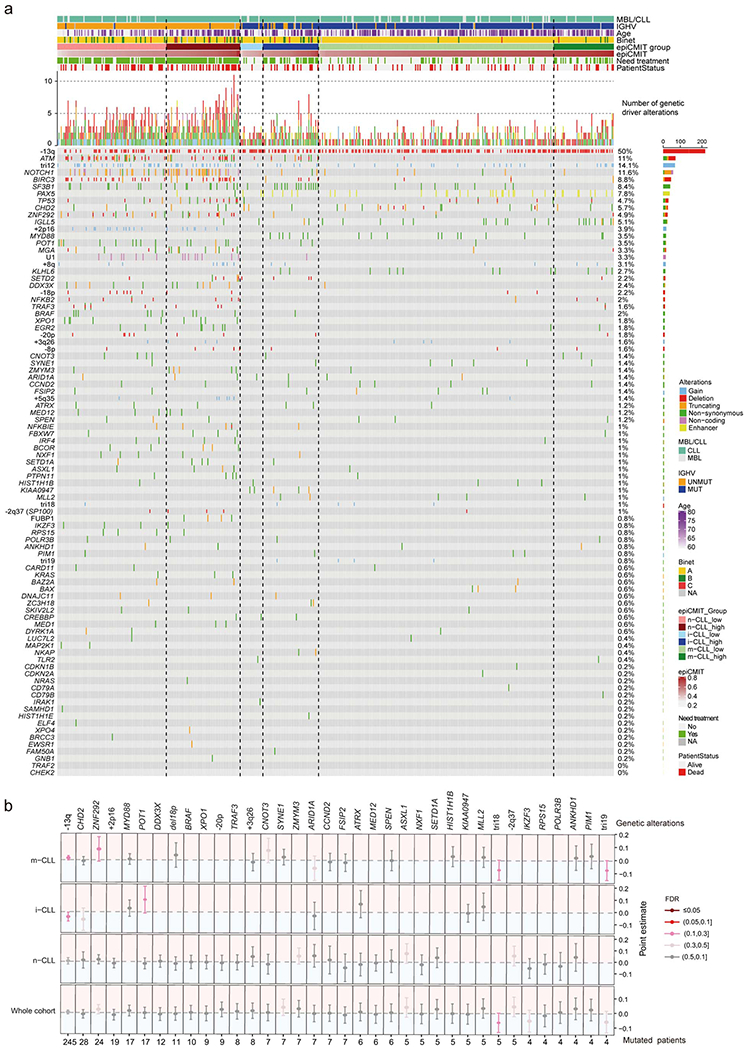
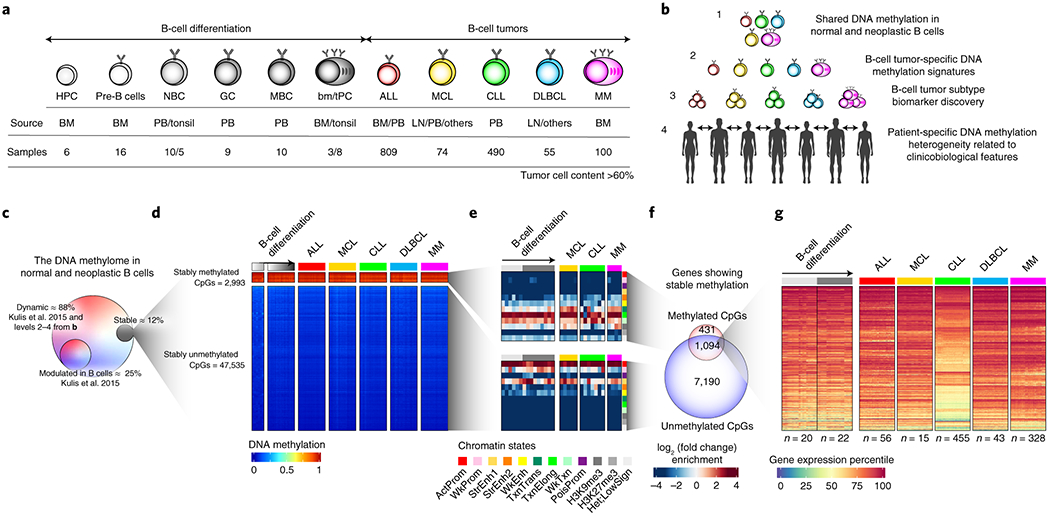
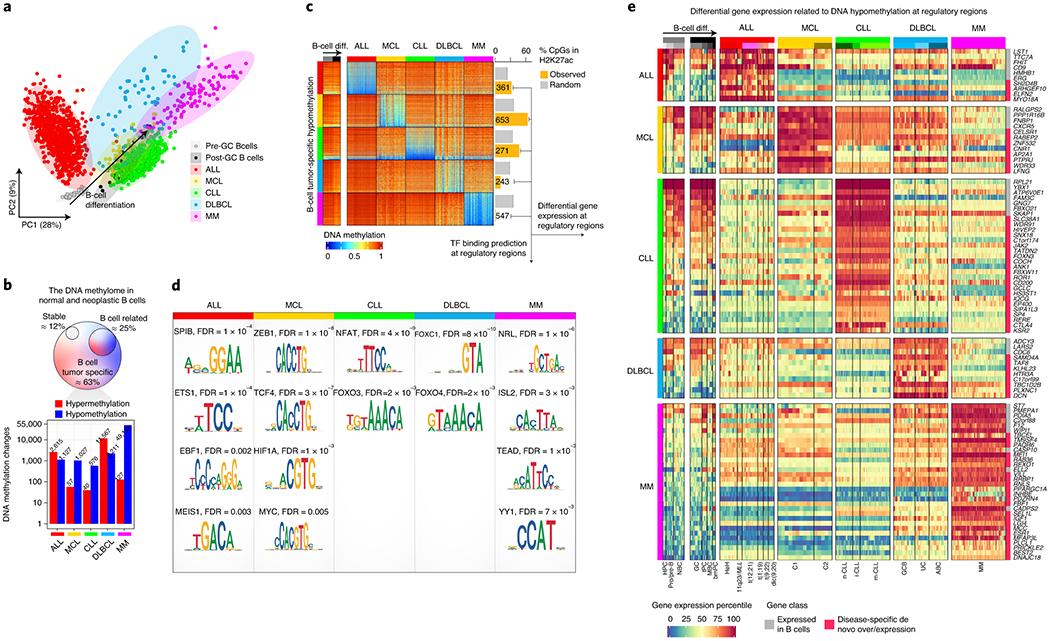
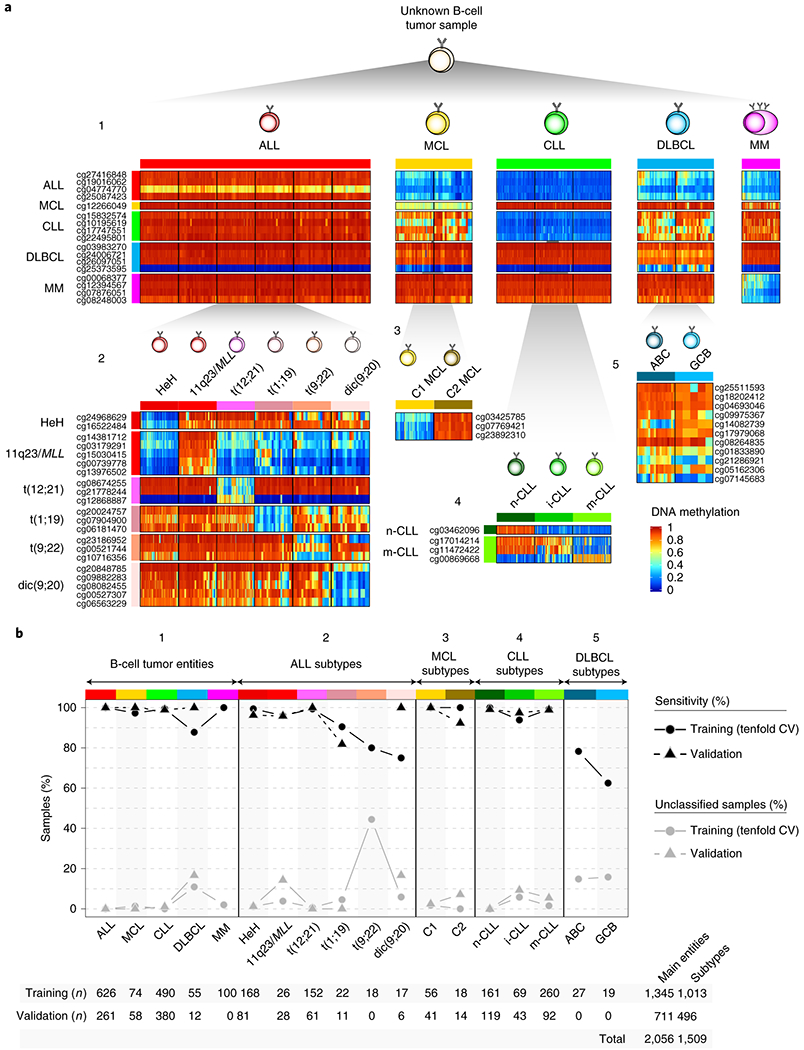
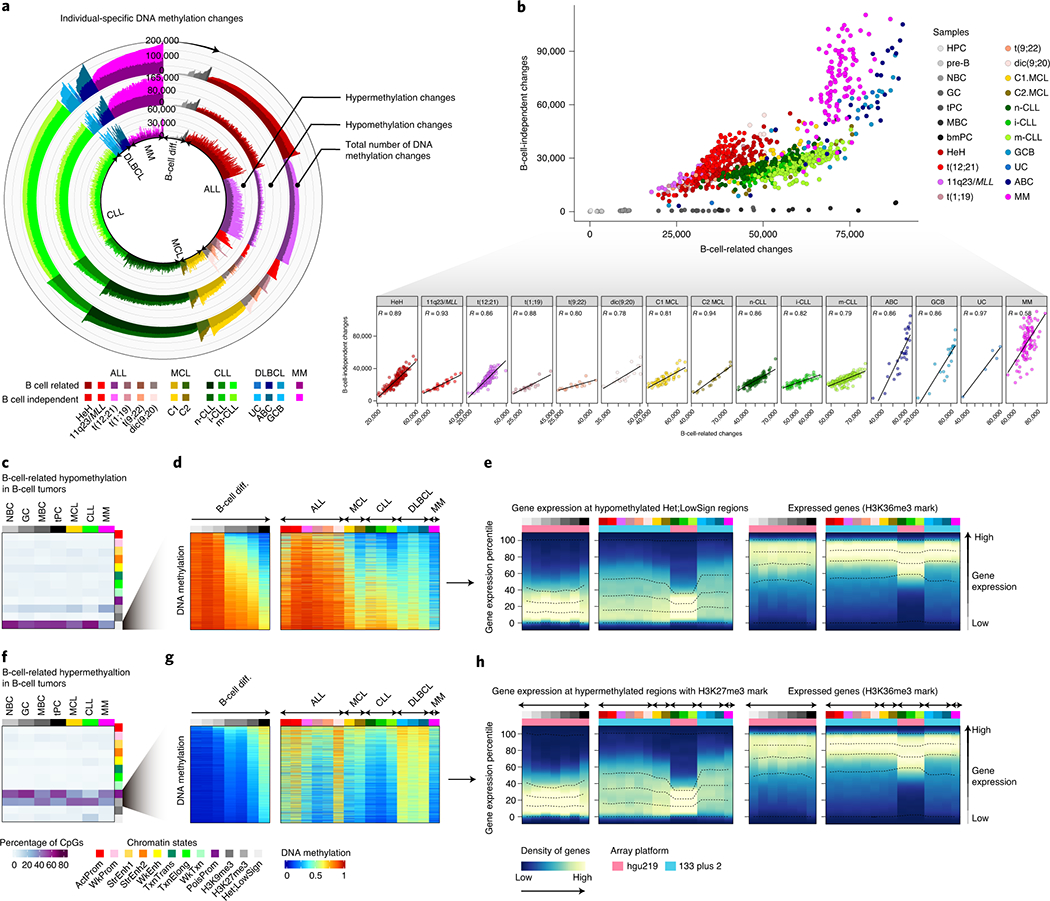
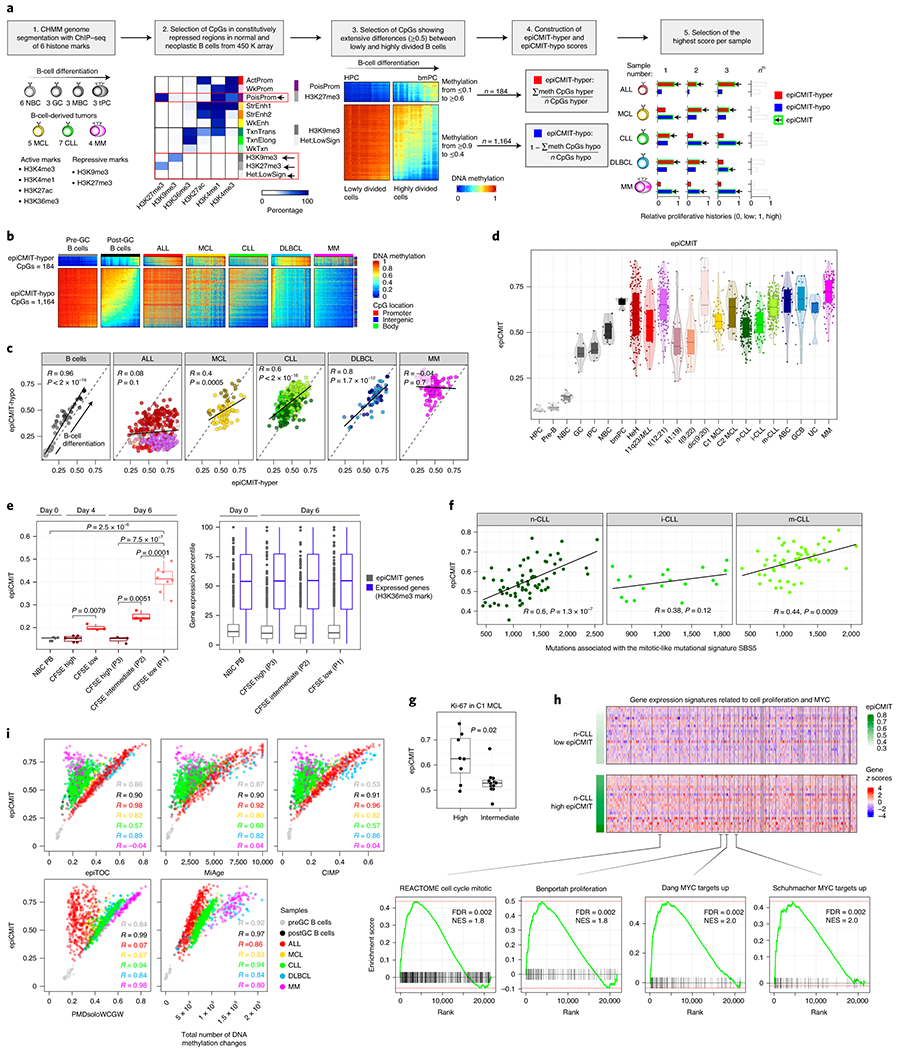
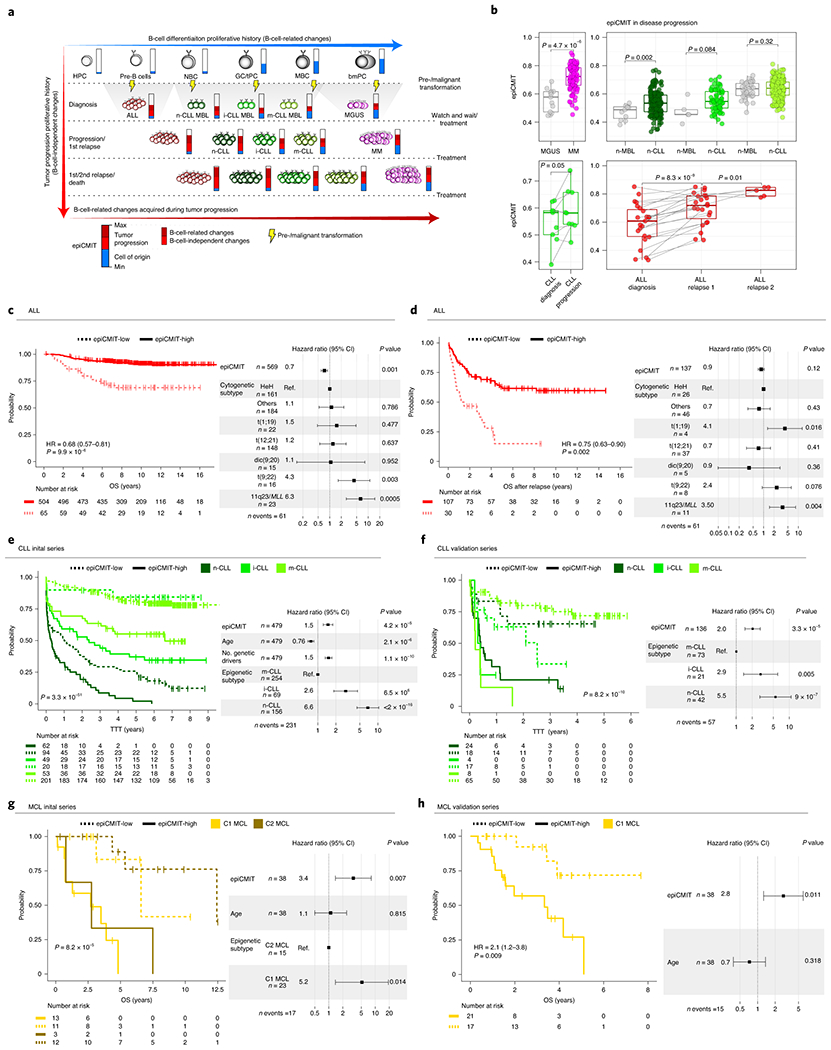
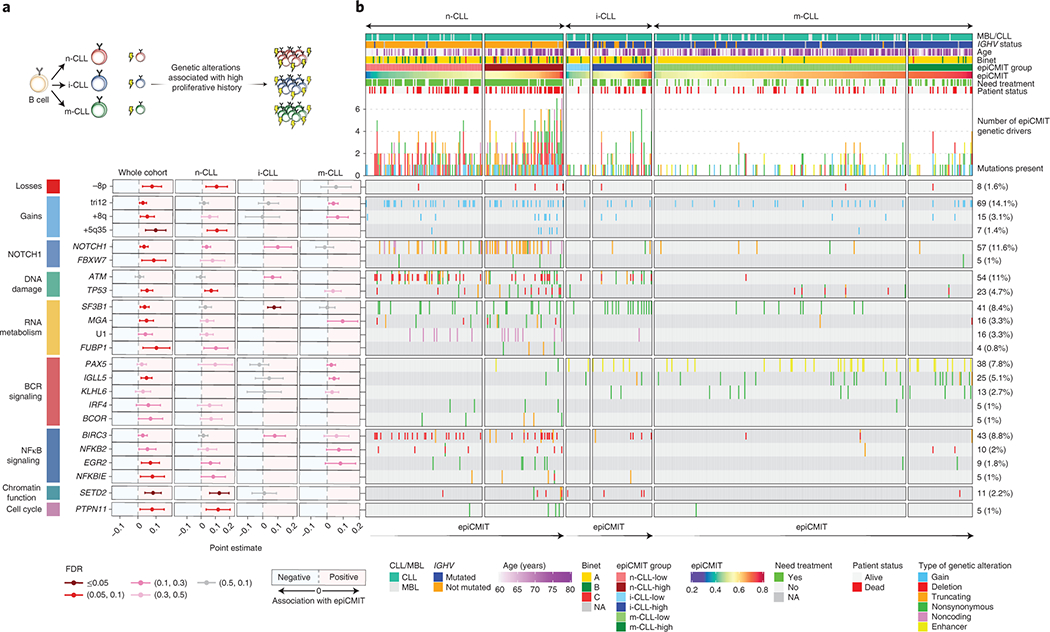
We report a systematic analysis of the DNA methylation variability in 1,595 samples of normal cell subpopulations and 14 tumor subtypes spanning the entire human B-cell lineage. Differential methylation among tumor entities relates to differences in cellular origin and to de novo epigenetic alterations, which allowed us to build an accurate machine learning-based diagnostic algorithm. We identify extensive patient-specific methylation variability in silenced chromatin associated with the proliferative history of normal and neoplastic B cells. Mitotic activity generally leaves both hyper- and hypomethylation imprints, but some B-cell neoplasms preferentially gain or lose DNA methylation. Subsequently, we construct a DNA methylation-based mitotic clock called epiCMIT, whose lapse magnitude represents a strong independent prognostic variable in B-cell tumors and is associated with particular driver genetic alterations. Our findings reveal DNA methylation as a holistic tracer of B-cell tumor developmental history, with implications in the differential diagnosis and prediction of clinical outcome.


Conflict of interest statement

COMPETING INTERESTS The authors declare no competing interests.

Figures

Extended Data Fig. 1
Extended Data Fig. 1. Analyses related to sample selection and annotation of stably-methylated CpGs
a, Principal component analysis and hierarchical clustering of synchronic unpurified/purified DNA methylation profiles obtained with EPIC array from MCL and CLL patients. Colors represent the same sample, with FCM-based purities highlighted in each sample. MCL, mantle cell lymphoma. CLL, chronic lymphocytic leukemia. b, Correlations and Passing Bablock regression fits of gold-standard methods for tumor purity prediction (FCM and genetic-based) against DNA methylation-based tumor purity prediction for MCL and CLL patients in initial and validation series. Samples sizes are: MCL initial series, n=32; MCL validation series, n=56; CLL cohort 1, n=109 and CLL cohort 2, n=178 patients. Shaded area represents 95% confidence intervals. Pearson correlation and derived p-values are also shown. c, Pearson correlations and Passing Bablock regression fits for gold-standard methods for tumor purity predictions (FCM and genetic-based) against DNA methylation-based tumor purity predictions in MM and DLBCL patients. Sample sizes are: MM, n=100 and DLBCL, n=55 patients and are the same as in panel d. Shaded area represents 95% confidence intervals. Pearson correlation and derived p-values are also shown. d, Pan-B cell DNA methylation signature used to deconvolute DNA methylation data and obtain B-cell tumor purities in B-cell tumors. The DNA methylation levels for the Pan-B-cell DNA methylation signature is shown for microenvironmental cells as well as MM and DLBCL. Bar plots representing DNA-methylation based predictions as well as gold standard-based predictions for MM and DLBCL are represented on the top of the heatmaps. e, Chromatin state genome segmentation with the CHMM software using the 6 histone marks used in the whole study for normal B cells, MCL, CLL and MM primary cases as well as for KARPAS-422 and SUDHL-5 DLBCL cells lines. f, Genomic distribution of stably methylated and unmethylated CpGs in normal and neoplastic B cell. Barplots represent single data values. g, Example gene showing stably unmethylated CpGs at promoters and stably methylated CpGs at gene body in normal and neoplastic B cells. A total of 98 CpGs are shown. h, Gene ontology analysis of genes showing both stably methylated and stably unmethylated CpGs in normal and neoplastic B cells.
Extended Data Fig. 2
Extended Data Fig. 2. Characterization of tumor-specific DNA methylation signatures
a, First 9 components of a Principal Component Analysis for normal and neoplastic B cells. Samples sizes are the same as in Fig. 1a. The same sample size applies also for panel b, c and d. Center line, box limits, whiskers and points represent the median, 25th and 75th percentiles, 1.5× interquartile range and individual samples, respectively. b, Percentages of de novo DNA methylation signatures over the total DNA methylome. All de novo hyper- and hypomethylation from the five B-cell tumors analyzed are considered together to derive each respective percentage. c, Heatmap showing B-cell tumor-specific hypermethylation and the number of CpGs located at active regulatory regions (marked by H3K27ac). To calculate CpG enrichments in regulatory regions, the number of CpGs falling in regulatory regions were compared with the same number of de novo CpGs 10,100 times randomly chosen from the DNA methylome fraction with potential tumor-specific signatures falling in regulatory regions. d, Distribution of mean methylation levels of CpGs from de novo B-cell tumor-specific DNA methylation signatures across all normal and neoplastic B cell samples subtypes. The number of samples used to calculate the means is shown in Fig. 1a and the number of CpGs analyzed are those from Fig. 2b. e, Genomic distribution for de novo DNA methylation changes in B-cell tumors. Barplots represent single data values. f, Gene expression percentile of TFs showing the most significant p-values and frequencies for TFs binding site predictions (Methods) in de novo hypomethylation signatures in each B-cell tumor from Fig. 2d. Sample sizes for gene expression analyses in tumor samples are the same than in Fig. 4e.
Extended Data Fig. 3
Extended Data Fig. 3. DNA methylation levels and analysis of the sensitivity of the epigenetic classifier of B cell neoplasms.
a, DNA methylation levels of all CpGs from the pan-B-cell diagnostic algorithm in normal and neoplastic B cells. Sample sizes are the training samples shown in Fig. 3b. b, Estimated sensitivity according to the number of CpGs used in the pan-B-cell diagnostic algorithm for the classification of an unknown B-cell tumor into ALL, MCL, CLL, DLBCL or MM (first step of Fig. 3a, predictor 1). The number of CpGs selected for the predictor was chosen by maximizing the highest balanced accuracy and is indicated with a red circle. This strategy was applied also in the remaining 4 predictors to classify B-cell tumor subtypes in panels c, d, e, and f, (second step of Fig. 3a). Each B-cell tumor is represented with different shapes and colors. c, Estimated sensitivity according to the number of CpGs used in the pan-B-cell diagnostic algorithm (predictor 2 of Fig. 3a) for the classification of ALL into the subtypes HeH, 11q23/MLL, t(12;21), t(1;19), t(9;22) and dic(9;20) while incrementing the number of CpGs (predictor 2 in Fig. 3a). d, Estimated sensitivity according to the number of CpGs used in the pan-B-cell diagnostic algorithm (predictor 3 of Fig. 3a) for the classification of MCL into the subtypes C1 or C2 while incrementing the number of CpGs (predictor 3 in Fig. 3a). e, Estimated sensitivity according to the number of CpGs used in the pan-B-cell diagnostic algorithm for the classification of CLL into the subtypes n-CLL, i-CLL or m-CLL while incrementing the number of CpGs (predictor 4 in Fig. 3a). f, Estimated sensitivity according to the number of CpGs used in the pan-B-cell diagnostic algorithm for the classification of DLBCL into the subtypes ABC and GCB while incrementing the number of CpGs (predictor 5 in Fig. 3a).
Extended Data Fig. 4
Extended Data Fig. 4. Further characterization of patient-specific DNA methylation changes
a, Variability of DNA methylation changes measured by the interquartile range (IQR) in normal and neoplastic B cells against the median number of DNA methylation changes per each subtype. R and p-values were derived from linear modelling. Shaded area represents 95% confidence interval. b, Correlations in all B cell tumors between B-cell independent DNA methylation changes and B-cell related changes for hypermethylation (top) and hypomethylation (bottom) changes. R and p-values were derived from linear models. c, Number of B-cell related or B-cell independent hyperor hypomethylation in B-cell tumors showing consistent patterns (Methods). d, B-cell independent CpGs losing DNA methylation in B-cell tumors and the percentages of each chromatin state in normal and neoplastic B-cells. The mean of percentages per sample type is shown. The sample sizes are the same as in Fig. 4c and also apply for panel g. e , The mean of 2,000 representative CpGs per each sample subtype from panel d is represented. f, Gene density distributed along the expression percentiles of genes associated with B-cell independent CpGs losing DNA methylation at low signal heterochromatin in B-cell tumors. Expressed genes (H3K36me3) are displayed at right as control. Means within each B-cell subpopulation as well as B-cell tumors are represented. g, B-cell independent CpGs gaining DNA methylation in B-cell tumors and the percentages in each chromatin state in normal and neoplastic B-cells. h , The mean of 2,000 representative CpGs per each sample subtype from panel g is represented. i, Gene density distributed along the expression percentiles of genes associated with B-cell independent CpGs gaining DNA methylation at H3K27me3 regions in B-cell tumors. Expressed genes (H3K36me3) are displayed at right as control. Means within each B-cell subpopulation as well as B-cell tumors are represented. Sample size for DNA methylation analyzes in panels a, b, c, e and h are the same as in Fig. 4a. Samples sizes for gene expression analyses in panels f and i are the same as in Fig. 4e.
Extended Data Fig. 5
Extended Data Fig. 5. Additional analyses performed to validate the epiCMIT
a, Illustrative scheme showing DNA methylation changes upon cell division and how they relate to epiCMIT scores. b, In vitro B-cell differentiation model used to experimentally validate the epiCMIT score. Primary naïve B cells are differentiated into plasma cells in 6 days. At day 0, primary human B cells are incubated with Carboxyfluorescein succinimidyl ester (CFSE) and harvested with activation and proliferation cocktails necessary for plasma cell differentiation. The epiCMIT was calculated at day 0, day 4 and day 6 in B cells with different proliferative histories based on CFSE dilution. c, The epiCMIT is correlated with total number of mutations detected by WGS in each CLL epigenetic subtype. R and p-values are derived from linear modelling. 138 CLL patient samples with WGS and DNA methylation data are shown (66 n-CLL, 18 i-CLL and 54 m-CLL). The same sample size applies for panel e, f and g. d, The epiCMIT is correlated with CLL genomic complexity measured by the total number of driver alterations and thus with mutations with positive selection. Fitted linear regression models and derived R and p-values are shown for each group. The sample size for each number of driver alterations are: 0 drivers: n-CLL, n=2, i-CLL, n=5, m-CLL, n=44; 1 driver: n-CLL, n=14, i-CLL, n=19, m-CLL, n=119; 2 drivers: n-CLL, n=37, i-CLL, n=25, m-CLL, n= 55; 3 drivers: n-CLL, n=38, i-CLL, n= 12, m-CLL, n=28; 4 drivers: n-CLL, n=27, i-CLL, n=4, m-CLL, n=12; 5 drivers: n-CLL, n=23, i-CLL, n=2, m-CLL, n=2; 6 drivers: n-CLL, n=10, i-CLL, n=0, m-CLL, n=0; 7 drivers: n-CLL, n=7, i-CLL, n=2, m-CLL, n=0; 8 drivers: n-CLL, n=1; 9 drivers: n-CLL, n=1; 10 drivers: n-CLL, n=1. For the box plots, center line, box limits, whiskers and points represent the median, 25th and 75th percentiles, 1.5× interquartile range and individual samples, respectively. e, Mutational signatures found in CLL with available WGS. CLL subtypes are shown separately. f, The epiCMIT is correlated with the mitotic-like mutational signature SBS1. CLL samples are divided in CLL epigenetic subgroups. R and p-values are derived from linear models. g, The epiCMIT is correlated with the mitotic-like mutational signatures SBS9. CLL samples are separated with the classical IGHV mutational status (98%). R and p-values are shown for each respective linear model. h, epiCMIT-hyper CpGs and epiCMIT-hypo mitotic clocks are compared with other hyper- or hypomethylation based mitotic clocks as well as the total number of hyper- (rightmost top) or hypomethylation (rightmost bottom) changes per sample since HPC stage. R from linear models are shown. Samples sizes are the same as in Fig. 4a. i, Overlap among the CpG used to build each mitotic clock. Barplots represent single data values. j, Performance of all mitotic clocks in the in vitro B-cell differentiation model from panel c. The fraction of epiCMIT which gain methylation (epiCMIT-hyper) and the fraction that lose DNA methylation (epiCMIT-hypo) were analyzed together with hyper- and hypomethylation-based mitotic clocks, respectively. Biological independent sample sizes are the same as in Fig. 5e. P-values are derived from two-sided t-tests and from biological independent experiments. On the right, expression of genes containing any CpG of each respective mitotic clock as well as genes containing CpGs in H3K36me3 regions are depicted (n=14,598). The number of genes analyzed per each mitotic clock are: epiCMIT-hyper, n=155; epiTOC, n=412; MiAge, n=298; CIMP, n=102; epiCMIT-hypo, n1,123; PMDsoloWCGW, n=4053. For the box plot, center line, box limits, whiskers and points represent the median, 25th and 75th percentiles, 1.5x interquartile range and individual samples, respectively.
Extended Data Fig. 6
Extended Data Fig. 6. Comparison between the epiCMIT mitotic clock and the Horvath aging clock
a, Correlations among epiCMIT, age and Horvath-predicted age in normal and neoplastic B cells. Samples sizes are: NBC, n=10 and MBC, n=9 donors; C1 MCL, n=40; C2 MCL, n=17; n-CLL, n=159; i-CLL, n=69; m-CLL, n=260; GCB DLBCL, n=20 and ABC DLBCL, n=28 patients. R and p-value are derived from linear models. Shaded areas represent 95% confidence intervals. b, epiCMIT and Horvath clocks do not have any CpG in common. CpGs of the Horvath model are divided into positively associated with age (gain of methylation) and negatively associated with age (loss of methylation). In addition, they are further classified into B-cell related or B-cell independent if they are extensively modulated or not during normal B-cell differentiation. Barplots represent single data values. c, The CpGs used to build the epiCMIT and Horvath clock show distinct genomic locations. Barplots represent single data values. d, DNA methylation levels of the CpGs from the epiCMIT and Horvath clocks in normal and neoplastic B cells. Sample sizes are the same as in Fig. 4a. e, The CpGs associated with the epiCMIT and Horvath clocks are located in markedly different chromatin states. Sample sizes are the same as in Fig. 4c. f, Genes associated with epiCMIT and Horvath CpGs show distinct transcriptional states in normal and neoplastic B cells. Gene probes shared across all normalized matrices from normal and neoplastic B cells were retained and were the following: epiCMIT-hyper, n=60; epiCMIT-hypo, n=327; Age positive B-cell related, n=44; Age positive B-cell independent, n=118; Age negative B-cell related, n=49; Age negative B-cell independent, n=101. For the box plot, center line, box limits, whiskers and points represent the median, 25th and 75th percentiles, 1.5x interquartile range and individual samples, respectively. Sample size are the same as in Fig. 4e.
Extended Data Fig. 7
Extended Data Fig. 7. Additional characterization of the clinical impact of the epiCMIT in B cell tumors
a, Kaplan-Meier curves for relapse-free survival in ALL patients with low or high epiCMIT according to the maxstat rank statistics-based cutoff. Hazard ratio and p-value for the univariate Cox regression model are shown. A multivariate Cox regression model with epiCMIT as continuous variable and ALL cytogenetic groups is shown on the right. Hazard ratio for epiCMIT correspond to 0.1 increments. b, epiCMIT preserves its prognostic value in multivariate Cox regressions for time to first treatment in CLL patients whose samples were acquired at maximum 30 months after diagnosis both in initial and validation series. c, epiCMIT shows independent prognostic value from major prognostic variables in CLL including IGHV mutational status and TP53 alterations (deletions and mutations) in multivariate Cox regressions for time to first treatment (TTT). d, Multivariate cox regression models in initial and validation CLL series for overall survival with epiCMIT and important prognostic variables. e, Kaplan-Meier curves for overall survival in GCB and ABC DLBCL patients with low or high epiCMIT according to the maxstat rank statistics-based cutoff. A multivariate Cox regression model with epiCMIT as continuous variable, the DLBCL subtype and age is shown on the right. Hazard ratio for epiCMIT correspond to 0.1 increments. On the right, univariate cox regression model for all mitotic clocks.
Extended Data Fig. 8
Extended Data Fig. 8. Clinical impact of the epiCMIT as compared to other mitotic clocks
a, On the left, epiCMIT and hypermethylation-based mitotic clocks are highly correlated in ALL, creating a collinearity phenomenon in multivariate cox regression models with multiple mitotic clocks. On the right, multivariate Cox regression models with epiCMIT and PMDsoloWCGW mitotic clocks and ALL cytogenetic subgroups for overall survival, relapse-free survival and overall survival after relapse. b, In CLL, epiCMIT shows superior prognostic value in multivariate cox models for time to first treatment than all the other mitotic clocks in both initial and validation series. c, In MCL, epiCMIT shows an overall superior prognostic value in multivariate cox models for overall survival in both initial series (with C1 and C2 MCL subtypes) and in the validation series, which only contain C1 MCL subtypes. In the initial series, MCL subtypes with different cellular origin were not introduced in multivariate Cox regression models due to few events, and thus the epiCMIT of each MCL patient was centered according to its cellular origin (C1 or C2) to account for normal B-cell development epiCMIT (Fig. 6a).
Extended Data Fig. 9
Extended Data Fig. 9. Additional data regarding the link between the epiCMIT and genetic changes in CLL
a, Oncoprint showing all genetic driver alterations considered in the whole CLL initial series composed by 490 CLL patient samples grouped by epigenetic subtypes and ordered according to increasing levels of epiCMIT (from left to right within each epigenetic subgroup). Other clinico-biological features including MBL or CLL, IGHV status, Age, Binet stage, epiCMIT subgroups based on maxstat rank statistic, need for treatment and patient status are shown. Distinct genetic driver alterations are depicted with different colors and shapes. The percentage of mutated patients and number of mutated patients for each alteration is shown at right. b, Driver genetic alterations without clear associations with epiCMIT. Analyses were done in the whole cohort as well as within each epigenetic subgroup. Point estimates with 95% confidence intervals were derived in the whole cohort using linear modelling between epiCMIT and alterations adjusted for CLL subtypes, and with two-sided t-tests within CLL subtypes. Point estimates then represent the coefficient of each respective alteration in each corresponding linear model (whole cohort analysis) or the difference between means (CLL subtypes analysis). Point estimates are color-coded according to FDR correction. Treated and untreated patients at the moment of sampling were considered for these analyses.
Fig. 1 |
Fig. 1 |. Experimental design and characterization of stably methylated regions.
a, Experimental design, including normal B cell subpopulations, B cell tumors under study, source of the samples and number of patient samples included in the study with tumor cell content greater than 60%. HPC, hematopoietic precursor cells; pre-B, precursor B-cell and immature B cells; NBC, naïve B cells; GC, germinal center B cells; MBC, memory B cells; tPC, tonsillar plasma cells; bmPC, bone-marrow plasma cells; ALL, acute lymphoblastic leukemia; MCL, mantle cell lymphoma; CLL, chronic lymphocytic leukemia; DLBCL, Diffuse large B cell lymphoma; MM, multiple myeloma; BM, bone marrow; PB, peripheral blood; LN, lymph node. b, Different levels of DNA methylation variability addressed in the study. c, Percentage of CpGs whose methylation is stable in normal and neoplastic B cells, or modulated in normal B cells. Percentages are calculated over the total number of CpGs analyzed. d, Heatmaps showing stably methylated CpGs (top) and stably demethylated CpGs (bottom) in normal and neoplastic B cell. e, Chromatin state enrichments for stably un/methylated CpGs in normal and neoplastic B cells. All CpGs analyzed were used as background. ActProm, Active promoter; WkProm, Weak promoter; StrEnh1, Strong enhancer 1 (promoter-related); StrEnh2, Strong enhancer 2; WkEnh, Weak enhancer; TxnTrans, Transcription transition; TxnElong, Transcription elongation; WkTxn, Weak transcription; PoisProm, Poised promoter; H3K27me3, Polycomb-repressed region; H3K9me3, H3K9me3 heterochromatin; Het;LowSign, Het;LowSign heterochtomatin. f, Overlap between the target genes of the stably methylated and unmethylated CpGs. g, Gene expression percentiles in normal and neoplastic B cells of genes showing stable hyper- and hypomethylation.
Fig. 2 |
Fig. 2 |. Disease-specific DNA methylation signatures.
a, Principal component analysis of normal and neoplastic B-cells. Sample sizes are the same as in Fig. 1a. b, Number of de novo DNA methylation changes in each B-cell tumor entity. Percentages are calculated over the total of 437,182 CpG analyzed. Barplots represent single data values. c, Heatmap showing de novo B-cell tumor-specific hypomethylation and the number of CpGs falling at active regulatory regions marked by H3K27ac. d, Enrichment of binding sites of transcription factors expressed in B-cell tumors and in regions with de novo hypomethylated CpGs located in active regulatory elements from c. e, Differential gene expression percentiles for genes showing B-cell tumor-specific hypomethylation in active regulatory regions.
Fig. 3 |
Fig. 3 |. Development and validation of a DNA methylation-based diagnostic classifier of different subtypes of B cell neoplasms.
a Heatmap showing DNA methylation values of the CpGs used for the two-step pan B-cell cancer classifier. The training samples from b are represented. b, Accuracy for the pan-B-cell cancer diagnostic classifier composed by the 5 predictors in panel a in both training and validation series. Sensitivity is represented as black circles or triangles for training or validation series, respectively. The percentage of cases without a clear prediction (unclassified) is represented in grey. The total number of samples used for both training and validation is shown at bottom.
Fig. 4 |
Fig. 4 |. Identification and characterization of patient-specific DNA methylation changes.
a, Number of DNA methylation changes in individual patients for normal and neoplastic B cells as compared to the hematopoietic precursor cell stage. Total number of DNA methylation changes, hypomethylation changes and hypermethylation changes are depicted at outer, middle and inner tracks, respectively. Changes are further classified and color-coded as B-cell related or B-cell independent. Sample sizes are: HPC, n=6; pre-B cells, n= 16; NBC, n=15; GC, n=9; tPC, n=8; MBC, n=10 and bmPC, n=3 donors; HeH ALL, n=168; 11q23/MLL ALL, n=26; t(12;21) ALL, n=152; t(1;19) ALL, n=22; t(9;22) ALL, n=18; dic(9;20) ALL, n=17; C1 MCL, n=56; C2 MCL, n=18; n-CLL, n=161; i-CLL, n=69; m-CLL, n=260; GCB DLBCL, n=19; ABC DLBCL, n= 27; UC DLBCL, n=5 and MM, n=100 patients. The same sample size is applied to panels b, d and g. b, Correlation between B-cell related changes and B-cell independent changes in normal and neoplastic B-cells. R derived from linear models are shown. c, B-cell related CpGs losing DNA methylation in B-cell tumors and the percentages in each chromatin state in normal and neoplastic B-cells. The mean of percentages per sample type is shown. Sample sizes are: NBC, n=6; GC, n=3; MBC, n=3 and tPC, n=3 donors; MCL, n=5; CLL, n=7 and MM, n=4 patients. The same sample size applies for panel f. d, The mean of 2,000 representative CpGs per each sample subtype from panel c is represented. e, Gene density distributed along the expression percentiles of genes associated with B-cell related CpGs losing DNA methylation in B-cell tumors at low signal heterochromatin. Expressed genes showing the H3K36me3 mark are displayed at right as a positive control. The mean for each sample type is represented. Lines represent 0, 25, 50, 75 and 100% percentiles. f, B-cell related CpGs gaining DNA methylation in B-cell tumors and the percentages in each chromatin state in normal and neoplastic B-cells. The mean of percentages per sample type is shown. g, The mean of 2,000 representative CpGs per each sample subtype from panel f is represented. h, Gene density distributed along the expression percentiles of genes associated with B-cell related CpGs gaining DNA methylation in B-cell tumors in regions containing the H3K27me3 mark. Expressed genes with the H3K36me3 mark are displayed at right as a positive control. Means within each B-cell subpopulation as well as B-cell tumors are represented. Sample subtypes from panels d, e, g and h are color-coded as in panel b. Sample sizes for gene expression analyses in panels e and h are: HPC, n=3; pre-B cells, n=7; NBC, n=10; GC, n=11 tPC, n=5 donors; MBC, n=5 and bmPC, n=1 donors; HeH ALL, n=18; 11q23/MLL ALL, n=5, t(12;21) ALL, n=16, t(1;19) ALL, n=6, t(9;22) ALL, n=5, dic(9;20) ALL, n=6; C1 MCL, n=10; C2 MCL, n=5; n-CLL, n=142, i-CLL, n=64; m-CLL, n=249; GCB DLBCL, n=17, UC DLBCL, n=11, ABC DLBCL, n=15 and MM=328 patients.
Fig. 5 |
Fig. 5 |. Development and validation of the epiCMIT.
a, Steps to construct the epiCMIT-hyper, epiCMIT-hypo and epiCMIT mitotic clocks. epiCMIT, epigenetically-determined Cumulative MIToses. b, CpGs constituting the epiCMIT-hyper (184 CpGs) and epiCMIT-hypo (1,164 CpGs) mitotic clocks. c, Correlation between the epiCMIT-hyper and the epiCMIT-hypo in normal and neoplastic B cells. R and p-values are derived from linear models. d, Box plot showing the distribution of epiCMIT values in normal and neoplastic B cells. Center line, box limits, whiskers and points represent the median, 25th and 75th percentiles, 1.5x interquartile range and individual samples, respectively. e, Experimental validation of epiCMIT score with an in vitro B-cell differentiation model of primary human naïve B cells into plasma cells. The epiCMIT was calculated at day 0, day 4 and day 6 in B cells with distinct proliferative histories based on CFSE dilution. Sample sizes are: NBC-PB, n=5; CFSE-high at day 4, n=6; CFSE-low at day 4, n=3; P3 cells at day 6, n=3; P2 cells at day 6, n=3 and P1 cells at day 6, n=8. Each dot within each category is derived from a different donor, and thus represent biologically independent samples. P-values are derived from two-sided t-tests. On the right, gene expression of genes containing CpGs belonging to epiCMIT. The number of genes containing epiCMIT genes analyzed is n=1,278, and genes with CpGs mapping at H3K36me3 are n=14,598. For the box plots, center line, box limits, whiskers and points represent the median, 25th and 75th percentiles, 1.5x interquartile range and individual samples, respectively. f, piCMIT correlates with the mitotic-like mutational signature SBS5 in CLL. R and p-values are derived from linear models. 138 CLL patients with WGS and DNA methylation data are shown. Sample sizes for CLL subtypes are: n-CLL, n=66; i-CLL, n=18 and m-CLL, n=54 patients. g, epiCMIT is associated with high Ki67 staining in C1 MCL cases. Number of cases are n=8 and n=12 for high and intermediate Ki67 values. Two-sided t-test was used to assess statistical significance. For the box plot, center line, box limits, whiskers and points represent the median, 25th and 75th percentiles, 1.5x interquartile range and individual samples, respectively. h, Gene set enrichment analysis (GSEA) showing that epiCMIT is associated with gene expression signatures related to cell proliferation and MYC activity in CLL. 142 n-CLL were analyzed, and 22 n-CLL samples with low and high epiCMIT are shown (15 and 85% percentiles, respectively). At top, z-score for each gene is represented. At bottom, some representative gene expression signatures enrichments are shown. i, Correlation between the epiCMIT and previously reported mitotic clocks, including epiTOC, MiAge and PMDsoloWCGW, the pan-cancer CIMP, and the total number of DNA methylation changes accumulated since HPC stage in each patient. R’s correspond to linear regression models. The same sample for panels b, c, d and i are the same than in Fig. 4a.
Fig. 6 |
Fig. 6 |. Clinical impact of the epiCMIT is B-cell tumors.
a, The epiCMIT in neoplastic B cells include the proliferative history associated with normal B-cell development and with malignant transformation and progression (blue and red components of the epiCMIT bar, respectively). B-cell tumors derive from different maturation stages, and thus they contain different normal B-cell baseline epiCMIT. Most of the B-cell related DNA methylation changes occurring in B-cell tumors relate to cell division. b, epiCMIT evolves during disease progression. epiCMIT is lower in precursor conditions such as MGUS (n=13 patients) and MBL (n=53 patients) as compared to their respective cancer conditions CLL (n=437 patients) and MM (n=100 patients), as well as in paired CLL samples from diagnosis to progression (n=9 patients), and trios of ALL patients at diagnosis and first relapse (n=23 patients) and second relapse (n=5 patients). P-values were obtained from two-sided t-test, and paired t-test in the case of paired samples. For the box plots, center line, box limits, whiskers and points represent the median, 25th and 75th percentiles, 1.5x interquartile range and individual samples, respectively. c, d Kaplan-Meier curves for c overall survival (OS) and d OS after relapse in ALL patients with low or high epiCMIT according to the maxstat rank statistics-based cutoff. Hazard ratio and p-value for the univariate Cox regression models are shown on the left panels. Multivariate Cox regression models with epiCMIT as continuous variable and ALL cytogenetic groups are shown on the right. Hazard ratio for epiCMIT correspond to 0.1 increments, and also in panels e, f g and h. e,, Kaplan-Meier curves for CLL epigenetic groups based on different cellular origin divided in low and high epiCMIT according to the maxstat rank statistics-based cutoff. A multivariate Cox regression model for time to first treatment with epiCMIT as continue variable together with age, number of driver alterations and epigenetic groups based on different cellular origin is shown on the right. The results obtained with the independent validation series is shown in panel f. g, Kaplan-Meier curves for MCL epigenetic groups based on different cellular origin divided in low and high epiCMIT according to the maxstat rank statistics-based cutoff. A multivariate Cox regression model for OS with epiCMIT as continuous variable together with epigenetic groups and age is shown on the right. Validation series for C1 MCL is shown in panel h.
Fig. 7 |
Fig. 7 |. Association between the epiCMIT and genetic driver alterations in CLL.
a, Illustrative scheme to represent which potential genetic driver alterations may confer a higher proliferative capacity to CLL cells. b, Analysis of the association between the epiCMIT levels and the presence of specific driver genes grouped by signaling pathways. Point estimates with 95% confidence intervals were derived in the whole cohort using linear modelling between epiCMIT and alterations adjusted for CLL subtypes, and with two-sided t-tests within CLL subtypes. Point estimates represent the coefficient of each respective alteration in each corresponding linear model in whole cohort analysis, and the difference between the mean of CLL patients with and without each corresponding alteration for the analysis within each CLL subtypes. Point estimates are color-coded according to FDR correction. The Oncoprint shows genetic driver alterations significantly associated with higher epiCMIT with CLL epigenetic groups shown separately. Other clinicobiological features including MBL or CLL, IGHV status, Age, Binet stage, epiCMIT subgroups based on maxstat rank statistic cutoff, need for treatment and patient status are shown. Cases are ordered within each CLL subgroup from lower to higher epiCMIT values. Genetic driver alterations are depicted with different colors and shapes depending of the alteration type. Number of mutated patients as well as their percentage over the whole cohort is shown on the right. The whole CLL initial series was used for these analyses and is represented (n=490 patients).

Comment in

  • A ticking clock for B cell tumors.
    Strati P, Green MR. Strati P, et al. Nat Cancer. 2020 Nov;1(11):1035-1037. doi: 10.1038/s43018-020-00132-1. Nat Cancer. 2020. PMID: 35122068 No abstract available.

Similar articles

Cited by

References

    1. Roy N & Hebrok M Regulation of Cellular Identity in Cancer. Dev. Cell 35, 674–84 (2015). - PMC - PubMed
    1. Hoadley KA et al. Cell-of-Origin Patterns Dominate the Molecular Classification of 10,000 Tumors from 33 Types of Cancer. Cell 173, 291–304.e6 (2018). - PMC - PubMed
    1. Swerdlow SH, Campo E, Harris NL, Jaffe ES, Pileri SA, Stein H, J. T WHO Classification of Tumours of Haematopoietic and Lymphoid Tissues. (International Agency for Research on Cancer (IARC), 2017).
    1. Luo C, Hajkova P & Ecker JR Dynamic DNA methylation: In the right place at the right time. Science 361, 1336–1340 (2018). - PMC - PubMed
    1. Kulis M et al. Whole-genome fingerprint of the DNA methylome during human B cell differentiation. Nat. Genet 47, 746–756 (2015). - PMC - PubMed

METHODS REFERENCES

    1. Reinius LE et al. Differential DNA methylation in purified human blood cells: implications for cell lineage and studies on disease susceptibility. PLoS One 7, e41361 (2012). - PMC - PubMed
    1. Vento-Tormo R et al. IL-4 orchestrates STAT6-mediated DNA demethylation leading to dendritic cell differentiation. Genome Biol. 17, 4 (2016). - PMC - PubMed
    1. Brönneke S et al. DNA methylation regulates lineage-specifying genes in primary lymphatic and blood endothelial cells. Angiogenesis 15, 317–329 (2012). - PubMed
    1. Aryee MJ et al. Minfi: a flexible and comprehensive Bioconductor package for the analysis of Infinium DNA methylation microarrays. Bioinformatics 30,1363–9 (2014). - PMC - PubMed
    1. Maksimovic J, Gordon L & Oshlack A SWAN: Subset-quantile within array normalization for illumina infinium HumanMethylation450 BeadChips. Genome Biol. 13, R44 (2012). - PMC - PubMed

Publication types