. 2021 Jun 2;16(1):82.
doi: 10.1007/s11657-020-00871-9.

SCOPE 2021: a new scorecard for osteoporosis in Europe

Affiliations

SCOPE 2021: a new scorecard for osteoporosis in Europe

John A Kanis et al. Arch Osteoporos. .

Abstract

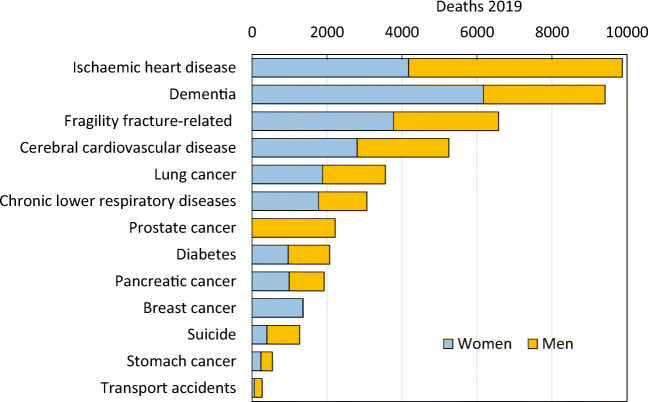
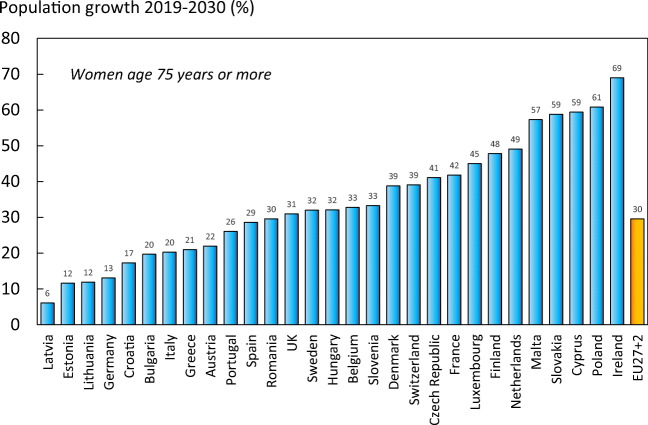
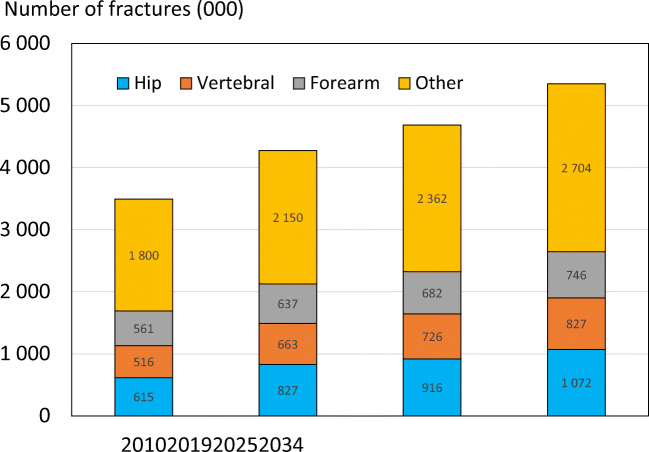
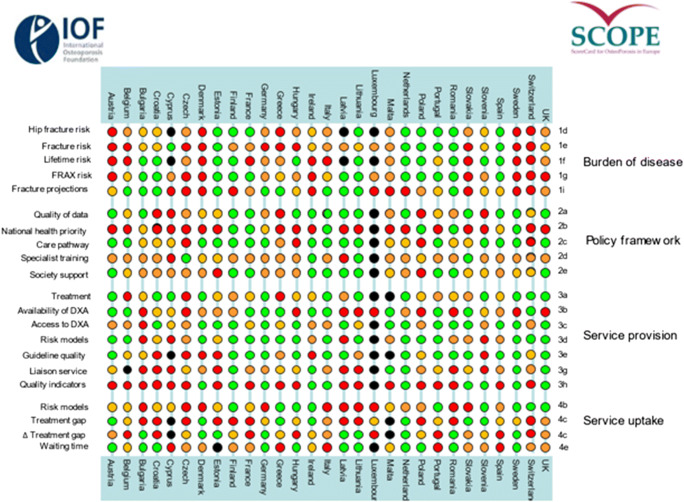
This scorecard summarises key indicators of the burden of osteoporosis and its management in the 27 member states of the European Union, as well as the UK and Switzerland. The resulting scorecard elements, assembled on a single sheet, provide a unique overview of osteoporosis in Europe.

Introduction: The scorecard for osteoporosis in Europe (SCOPE) is a project of the International Osteoporosis Foundation (IOF) that seeks to raise awareness of osteoporosis care in Europe. The aim of this project was to develop a scorecard and background documents to draw attention to gaps and inequalities in the provision of primary and secondary prevention of fractures due to osteoporosis.

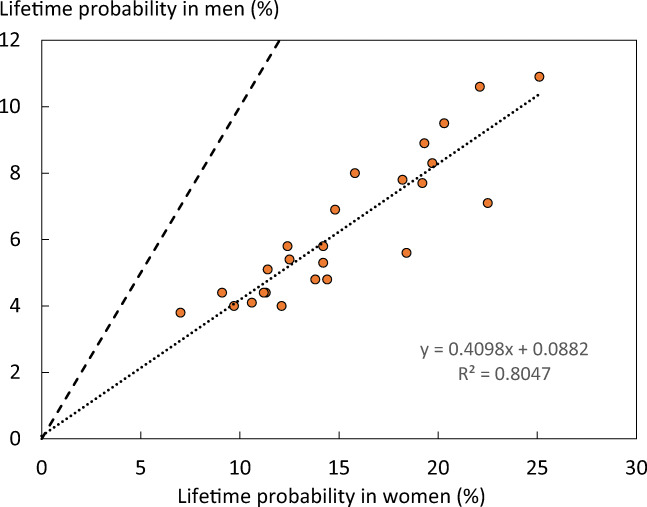
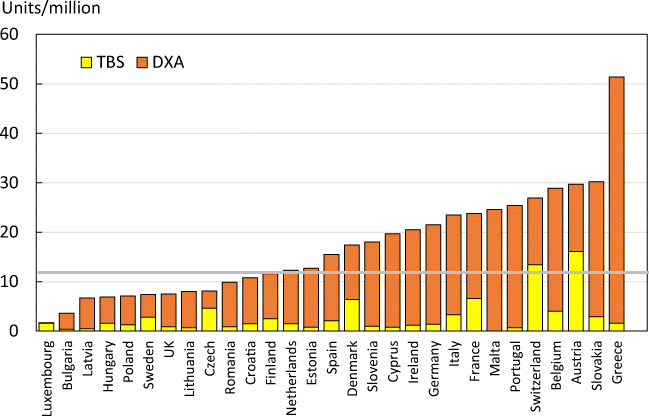
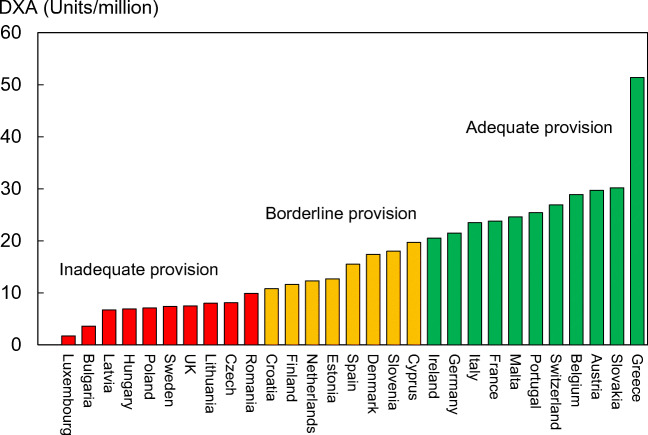
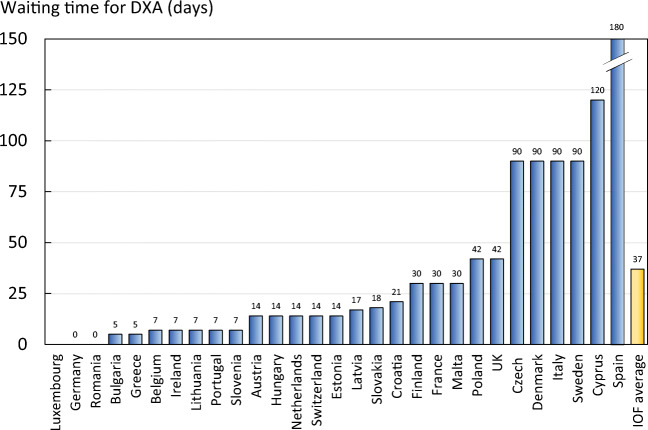
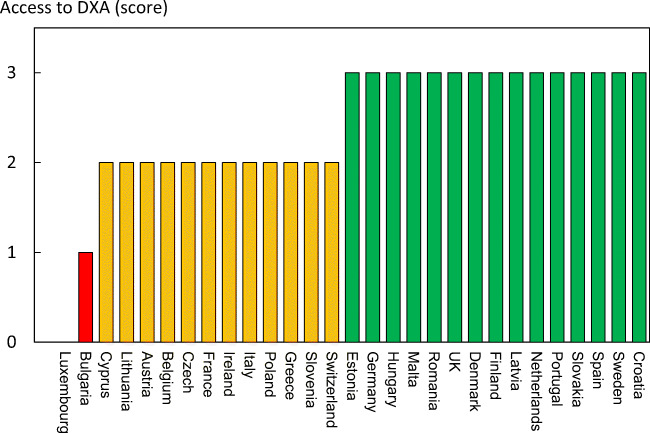
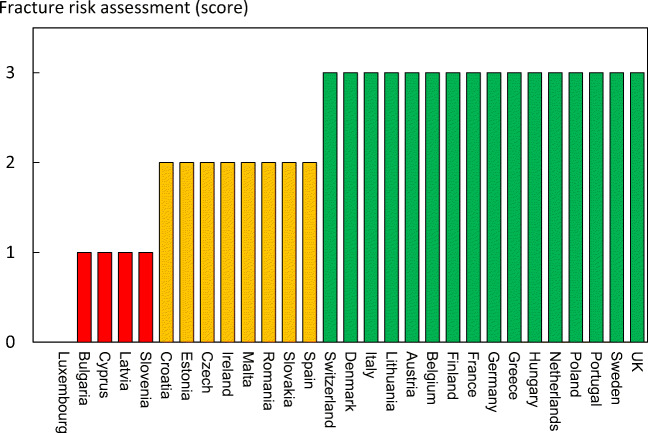
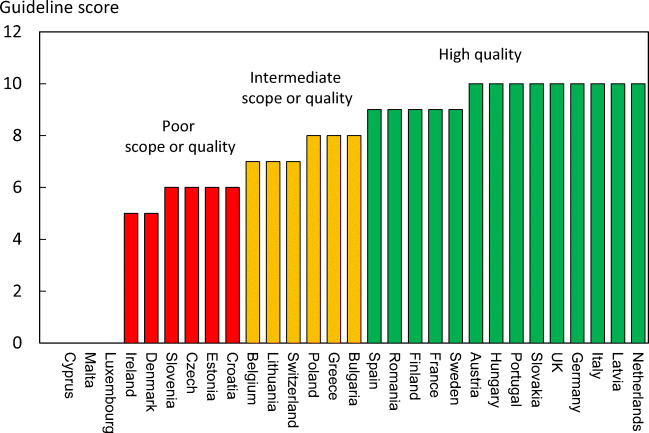
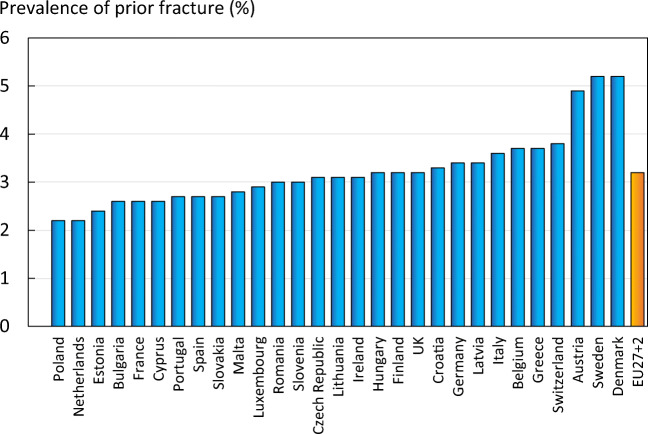
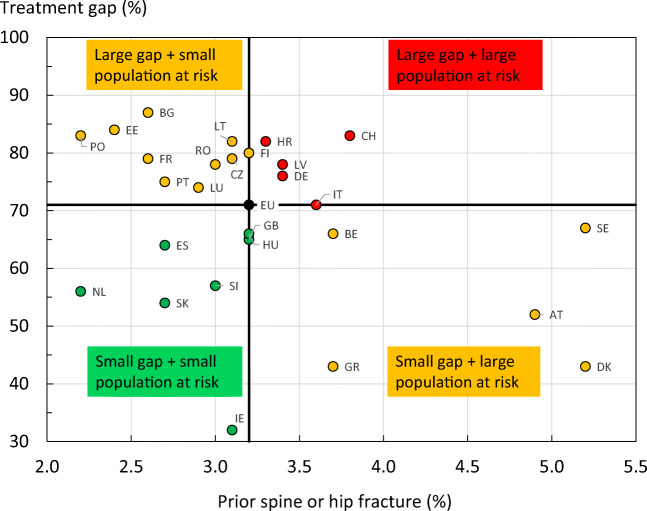
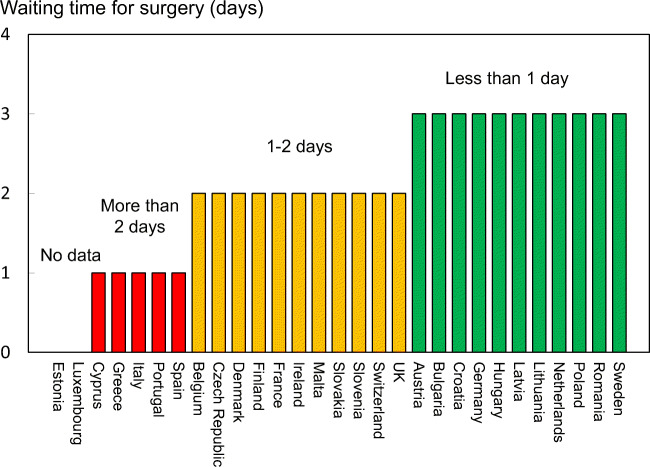
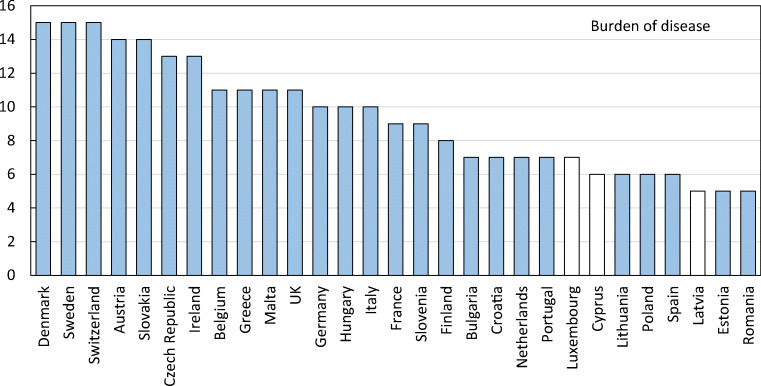
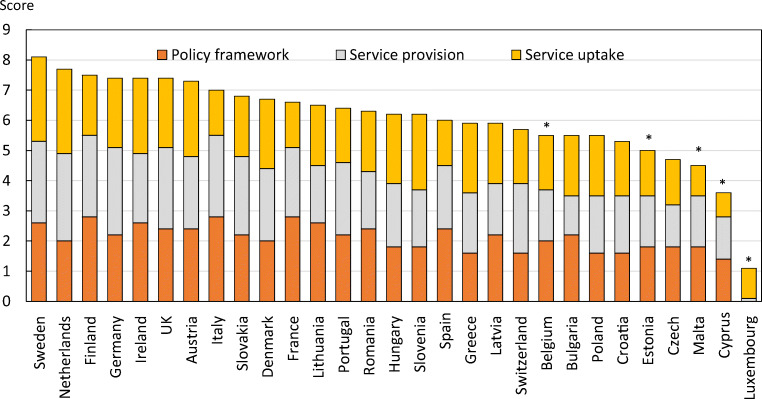
Methods: The SCOPE panel reviewed the information available on osteoporosis and the resulting fractures for each of the 27 countries of the European Union plus the UK and Switzerland (termed EU27+2). The information obtained covered four domains: background information (e.g. the burden of osteoporosis and fractures), policy framework, service provision and service uptake, e.g. the proportion of men and women at high risk that do not receive treatment (the treatment gap).

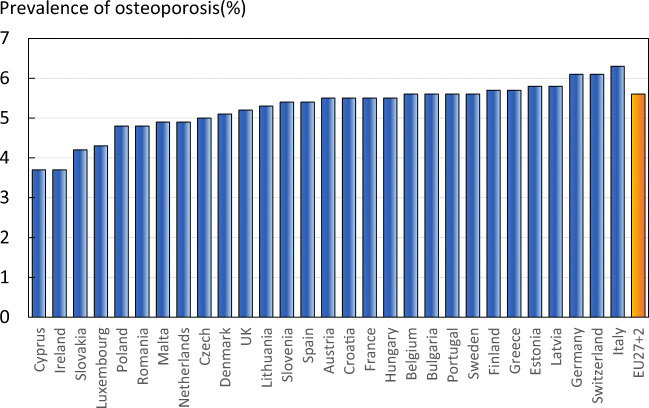
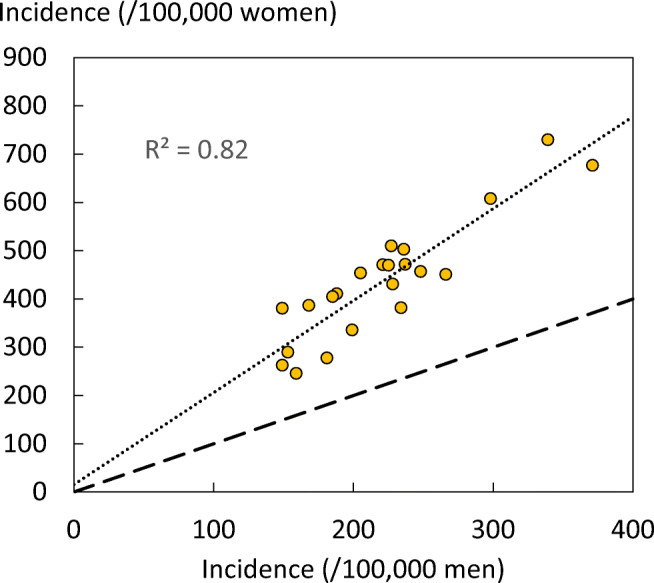
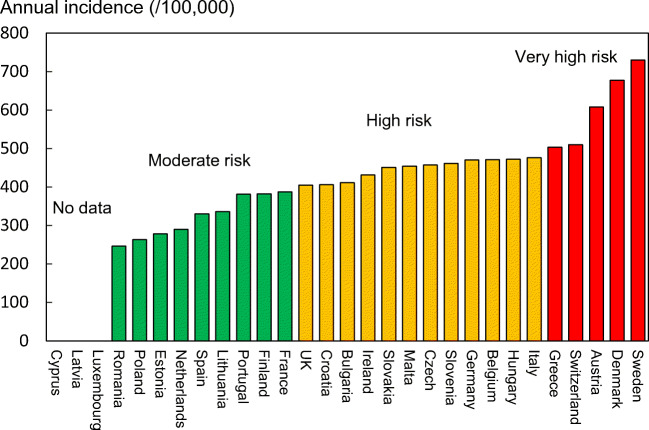
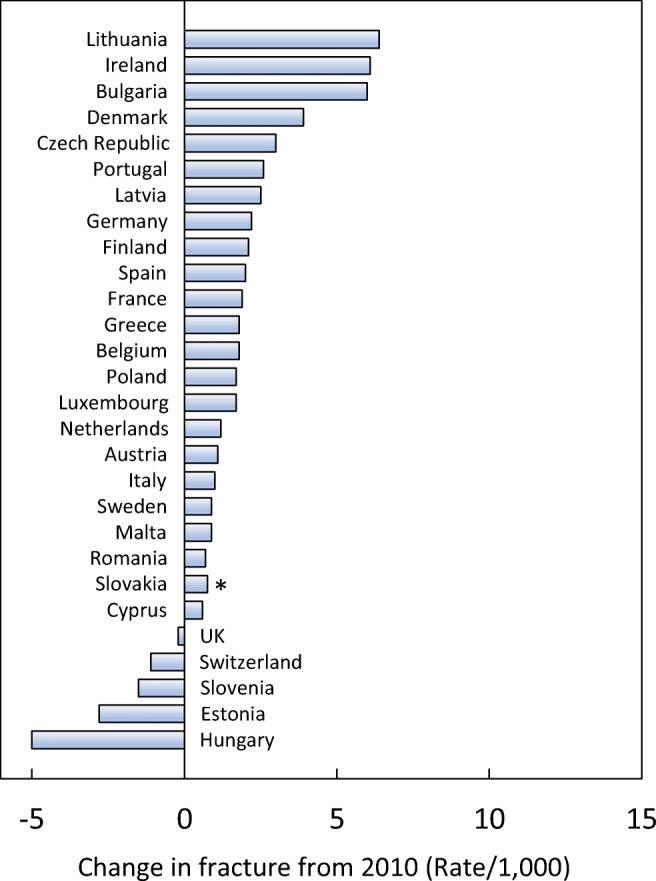
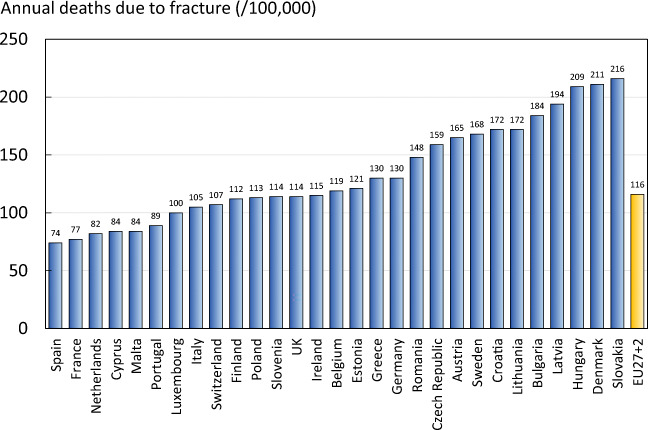
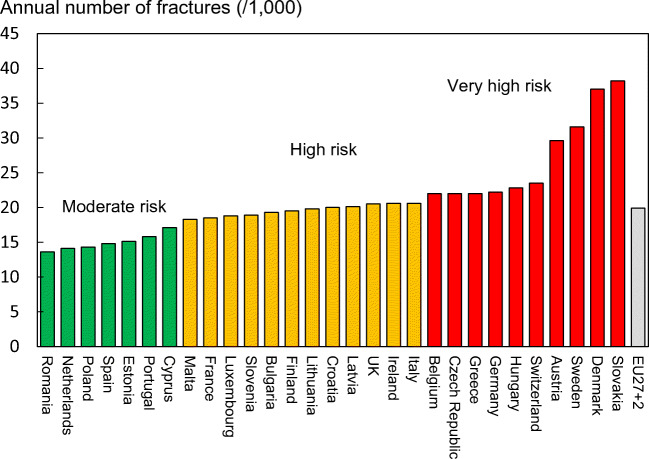
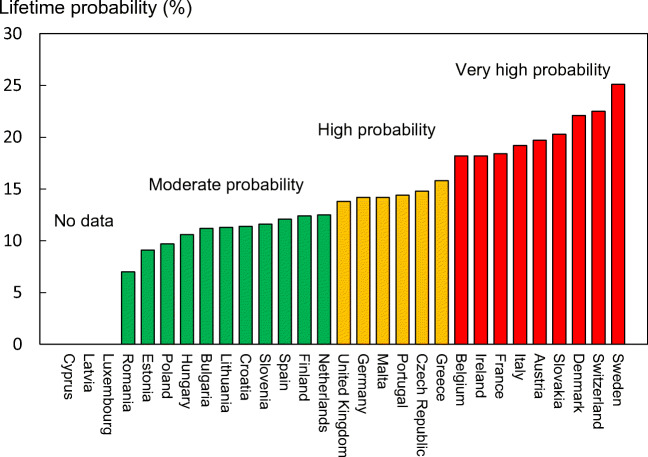
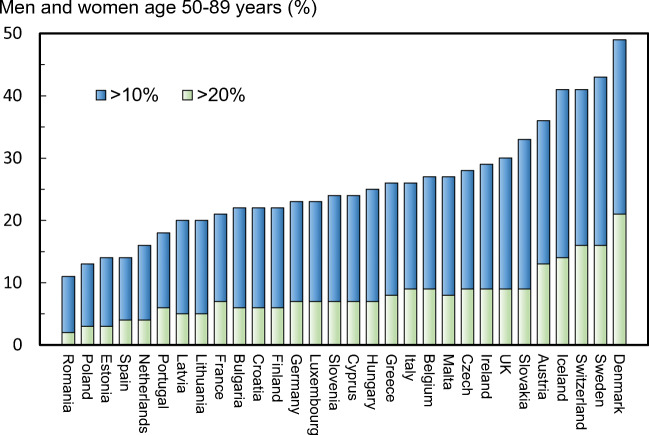
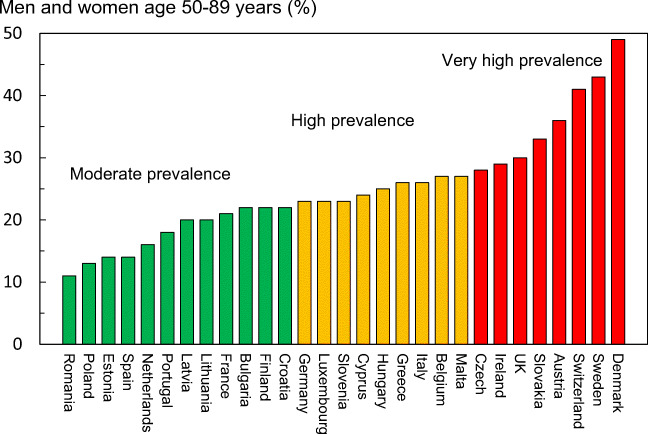
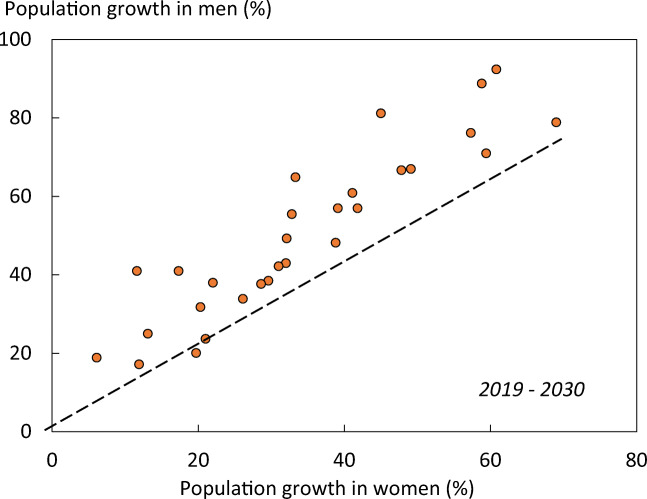
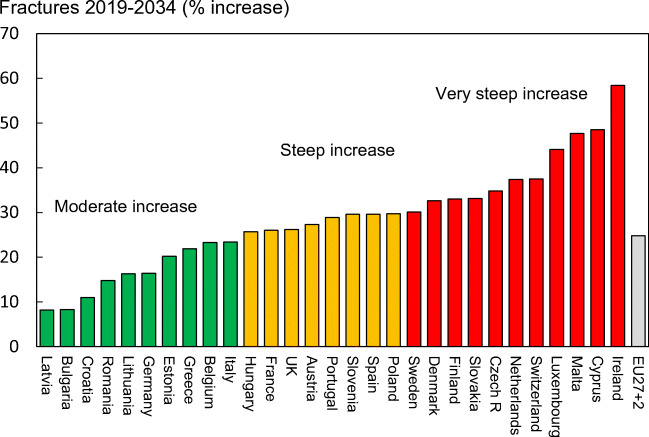
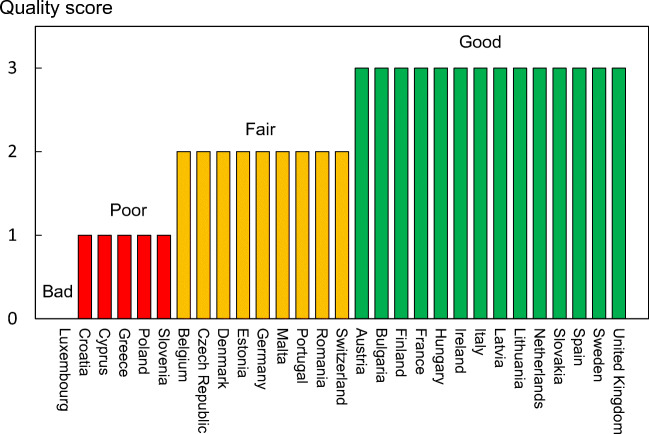
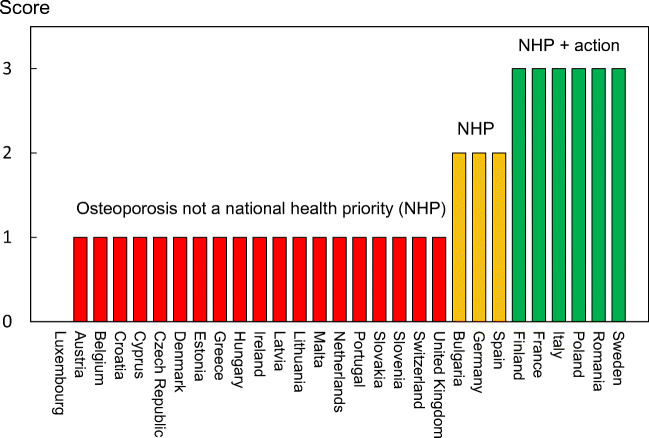
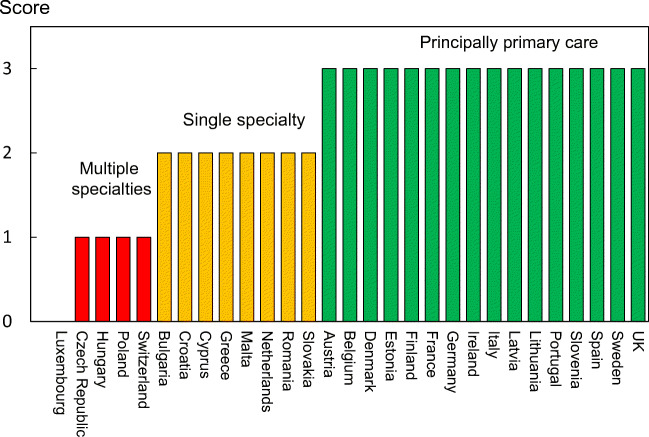
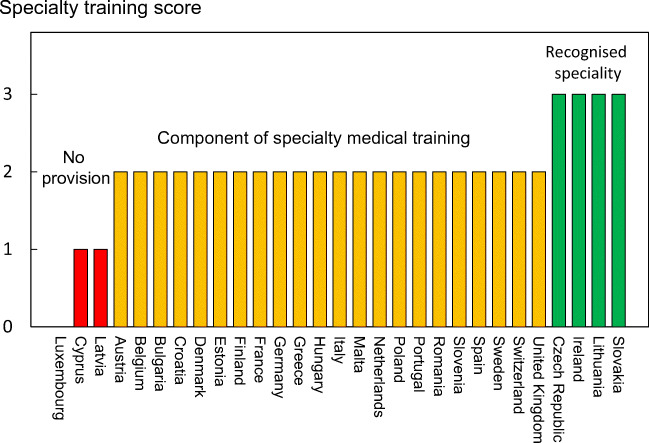
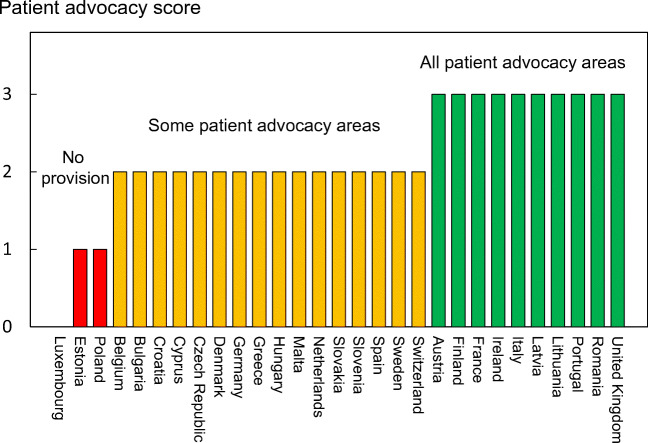
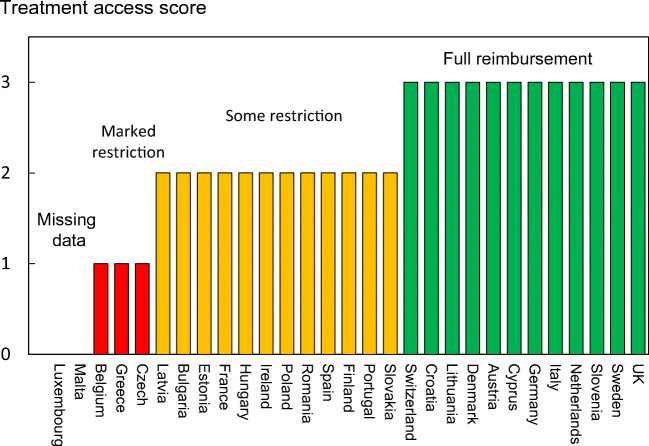
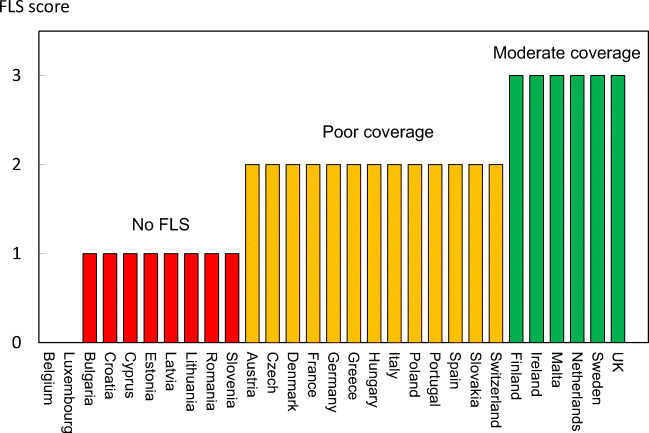
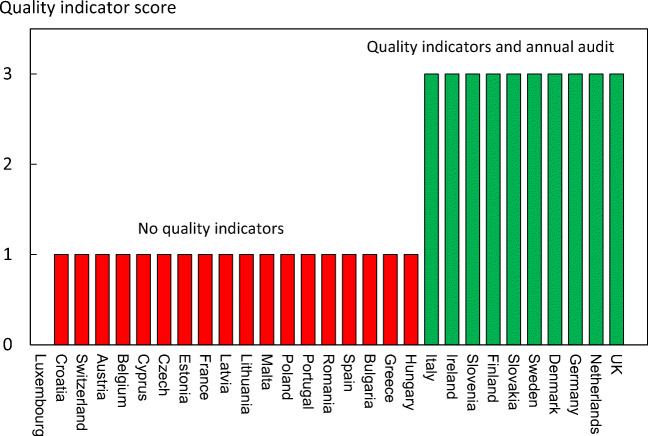
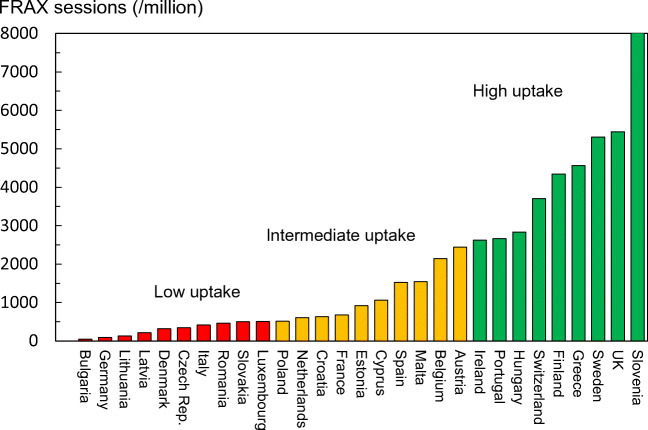
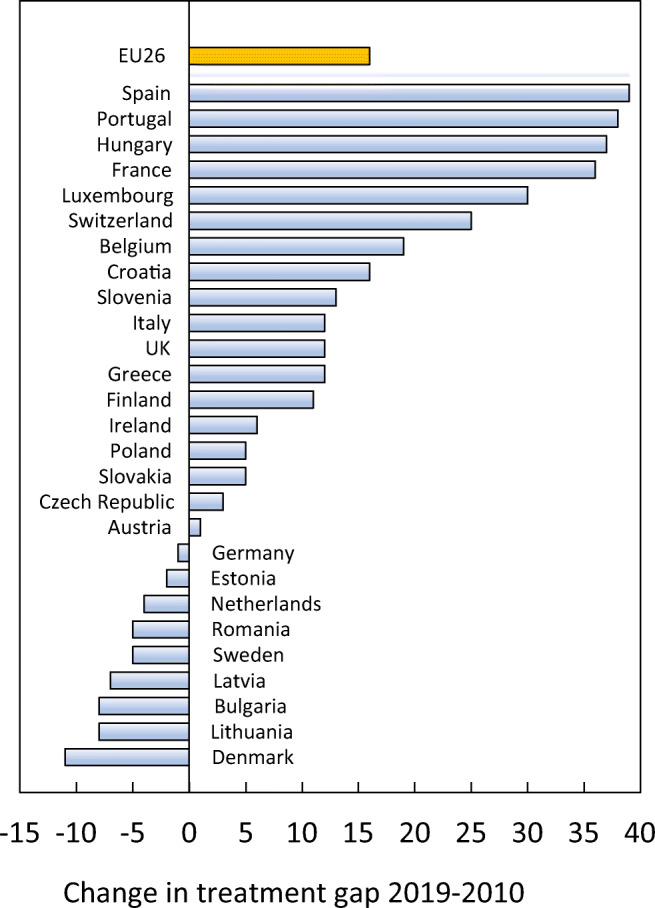
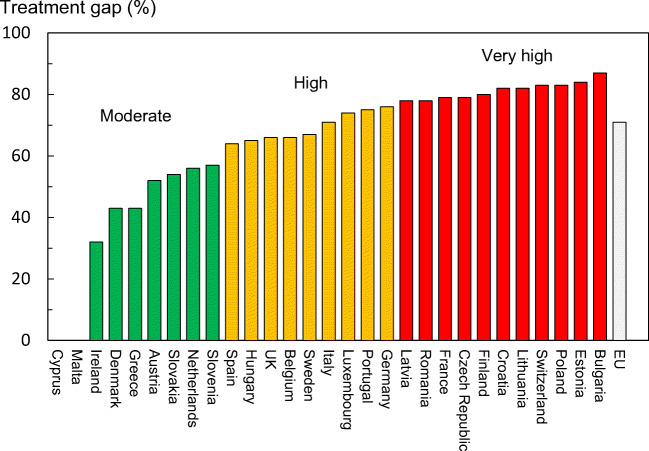
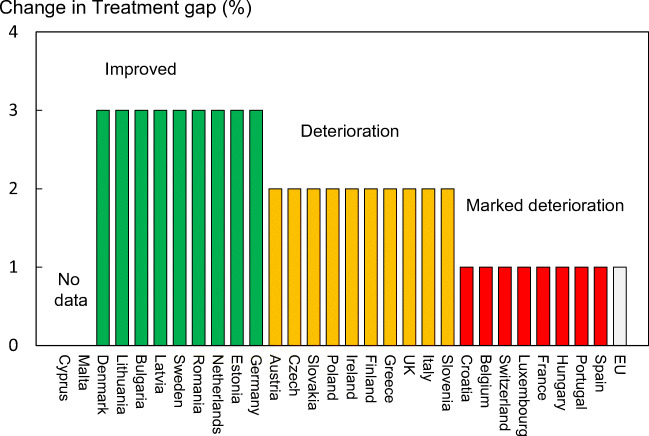
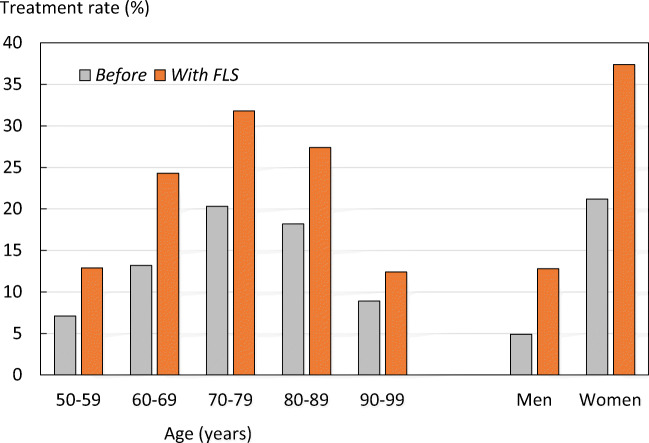
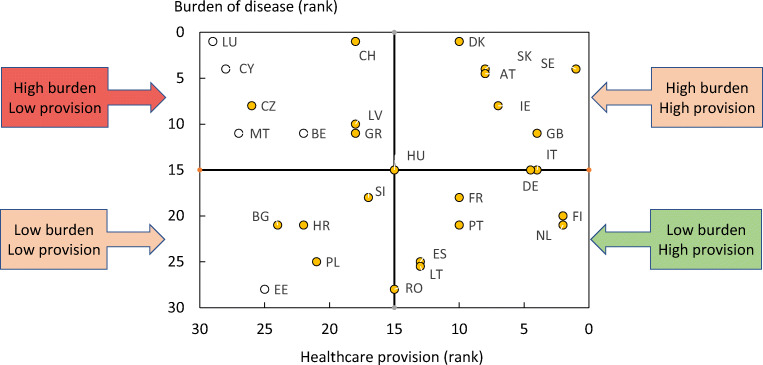
Results: There was a marked difference in fracture risk among the EU27+2 countries. Of concern was the marked heterogeneity in the policy framework, service provision and service uptake for osteoporotic fracture that bore little relation to the fracture burden. For example, despite the wide availability of treatments to prevent fractures, in the majority of the EU27+2, only a minority of patients at high risk receive treatment even after their first fracture. The elements of each domain in each country were scored and coded using a traffic light system (red, orange, green) and used to synthesise a scorecard. The resulting scorecard elements, assembled on a single sheet, provide a unique overview of osteoporosis in Europe.

Conclusions: The scorecard enables healthcare professionals and policy makers to assess their country's general approach to the disease and provide indicators to inform the future provision of healthcare.

Keywords: Burden of disease; Cost; Epidemiology; European Union; Osteoporosis; Policy framework; SCOPE; Scorecard; Service provision; Service uptake; Treatment gap; Treatment uptake.


Conflict of interest statement

F Borgström is employed and is a shareholder in Quantify Research, a health economic research consultancy that received a grant from IOF to conduct the analysis. N Norton, C Willers and T Jacobson are employed by Quantify Research, a health economic research consultancy that received a grant from IOF to conduct the analysis. N. Harvey has received consultancy, lecture fees and honoraria from Alliance for Better Bone Health, AMGEN, MSD, Eli Lilly, Servier, Shire, UCB, Kyowa Kirin, Consilient Healthcare, Radius Health and Internis Pharma. EV McCloskey has received consultancy/lecture fees/grant funding/honoraria from AgNovos, Amgen, AstraZeneca, Consilient Healthcare, Fresenius Kabi, Gilead, GSK, Hologic, Internis, Lilly, Merck, Novartis, Pfizer, Radius Health, Redx Oncology, Roche, SanofiAventis, Servier, Synexus, UCB, Viiv, Warner Chilcott, I3 Innovus and Unilever. JA Kanis is the architect of FRAX® but has no financial interest. M Lorentzon has received lecture fees from Amgen, Lilly, Meda, Renapharma, UCB Pharma, and consulting fees from Amgen, Radius Health, UCB Pharma, Renapharma and Consilient Health, all outside the presented work.

Figures

Fig. 1
Fig. 1
Cost of fragility fractures expressed as cost/capita in 2019 and 2010. The 2010 values are shown as grey bars
Fig. 2
Fig. 2
Components (%) of the cost of osteoporosis and fractures
Fig. 3
Fig. 3
Increase in total fracture cost (%) in 2019 compared with 2010 values
Fig. 4
Fig. 4
Proportion (%) of the total direct healthcare spend in the EU27+2 countries allocated to osteoporotic fractures. Bars in grey denote values for 2010
Fig. 5
Fig. 5
The prevalence of osteoporosis by country, and the average prevalence in the EU27+2
Fig. 6
Fig. 6
Correlation between men and women in the incidence of hip fracture in European countries. The dotted line shows the linear regression, and the dashed line shows the line of identity
Fig. 7
Fig. 7
Annual incidence of hip fracture in women from countries of the EU age-standardized to the world population for 2020
Fig. 8
Fig. 8
Change in crude incidence (annual rate/1000) of fragility fractures between 2010 and 2019. *Data for Slovakia imputed
Fig. 9
Fig. 9
The number of deaths associated with fracture events expressed per 100,000 of the population age 50 years or more in the EU27+2
Fig. 10
Fig. 10
Comparison of the number of causally related deaths due to fracture compared with other causes of death in Sweden in 2019
Fig. 11
Fig. 11
The annual number of fragility fractures in men and women combined expressed/1000 of the population aged 50 years or more, in 2019
Fig. 12
Fig. 12
Remaining lifetime probability of hip fracture (%) in men and women from the age of 50 years. The dotted line shows the linear regression, and the dashed line shows the line of identity
Fig. 13
Fig. 13
Remaining lifetime probability of hip fracture (%) in women in the EU27+2 from the age of 50 years
Fig. 14
Fig. 14
Proportion of men and women (%) aged 50–89 years with a 10-year probability of a major fracture that is 10% or more or 20% or more by member state
Fig. 15
Fig. 15
The proportion of the population (%) aged 50–89 years with a 10-year probability of a major fracture that is 10% or more by member state
Fig. 16
Fig. 16
increase by country in the female population aged 75 years or more (%) between 2010 and 2034
Fig. 17
Fig. 17
The relation between the percentage increase in the male and female population aged 75 years or more in the EU27+2. The diagonal shows the line of identity
Fig. 18
Fig. 18
The percentage increase in the number of fragility fractures between 2019 and 2034 in the EU27+2
Fig. 19
Fig. 19
Estimated (2010 and 2019) and predicted number of fractures (2025 and 2034, respectively) in men and women from the EU
Fig. 20
Fig. 20
Quality of information available on the epidemiology of hip fractures in the EU27+2 [IOF audit]
Fig. 21
Fig. 21
Categorisation of EU27+2 countries according to the existence of government-backed NHP for osteoporosis or musculoskeletal diseases [IOF audit]
Fig. 22
Fig. 22
Patterns of principal care of patients with osteoporosis [IOF audit]
Fig. 23
Fig. 23
The specialty representation in the EU27+2 countries. Note that more than one specialty per country can be represented (see Table 23) [IOF audit]. Other comprised osteology, primary care, traumatology, and neurosurgery
Fig. 24
Fig. 24
The score allocation and grade for specialist training in each country [IOF audit]
Fig. 25
Fig. 25
Scores for patient-organisation support, by country [IOF audit]
Fig. 26
Fig. 26
Ranking and score for access to medical intervention [IOF audit]
Fig. 27
Fig. 27
DXA units/million of the general population in 2019 based on sales of DXA supplied by manufacturers. The number of DXA units providing TBS is shown in the lower of the stacked bars. The horizontal line denotes a minimum service requirement for DXA [165]
Fig. 28
Fig. 28
DXA units/million of the general population in 2019 based on sales of DXA supplied by manufacturers
Fig. 29
Fig. 29
Reported average waiting time for a DXA assessment by country [IOF audit]
Fig. 30
Fig. 30
Categorisation of access to DXA by score amongst the member states [IOF audit]
Fig. 31
Fig. 31
The score assigned to each country on the basis of its provision of fracture risk assessment algorithms
Fig. 32
Fig. 32
Score allocation based on the scope and quality of guidelines available for the assessment and treatment of osteoporosis. For the UK, the score for guidance provided by NICE is 8 and that provided by the National Osteoporosis Guidelines Group has a score of 10 [IOF audit]
Fig. 33
Fig. 33
Scores allocated by country on the availability of fracture liaison services in hospitals by country [IOF audit]
Fig. 34
Fig. 34
Score allocation for quality indicators by country [IOF audit]
Fig. 35
Fig. 35
The uptake of BMD testing in men and women by age in Denmark in 2020 [Data kindly provided by Bo Abrahamsen, Department of Clinical Research, University of Southern Denmark and Holbæk Hospital, Denmark]
Fig. 36
Fig. 36
The uptake of BMD testing in women by age in Denmark in 2005 and 2020 [Data kindly provided by Bo Abrahamsen, Department of Clinical Research, University of Southern Denmark and Holbæk Hospital, Denmark]
Fig. 37
Fig. 37
The uptake of fracture risk assessment tools as judged by the use of FRAX from each EU27+2 country by score category
Fig. 38
Fig. 38
Change in treatment gap between 2010 and 2019
Fig. 39
Fig. 39
Treatment gap for women in 2019. EU includes all countries from the EU27+2 except Cyprus and Malta
Fig. 40
Fig. 40
Percent change in treatment gap for women in 2019. EU includes all countries from the EU27+2 except Cyprus and Malta
Fig. 41
Fig. 41
Treatment uptake in the year following a major osteoporotic fracture before and after the institution of FLSs by age and sex
Fig. 42
Fig. 42
The proportion (%) of the population aged 50 years or more with a prior hip or vertebral fracture in 2019
Fig. 43
Fig. 43
The relationship between the prevalence of a prior spine or hip fracture (service need) and the treatment gap (service provision) in the EU27 countries. The horizontal and vertical lines intersect at the EU average (weighted for population size. Country codes (ISO 3166–1 alpha-2); AT Austria; BE Belgium; BG Bulgaria; HR Croatia; CY Cyprus; CZ Czech Republic; DE Germany; DK Denmark; EE Estonia; ES Spain; FI Finland; FR France; GB UK; GR Greece; HU Hungary; IE Ireland; IT Italy; LT Lithuania; LU Luxembourg; LV Latvia; MT Malta; NL Netherlands; PL Poland; PT Portugal; RO Romania; SE Sweden; SI Slovenia; SK Slovakia; CH Switzerland
Fig. 44
Fig. 44
Countries categorised by the average waiting time for surgical intervention for hip fracture
Fig. 45
Fig. 45
Total scores by country for metrics related to Burden of disease. The score for each of the 5 metrics is given in Chapter 1 and subtracted from 15 (the highest possible score). An unfilled bar denotes that there was one or more missing metric which might affect the burden score
Fig. 46
Fig. 46
Scores by country for metrics related to policy framework, service provision and service uptake. The mean score for each of the 3 domains is given. An asterisk denotes that there was one or more missing metric which decreases the overall score
Fig. 47
Fig. 47
The relationship between the Burden of disease and the healthcare provision (Policy framework, Service provision and Service uptake) in the EU27+2 countries. The horizontal and vertical lines intersect at the median rankings. Open circles denote countries with missing information either in health care provision or burden of disease. Country codes (ISO 3166–1 alpha-2); AT Austria; BE Belgium; BG Bulgaria; HR Croatia; CY Cyprus; CZ Czech Republic; DE Germany; DK Denmark; EE Estonia; ES Spain; FI Finland; FR France; GB UK; GR Greece; HU Hungary; IE Ireland; IT Italy; LT Lithuania; LU Luxembourg; LV Latvia; MT Malta; NL Netherlands; PL Poland; PT Portugal; RO Romania; SE Sweden; SI Slovenia; SK Slovakia; CH Switzerland
Fig. 48
Fig. 48
Correlation between the total score for health care provision in 2019 and 2010. The solid line indicates the line of identity. Luxembourg is not included because of the large amount of missing data
The Scorecard
The Scorecard
The scorecard and key are provided below

Publication types