. 2022 Jan;77(1):173-185.
doi: 10.1111/all.14972. Epub 2021 Jun 19.

Asthma phenotypes, associated comorbidities, and long-term symptoms in COVID-19

Affiliations

Asthma phenotypes, associated comorbidities, and long-term symptoms in COVID-19

Lauren E Eggert et al. Allergy. 2022 Jan.

Abstract

Background: It is unclear whether asthma and its allergic phenotype are risk factors for hospitalization or severe disease from SARS-CoV-2.

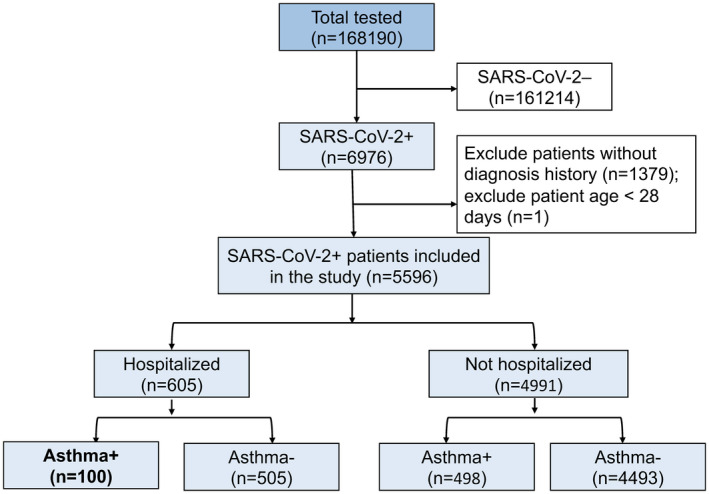
Methods: All patients over 28 days old testing positive for SARS-CoV-2 between March 1 and September 30, 2020, were retrospectively identified and characterized through electronic analysis at Stanford. A sub-cohort was followed prospectively to evaluate long-term COVID-19 symptoms.

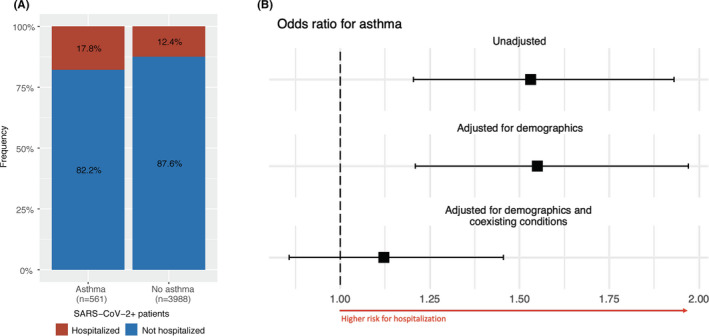
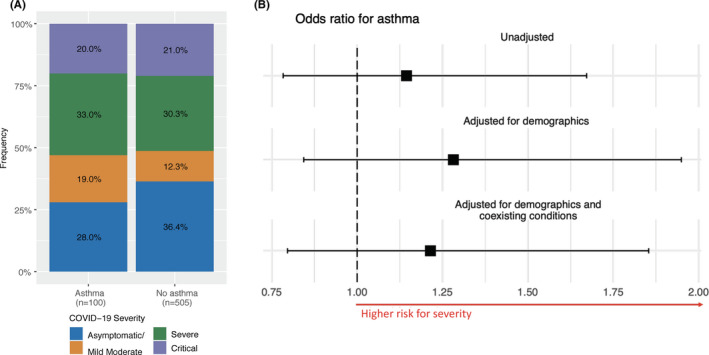
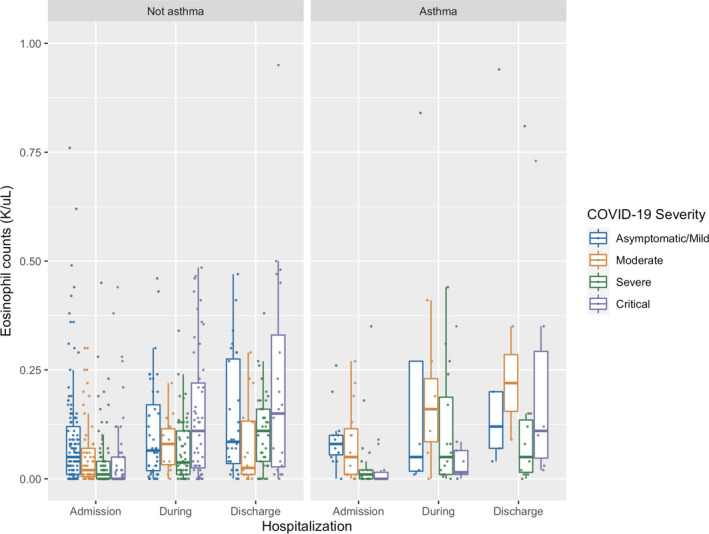
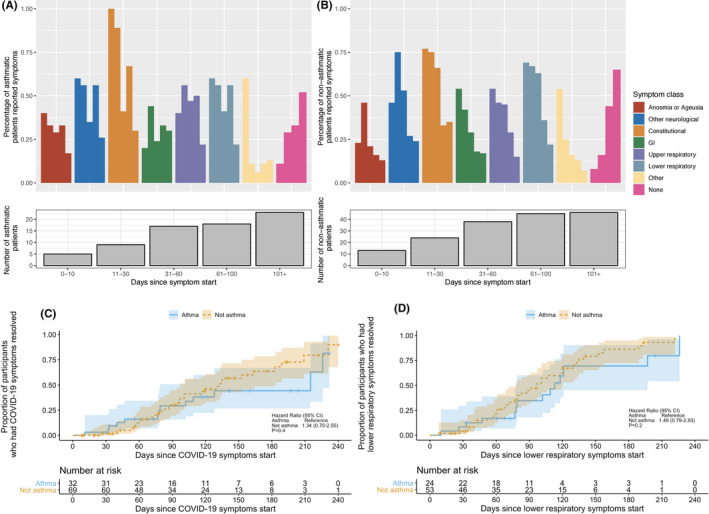
Results: 168,190 patients underwent SARS-CoV-2 testing, and 6,976 (4.15%) tested positive. In a multivariate analysis, asthma was not an independent risk factor for hospitalization (OR 1.12 [95% CI 0.86, 1.45], p = .40). Among SARS-CoV-2-positive asthmatics, allergic asthma lowered the risk of hospitalization and had a protective effect compared with non-allergic asthma (OR 0.52 [0.28, 0.91], p = .026); there was no association between baseline medication use as characterized by GINA and hospitalization risk. Patients with severe COVID-19 disease had lower eosinophil levels during hospitalization compared with patients with mild or asymptomatic disease, independent of asthma status (p = .0014). In a patient sub-cohort followed longitudinally, asthmatics and non-asthmatics had similar time to resolution of COVID-19 symptoms, particularly lower respiratory symptoms.

Conclusions: Asthma is not a risk factor for more severe COVID-19 disease. Allergic asthmatics were half as likely to be hospitalized with COVID-19 compared with non-allergic asthmatics. Lower levels of eosinophil counts (allergic biomarkers) were associated with a more severe COVID-19 disease trajectory. Recovery was similar among asthmatics and non-asthmatics with over 50% of patients reporting ongoing lower respiratory symptoms 3 months post-infection.

Keywords: COVID-19; SARS-CoV-2; asthma; eosinophils.


Conflict of interest statement

LE, ZH, AL, TS, JF, SC, RO, MA, LB, BP, SJ, RP, RW, AB, GD, and NA report no conflicts of interest. WC reports research support from Regeneron.MD reports receiving grant funding from the Ping Li and Kim Li Endowment and the NIH. SS reports receiving grant funding from the NIH, Regeneron, DBV Technologies, Aimmune, Novartis, and CoFAR. KN reports grant funding from NIAID, NHLBI, NIEHS, and FARE, and support from the Sunshine Foundation, Parker Foundation, and Crown Foundation.SC receives grant funding from NIAID, CoFAR, Aimmune, DBV Technologies, Astellas, Regeneron, and FARE and support from the Maternal Child Health Research Institute, Sunshine Foundation, Parker Foundation, and Crown Foundation.

Figures

FIGURE 1
FIGURE 1
Consort diagram
FIGURE 2
FIGURE 2
Association between asthma status and hospitalization. Legend: A, Numbers and percentages of hospitalizations stratified by asthma status. B, Forest plot indicating the odds ratio of asthma status on hospitalization in univariate analysis and adjusted odds ratios in multivariate analysis (adjusted for demographic data and adjusted for demographic data and other coexisting conditions). Medians and 95% CI are shown
FIGURE 3
FIGURE 3
Association between asthma status and COVID‐19 severity among COVID‐19 hospitalized patients. Legend: A, The frequency of inpatients in each severity category stratified by asthma status. B, Forest plot indicating the odds ratio and 95% confidence interval (CI) of asthma status on COVID‐19 severity from logistic regression models in univariate analysis and multivariable analysis (adjusted for demographic data and adjusted for demographic data and other coexisting conditions)
FIGURE 4
FIGURE 4
Association between allergic asthma and hospitalization and COVID‐19 severity. Legend: A, The frequency of hospitalization between allergic and non‐allergic asthmatic among SARS‐CoV‐2‐positive patients. B, Forest plot showing the odds ratios and 95% CI of allergic asthma on hospitalization among asthmatic SARS‐CoV‐2‐positive patients from logistic regression models in univariate analysis and multivariable analysis (adjusted for demographic data and adjusted for demographic data and other coexisting conditions). C, The frequency of COVID‐19 severity between allergic and non‐allergic asthmatic among inpatients. D, Forest plot showing the odds ratios and 95% CI of allergic asthma severity among inpatients from ordinal regression models in univariate analysis and multivariable analysis (adjusted for demographic data and adjusted for demographic data and other coexisting conditions)
FIGURE 5
FIGURE 5
Eosinophil counts during hospitalization stratified by asthma status and COVID‐19 disease severity in patients without steroid usage. Legend: Admission eosinophil counts were collected within 3 days prior to admission, discharge eosinophil counts were collected on the day of discharge, and during hospitalization, eosinophil counts were collected in between admission and discharge counts
FIGURE 6
FIGURE 6
Longitudinal symptoms in asthmatic COVID‐19 patients. Legend: Longitudinal symptoms were followed in a subgroup of asthmatic and non‐asthmatic COVID‐19 patients. Patients were seen in visit windows including 0–10 days, 11–30 days, 31–60 days, 61–100 days, and 101+ days from symptom onset. Bar graph showing frequency of asthmatic A, and non‐asthmatic B, patients reporting symptoms in each symptom class over time by visit window. “None” indicates frequency of patients who reported not having any symptoms; number of patients seen in each visit window is shown below the bar graph. C, Kaplan‐Meier curves of time to all symptom resolution and corresponding 95% confidence interval bands by asthmatic and non‐asthmatic COVID‐19 patients. p value was based on the log‐rank test. D, Kaplan‐Meier curves of time to lower respiratory symptom resolution and corresponding 95% confidence interval bands by asthmatic and non‐asthmatic COVID‐19 patients. p value was based on the log‐rank test

Comment in

References

    1. Busse WW, Lemanske RF, Gern JE. Role of viral respiratory infections in asthma and asthmaexacerbations. Lancet. 2010;376(9743):826‐834. 10.1016/S0140-6736(10)61380-3 - DOI - PMC - PubMed
    1. Johnston SL, Pattemore PK, Sanderson G, et al. Community study of role of viral infections inexacerbations of asthma in 9–11 year old children. BMJ. 1995;310(6989):1225. 10.1136/bmj.310.6989.1225. - DOI - PMC - PubMed
    1. Skevaki C, Karsonova A, Karaulov A, Xie M, Renz H. Asthma‐associated risk for COVID‐19 development. J Allergy Clin Immunol. 2020;146(6):1295‐1301. 10.1016/j.jaci.2020.09.017 - DOI - PMC - PubMed
    1. Zhang J, Dong X, Cao Y, et al. Clinical characteristics of 140 patients infected with SARS‐CoV‐2 in Wuhan, China. Allergy. 2020;75(7):1730‐1741. 10.1111/all.14238 - DOI - PubMed
    1. Bousquet J, Jutel M, Akdis CA, et al. ARIA‐EAACI statement on asthma and COVID‐19 (June 2, 2020). Allergy. 2021;76(3):689‐697. 10.1111/all.14471 - DOI - PMC - PubMed

Publication types