

Sleep difficulties, incident dementia and all-cause mortality among older adults across 8 years: Findings from the National Health and Aging Trends Study
- PMID: 34080234
- PMCID: PMC9204609
- DOI: 10.1111/jsr.13395
Sleep difficulties, incident dementia and all-cause mortality among older adults across 8 years: Findings from the National Health and Aging Trends Study
Abstract
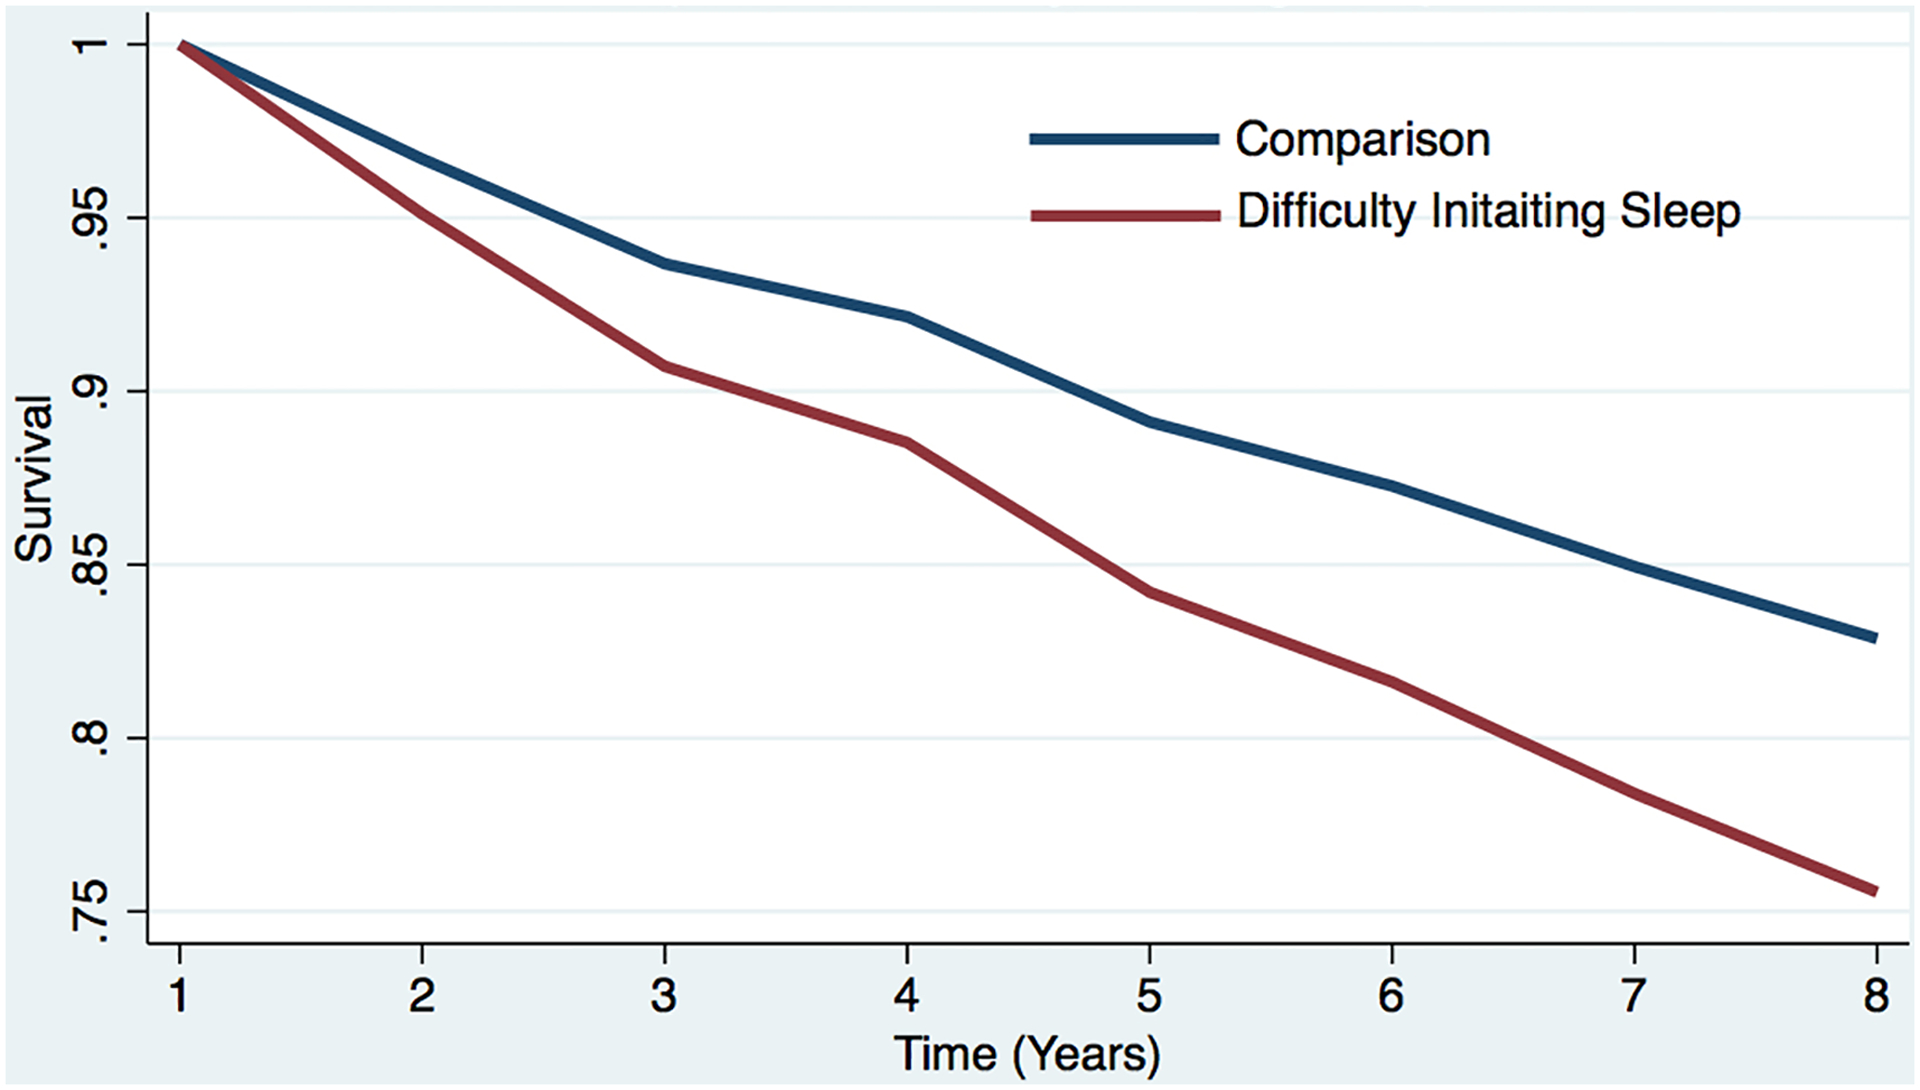
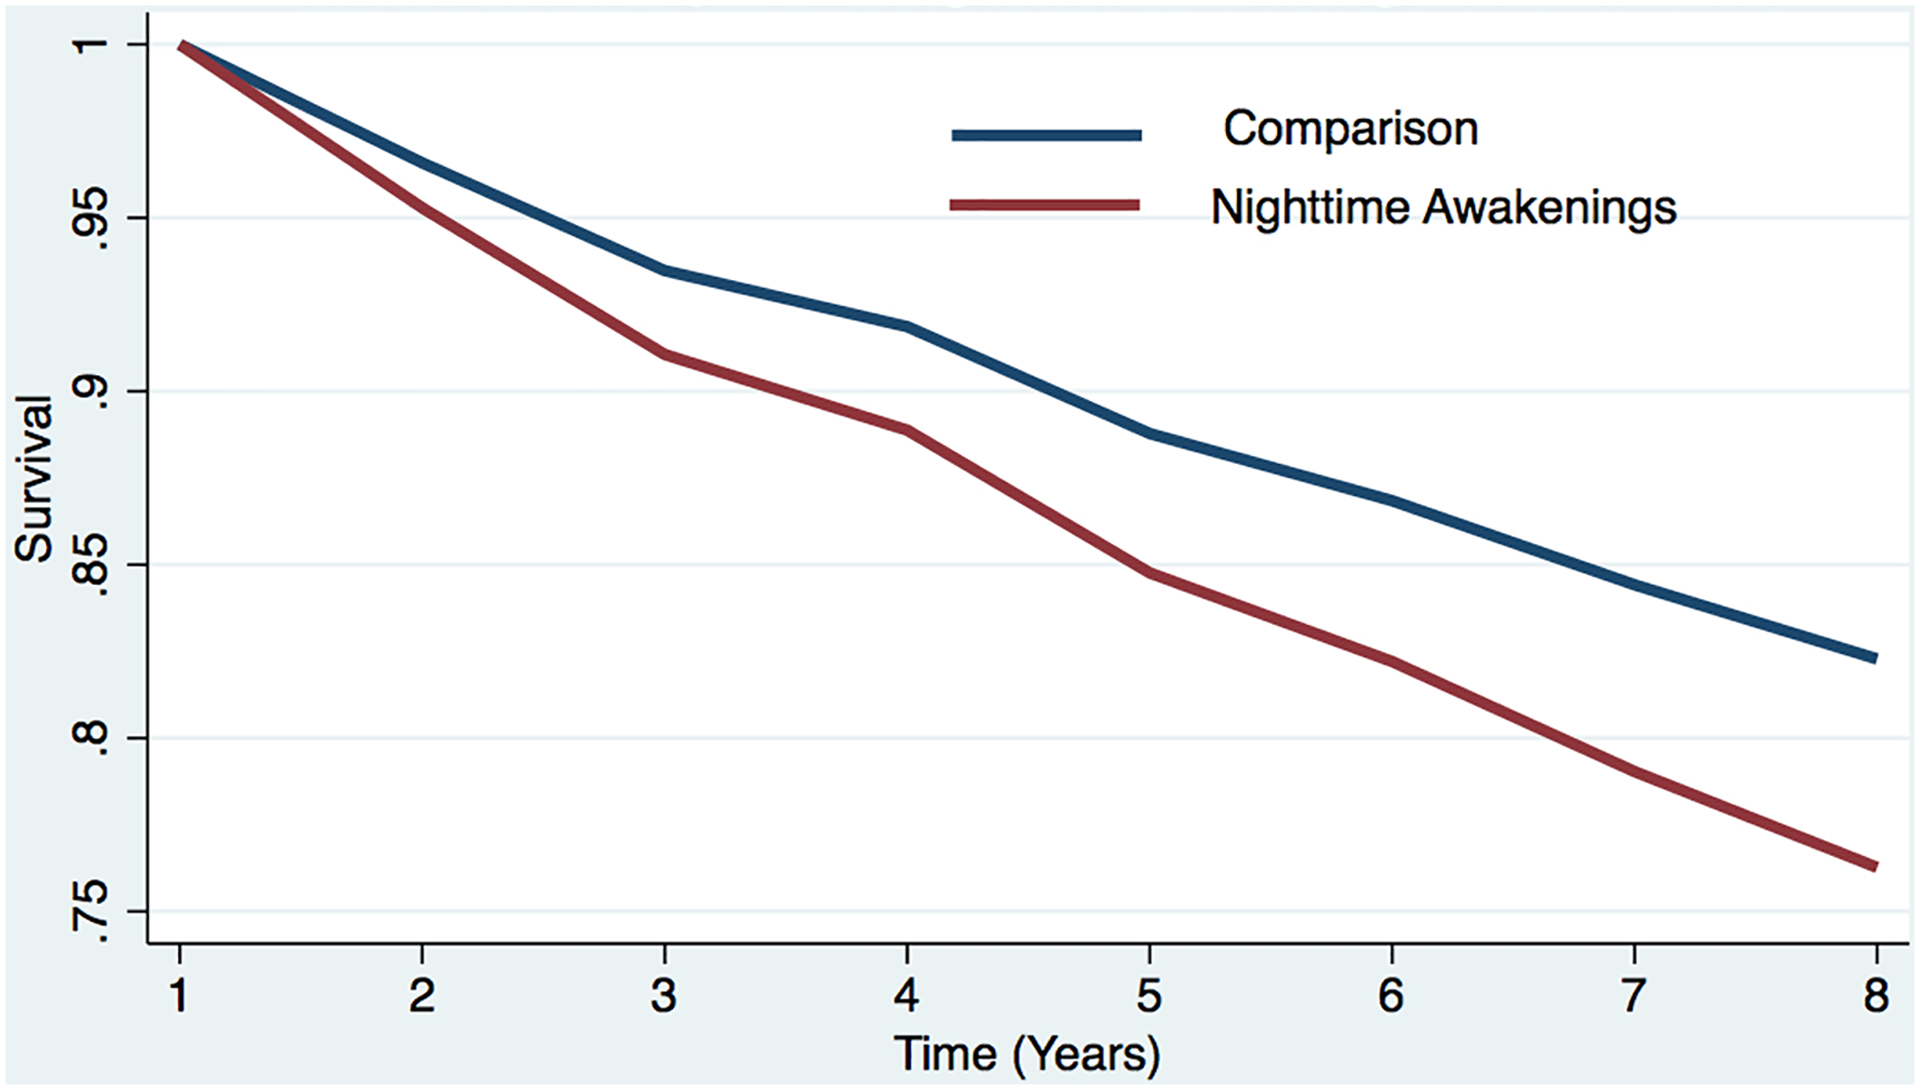
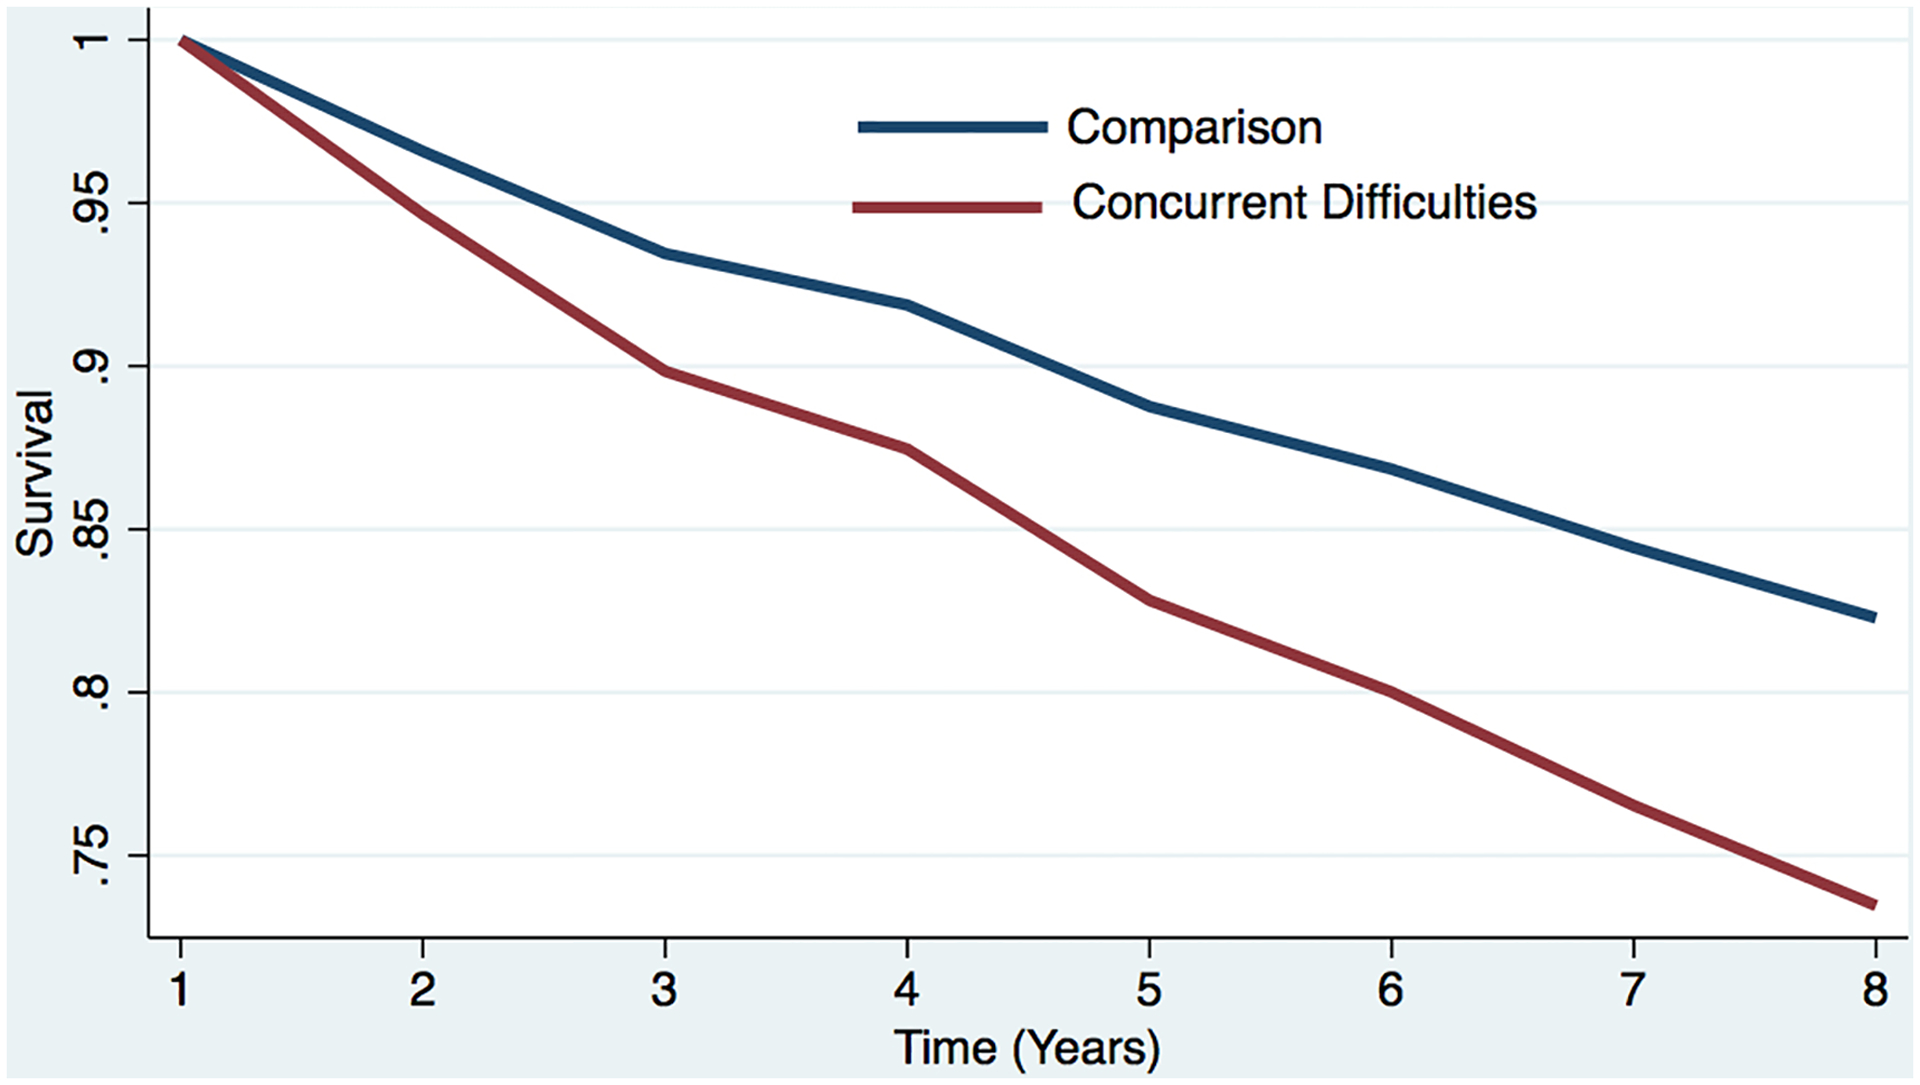
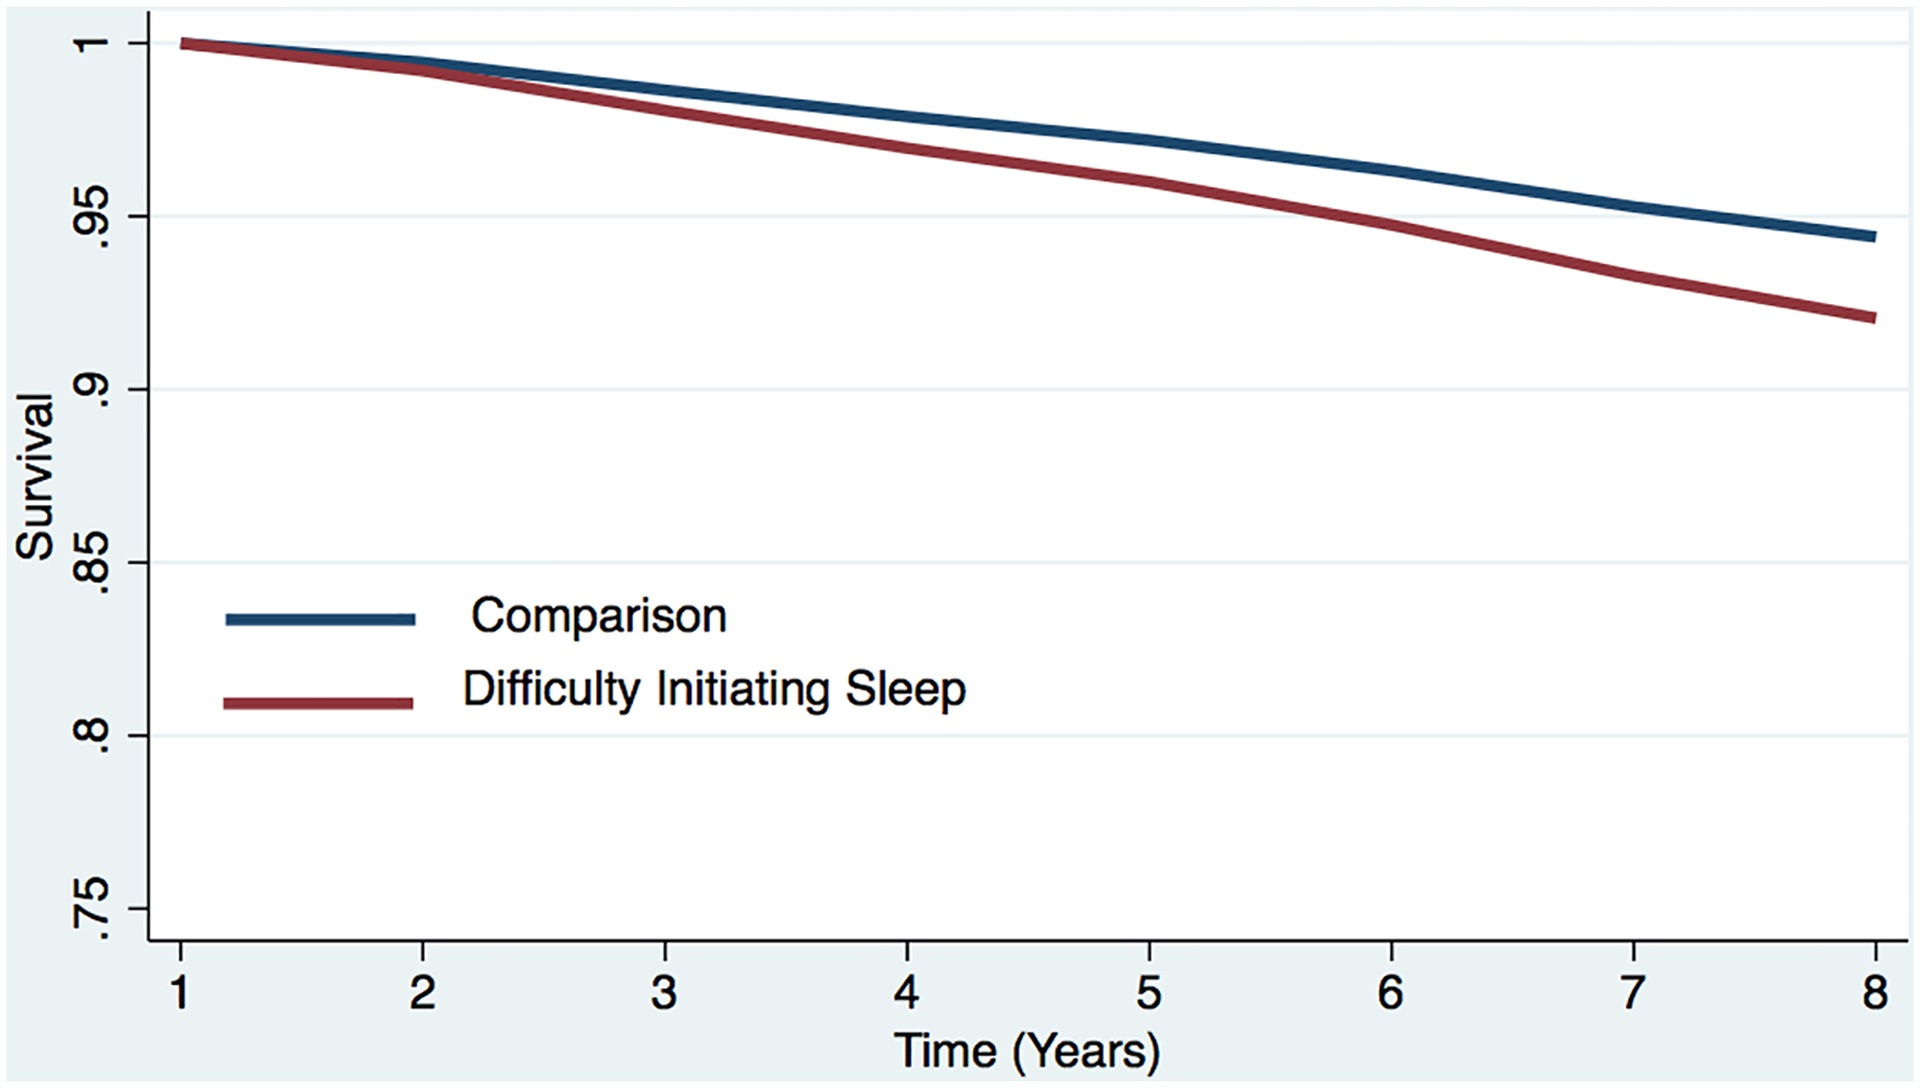
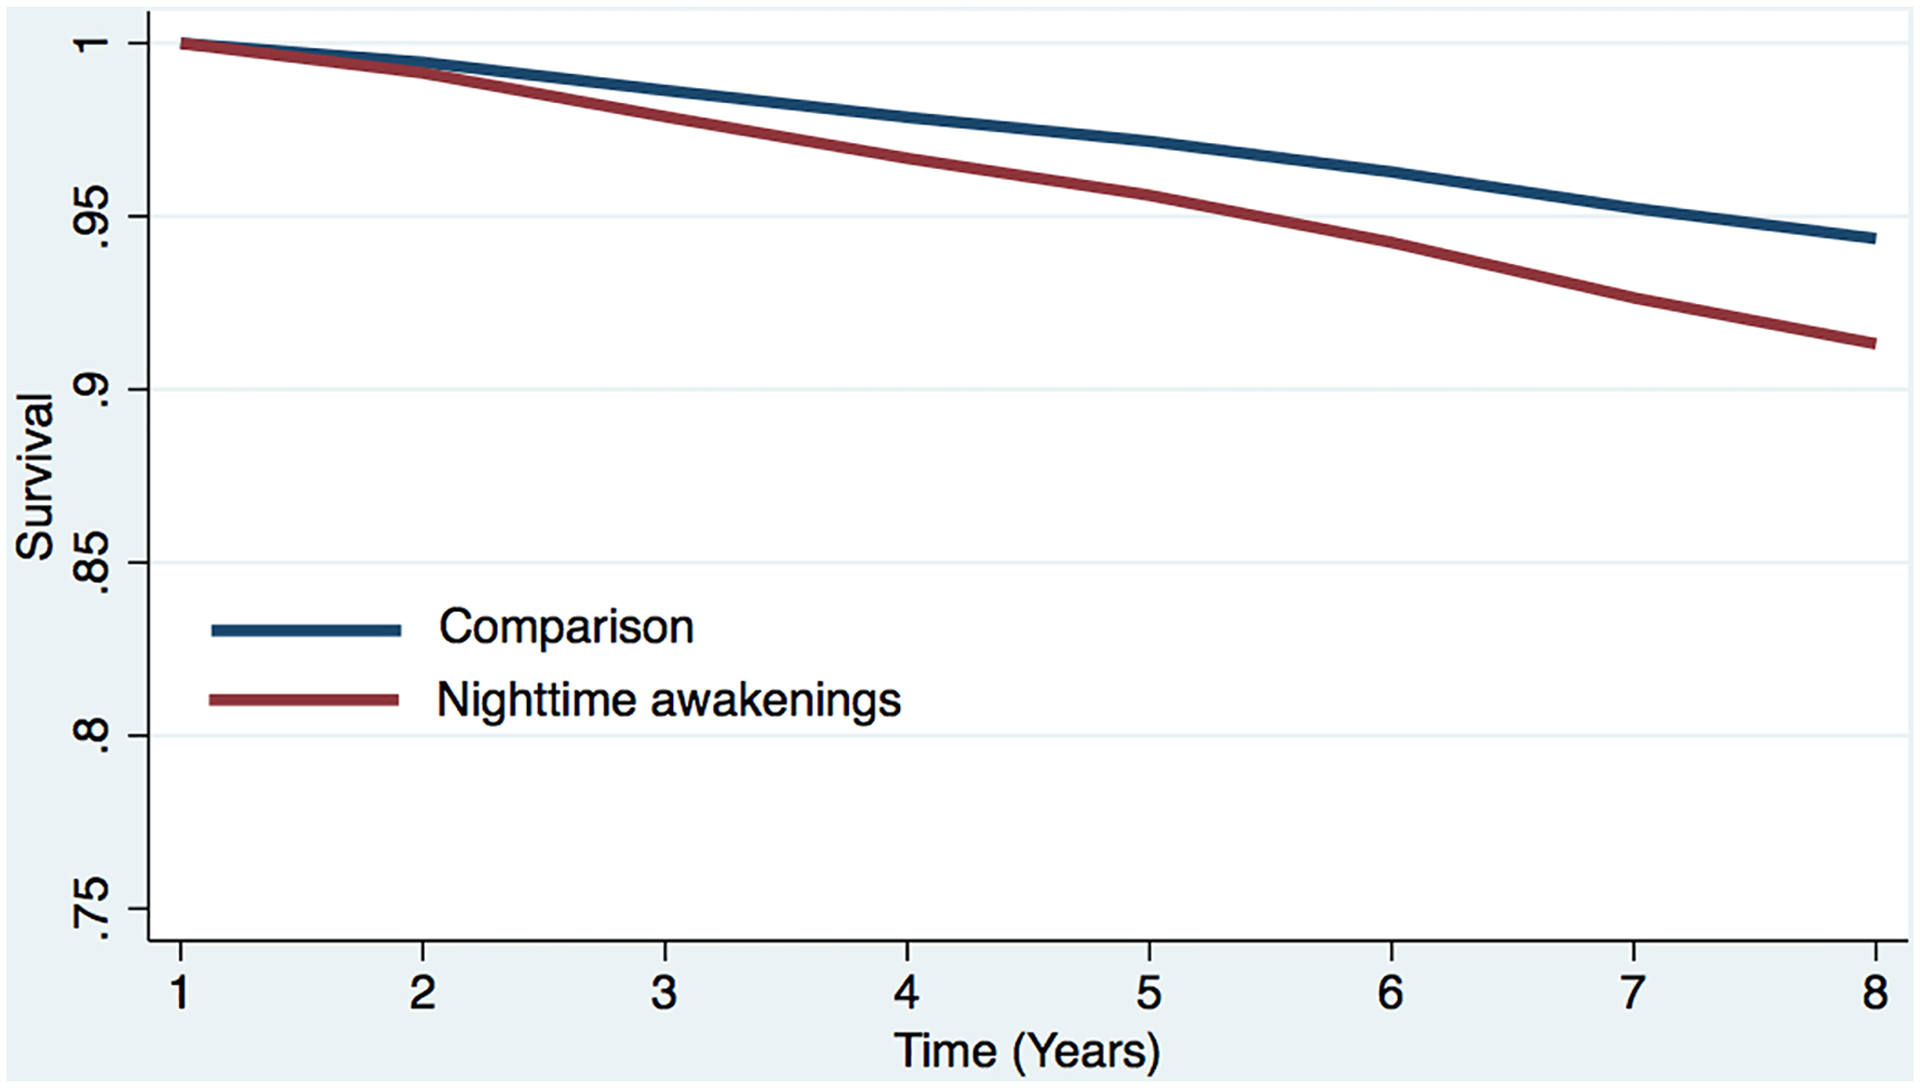
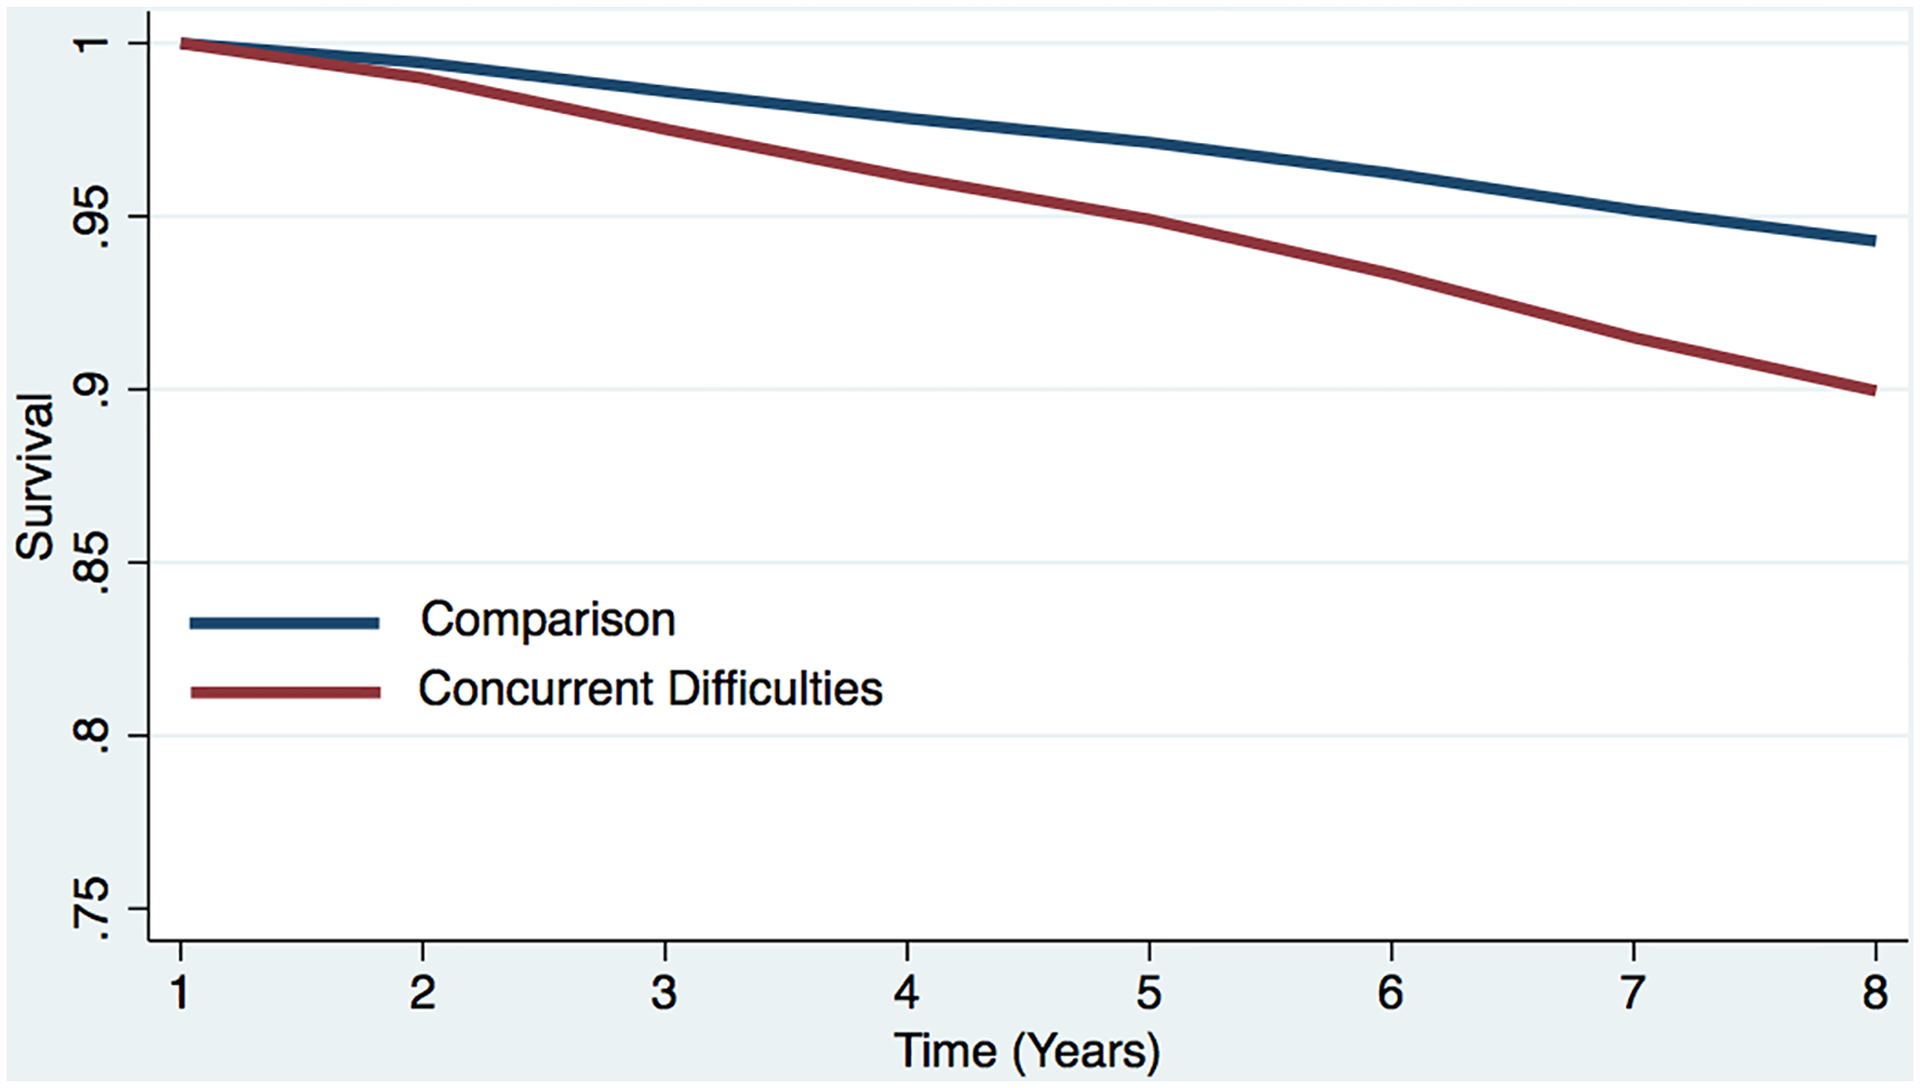
Sleep difficulties have been implicated in the development and progression of dementia and in all-cause mortality. This study examines the relationship between sleep difficulties, incident dementia and all-cause mortality over 8 years of follow-up among a nationally representative sample of older (≥65 years) adults in the United States. We used data collected from the National Health and Aging Trends Study (NHATS) from 2011 to 2018, a prospective cohort study of Medicare beneficiaries. At baseline, the NHATS sample comprised 6,376 older adults who were representative of 32 million older adults. Respondents reported routine difficulty initiating sleep or difficulty falling back asleep "most nights" or "every night" in each study year. In each year, dementia was determined by either self-reported diagnosis or performance on immediate and delayed recall word and clock drawing tests, whereas all-cause mortality was determined by proxy. We conducted Cox proportional hazards modelling, adjusting for age, sex, marital status and chronic conditions. In models predicting all-cause mortality, we also controlled for dementia. Among respondents at baseline, 19% were 65-75 years of age, 71% identified as non-Hispanic white and 59% were female. Difficulty initiating sleep (hazard ratio [HR], 1.49; 95% confidence interval [CI],1.25-1.77), difficulty falling back asleep (HR, = 1.39; 95% CI,1.14-1.70) and concurrent sleep difficulties (HR, 1.58; 95% CI, 1.25-1.99) were associated with greater risk of dementia. Difficulty initiating sleep (HR, 1.44; 95% CI,1.20-1.72), difficulty falling back asleep (HR, 1.56; 95% CI,1.29-1.89), and concurrent sleep difficulties (HR, 1.80; 95% CI, 1.44-2.24) were associated with greater risk of all-cause mortality. Our findings demonstrate that reported difficulties are prospectively associated with an increased risk of dementia and all-cause mortality among older people.
Keywords: geriatric medicine; gerontology; insomnia; sleep difficulties; sleep medicine.
© 2021 European Sleep Research Society.
Figures
Similar articles
-
Sleep medication use and incident dementia in a nationally representative sample of older adults in the US.Sleep Med. 2021 Mar;79:183-189. doi: 10.1016/j.sleep.2020.11.004. Epub 2020 Nov 11. Sleep Med. 2021. PMID: 33248901 Free PMC article.
-
Examining sleep deficiency and disturbance and their risk for incident dementia and all-cause mortality in older adults across 5 years in the United States.Aging (Albany NY). 2021 Feb 11;13(3):3254-3268. doi: 10.18632/aging.202591. Epub 2021 Feb 11. Aging (Albany NY). 2021. PMID: 33570509 Free PMC article.
-
Sleep Disturbances and Dementia Risk in Older Adults: Findings From 10 Years of National U.S. Prospective Data.Am J Prev Med. 2023 Jun;64(6):781-787. doi: 10.1016/j.amepre.2023.01.008. Epub 2023 Jan 26. Am J Prev Med. 2023. PMID: 36707315
-
Sleep disturbances and racial-ethnic disparities in 10-year dementia risk among a national sample of older adults in the USA.BJPsych Open. 2024 Dec 4;10(6):e219. doi: 10.1192/bjo.2024.814. BJPsych Open. 2024. PMID: 39629606 Free PMC article.
-
Insomnia and risk of mortality from all-cause, cardiovascular disease, and cancer: Systematic review and meta-analysis of prospective cohort studies.Sleep Med Rev. 2019 Dec;48:101215. doi: 10.1016/j.smrv.2019.101215. Epub 2019 Sep 24. Sleep Med Rev. 2019. PMID: 31630016
Cited by
-
Neutrophil activation may trigger tau burden contributing to cognitive progression of chronic sleep disturbance in elderly individuals not living with dementia.BMC Med. 2023 Jun 6;21(1):205. doi: 10.1186/s12916-023-02910-x. BMC Med. 2023. PMID: 37280592 Free PMC article.
-
Association between Sleep Onset Problem and Subjective Cognitive Complaints among Japanese Older Adults during the Coronavirus Disease 2019 Pandemic.Int J Environ Res Public Health. 2022 Dec 22;20(1):156. doi: 10.3390/ijerph20010156. Int J Environ Res Public Health. 2022. PMID: 36612476 Free PMC article.
-
The burden of untreated insomnia disorder in a sample of 1 million adults: a cohort study.BMC Public Health. 2023 Aug 3;23(1):1481. doi: 10.1186/s12889-023-16329-9. BMC Public Health. 2023. PMID: 37537544 Free PMC article.
-
Long-term quality of life of testicular cancer survivors differs according to applied adjuvant treatment and tumour type.J Cancer Surviv. 2024 Apr 24. doi: 10.1007/s11764-024-01580-9. Online ahead of print. J Cancer Surviv. 2024. PMID: 38658465
-
Pain and mild cognitive impairment among adults aged 50 years and above residing in low- and middle-income countries.Aging Clin Exp Res. 2023 Jul;35(7):1513-1520. doi: 10.1007/s40520-023-02434-7. Epub 2023 May 25. Aging Clin Exp Res. 2023. PMID: 37227581 Free PMC article.
References
-
- Alzheimer’s Association. (2019). 2019 Alzheimer’s disease facts and figures. Alzheimer’s & Dementia, 15(3), 321–387. - PubMed
-
- Bateman RJ, Blennow K, Doody R, Hendrix S, Lovestone S, Salloway S, Schindler R, Weiner M, Zetterberg H, Aisen P, & Vellas B (2019). Plasma Biomarkers of AD Emerging as Essential Tools for Drug Development: An EU/US CTAD Task Force Report. The Journal of Prevention of Alzheimer’s Disease, 6(3), 169–173. 10.14283/jpad.2019.21 - DOI - PubMed
-
- Blackwell T, Yaffe K, Ancoli-Israel S, Schneider JL, Cauley JA, Hillier TA, Fink HA, Stone KL, & Study of Osteoporotic Fractures Group. (2006). Poor sleep is associated with impaired cognitive function in older women: The study of osteoporotic fractures. The Journals of Gerontology. Series A, Biological Sciences and Medical Sciences, 61(4), 405–410. - PubMed
Publication types
MeSH terms
Grants and funding
LinkOut - more resources
Full Text Sources
Medical
