. 2021 Oct;17(10):1735-1755.
doi: 10.1002/alz.12341. Epub 2021 Jun 3.

Acute systemic inflammation exacerbates neuroinflammation in Alzheimer's disease: IL-1β drives amplified responses in primed astrocytes and neuronal network dysfunction

Affiliations

Acute systemic inflammation exacerbates neuroinflammation in Alzheimer's disease: IL-1β drives amplified responses in primed astrocytes and neuronal network dysfunction

Ana Belen Lopez-Rodriguez et al. Alzheimers Dement. 2021 Oct.

Abstract

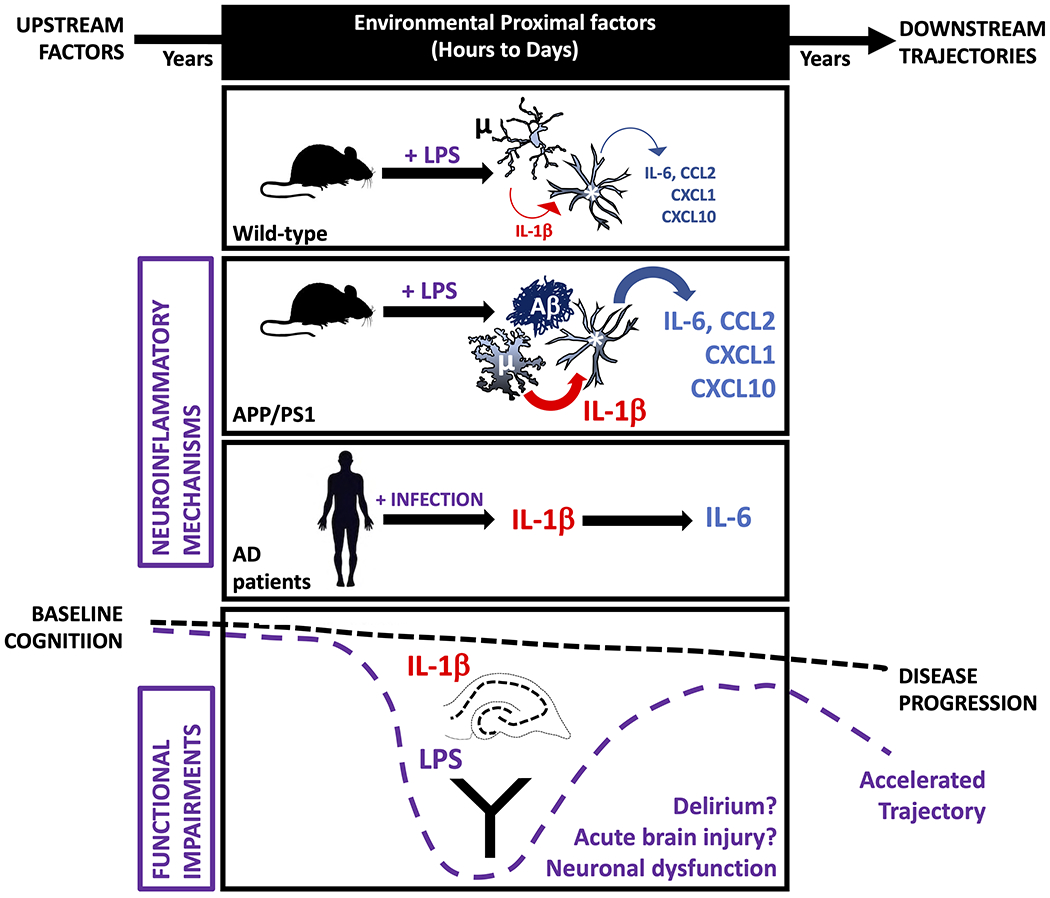
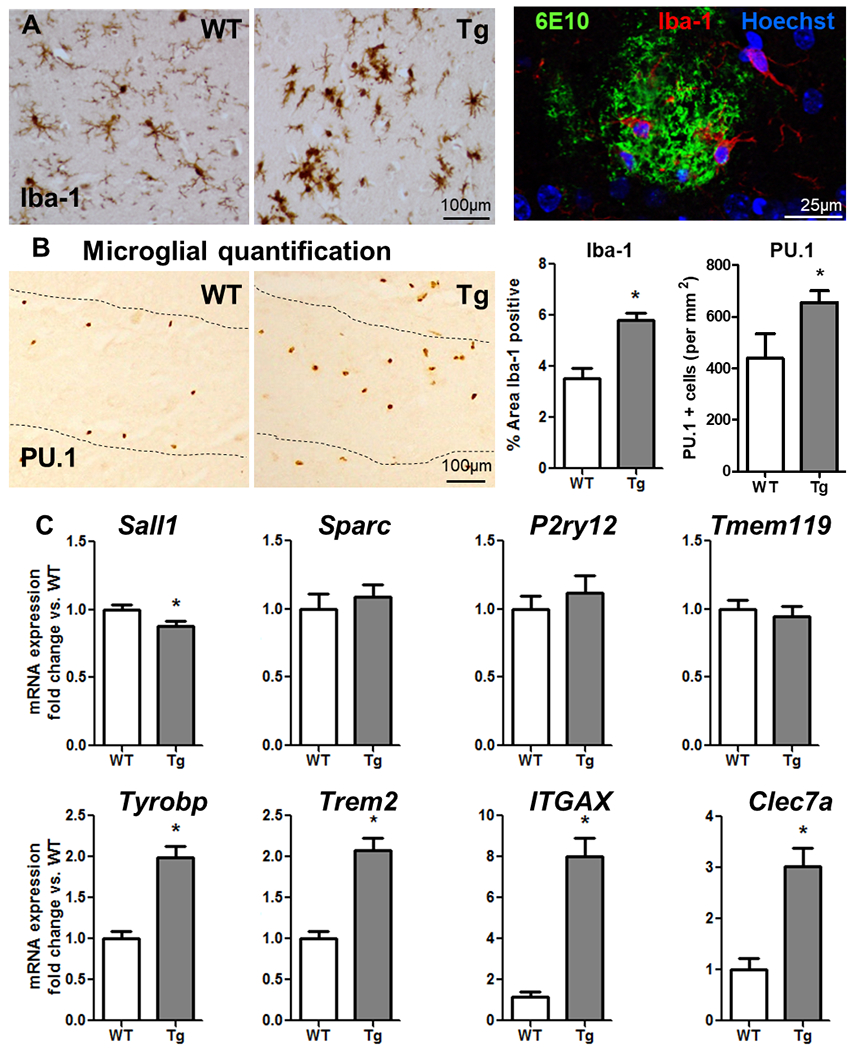
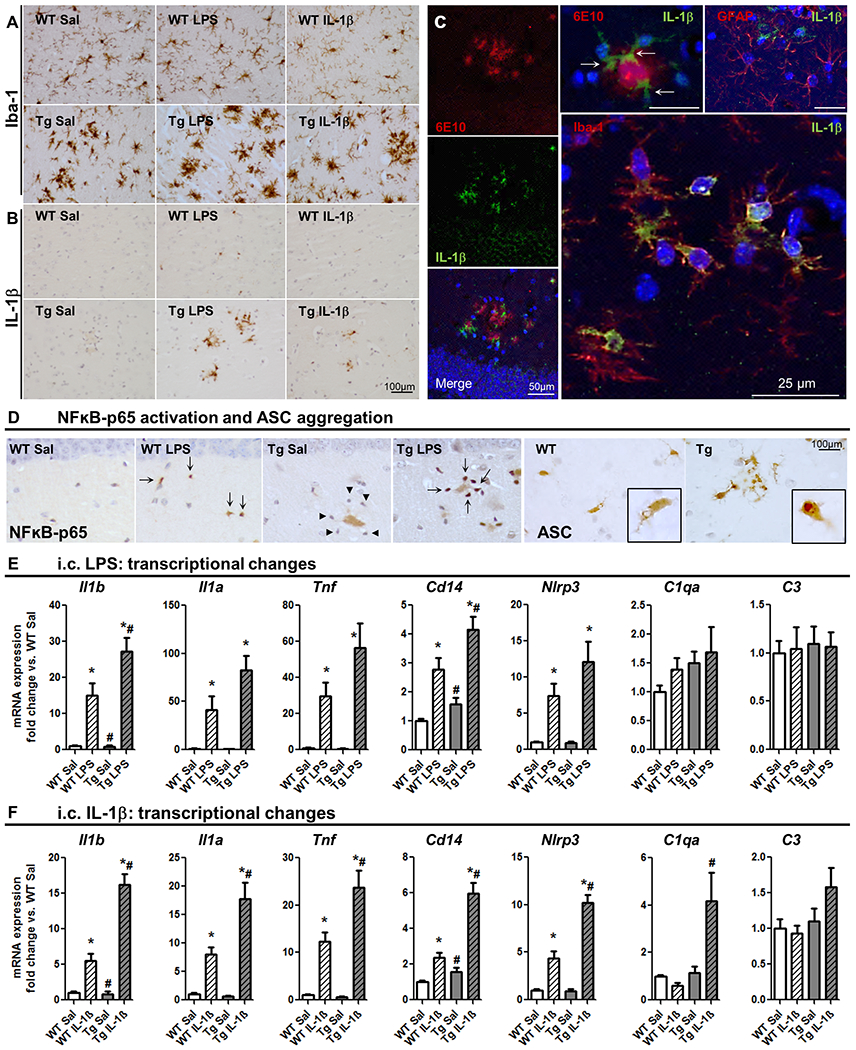
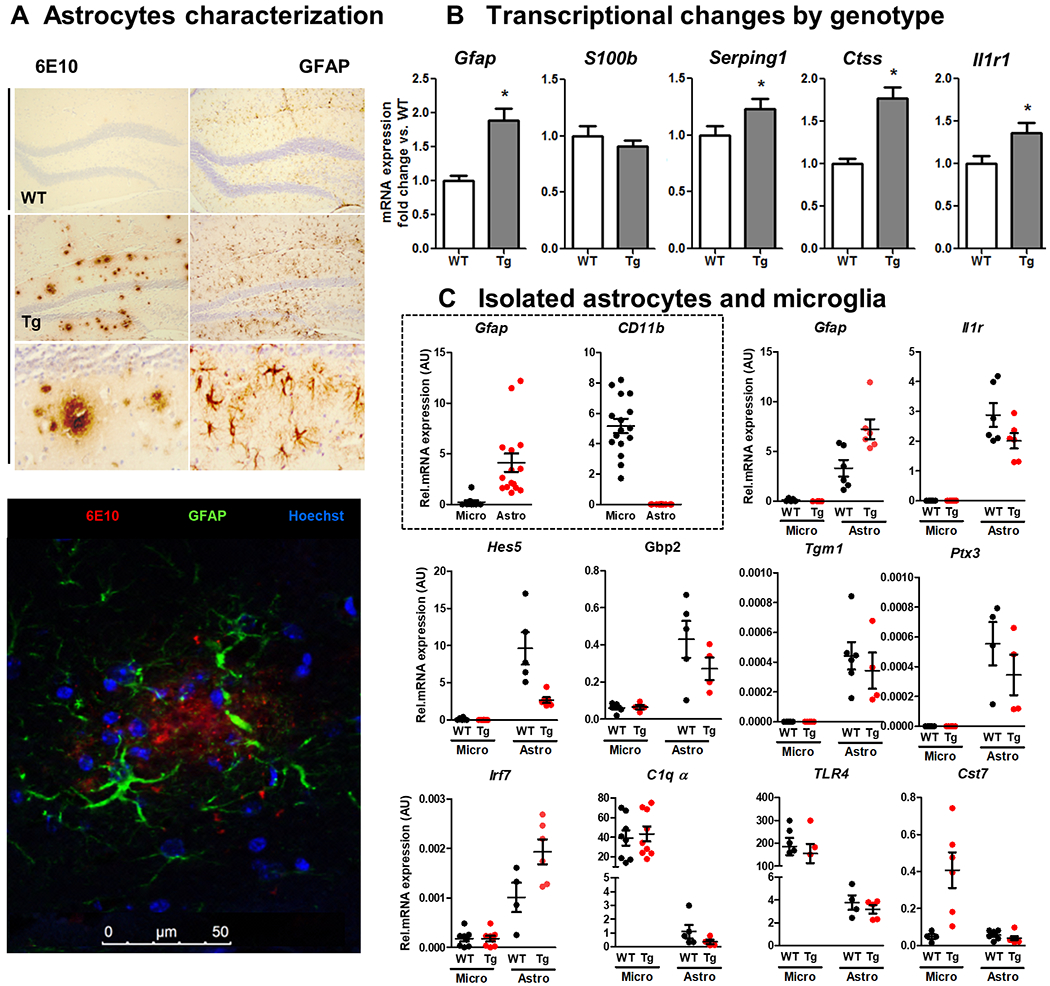
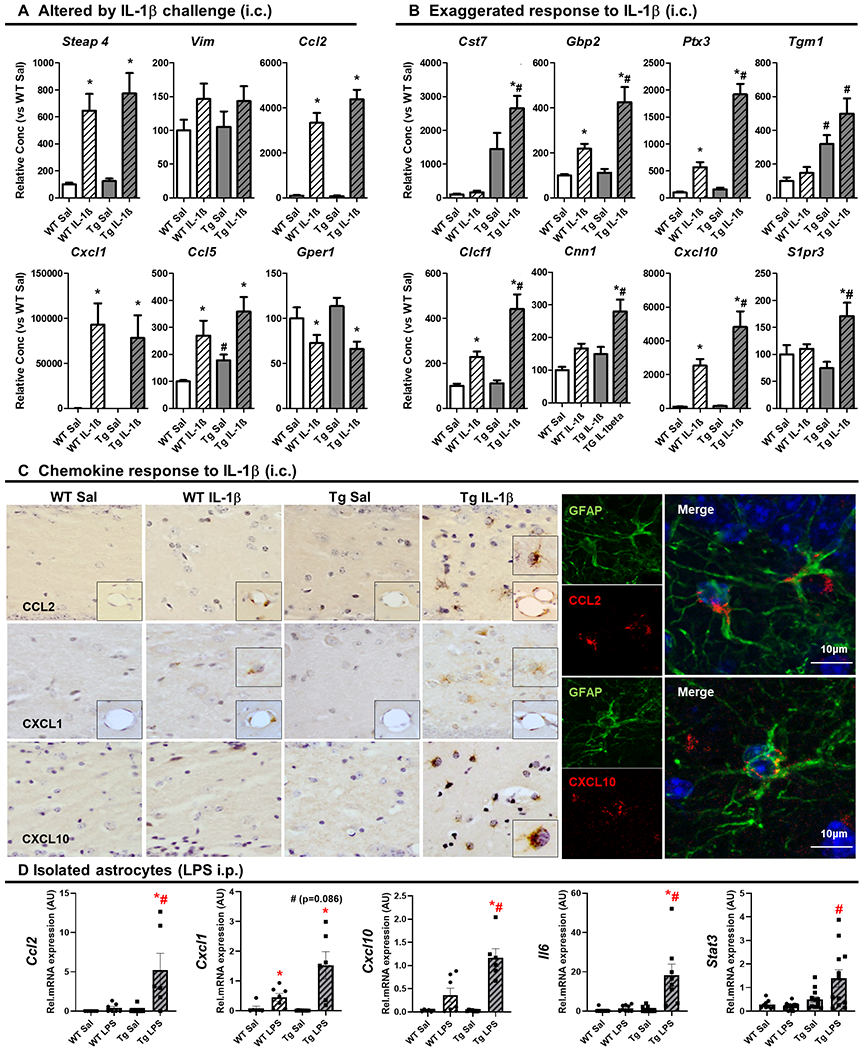
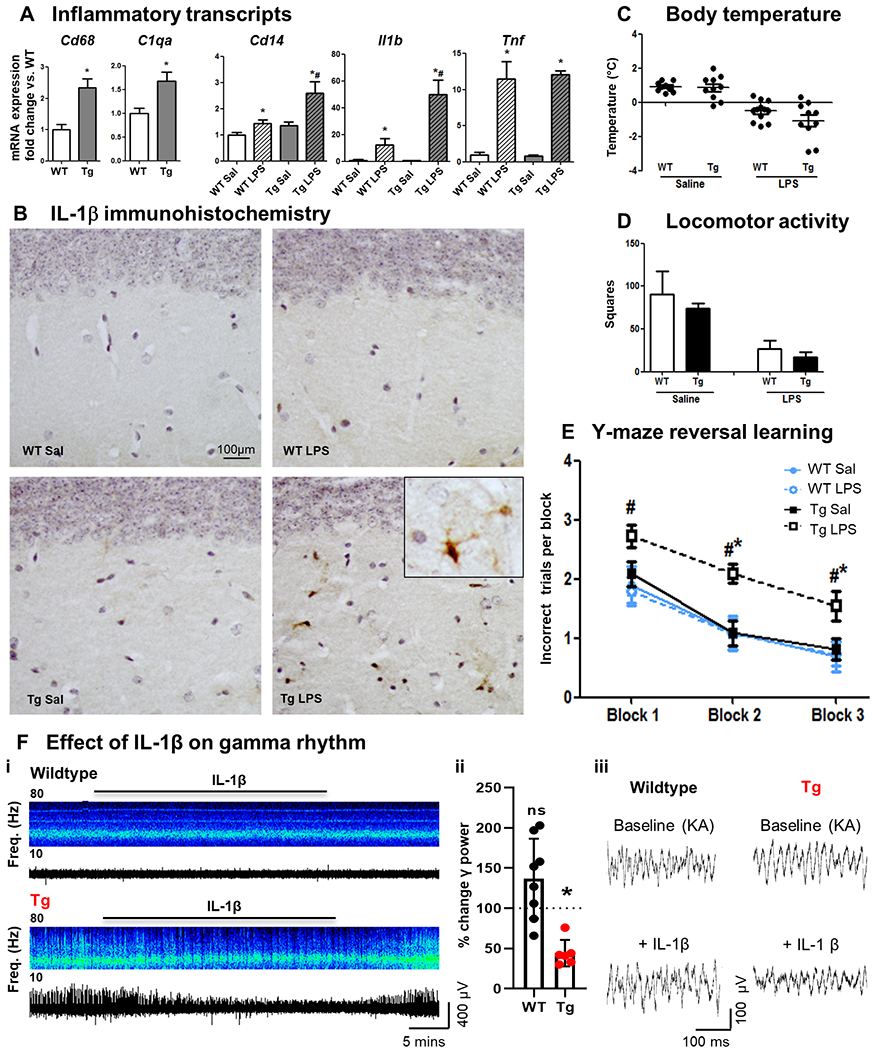
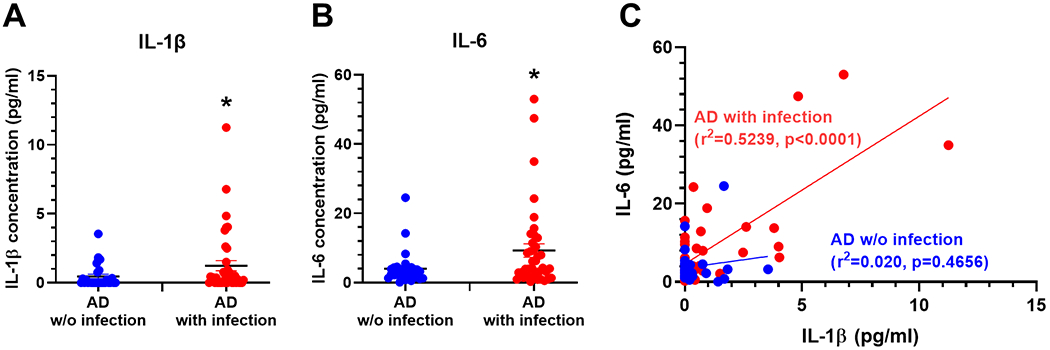
Neuroinflammation contributes to Alzheimer's disease (AD) progression. Secondary inflammatory insults trigger delirium and can accelerate cognitive decline. Individual cellular contributors to this vulnerability require elucidation. Using APP/PS1 mice and AD brain, we studied secondary inflammatory insults to investigate hypersensitive responses in microglia, astrocytes, neurons, and human brain tissue. The NLRP3 inflammasome was assembled surrounding amyloid beta, and microglia were primed, facilitating exaggerated interleukin-1β (IL-1β) responses to subsequent LPS stimulation. Astrocytes were primed to produce exaggerated chemokine responses to intrahippocampal IL-1β. Systemic LPS triggered microglial IL-1β, astrocytic chemokines, IL-6, and acute cognitive dysfunction, whereas IL-1β disrupted hippocampal gamma rhythm, all selectively in APP/PS1 mice. Brains from AD patients with infection showed elevated IL-1β and IL-6 levels. Therefore, amyloid leaves the brain vulnerable to secondary inflammation at microglial, astrocytic, neuronal, and cognitive levels, and infection amplifies neuroinflammatory cytokine synthesis in humans. Exacerbation of neuroinflammation to produce deleterious outcomes like delirium and accelerated disease progression merits careful investigation in humans.

Keywords: APP/PS1; CCL2; IL-1β; astrocyte; chemokine; cytokine; delirium; dementia; gamma; memory; microglia; network dysfunction; neuroinflammation; primed; priming; vulnerability.


Conflict of interest statement

Conflicts of interest. The authors have no competing interests.

Figures

Figure 1.
Figure 1.. Acute inflammatory events occurring in those with evolving amyloid pathology have disproportionate effects on neuroinflammation and cognitive and neurophysiological function compared to those in normal individuals.
When APP/PS1 double transgenic mice and age-matched controls are exposed to equivalent acute LPS challenge, microglia (μ) surrounding amyloid plaques (Aβ) in APP/PS1 mice show exaggerated IL-1β responses, whether the LPS challenges were intracerebral (i.c.) or intraperitoneal (i.p.). In turn, astrocytes (*) from the APP/PS1 brain show exaggerated chemokine and IL-6 responses when exposed to acute IL-1β or LPS challenge. Acute peripheral LPS challenge was sufficient to produce acute cognitive impairment in a Y-maze task of cognitive flexibility and directly applied IL-1β was sufficient to disrupt gamma rhythm in ex vivo cortical-hippocampal networks. Both of these functional impairments occur selectively in APP/PS1 mice. Systemic infection also exacerbated brain inflammation in human Alzheimer’s disease (AD) cases: in patients who died with acute systemic infection, brain levels of IL-1β and IL-6 were higher than in those who did not experience infection and the levels of these 2 cytokines were directly correlated. Therefore the amyloid-laden brain is ‘primed’ at multiple cellular levels, causing heightened vulnerability to acute inflammatory events. Placing this within the context of the slowly evolving progression of Alzheimer’s Disease, one can propose that these cellular and molecular events, occurring within the ‘black box’ of proximal factors, are contributing to episodes of delirium and to the accelerated cognitive trajectory that has been observed in patients who experience delirium before or during their dementia.,
Figure 2.
Figure 2.. Microglial activation in APP/PS1.
(A) Comparison of microglial activation in WT and Tg (APP/PS1, 19±3 months) by Iba-1 labelling, light microscopy and confocal image of Tg brain tissue showing (Aβ plaque labelled with 6E10 (green, 488nm) surrounded by Iba-1-positive microglia (red, 594nm). (B) Comparison of microglial numbers in WT and Tg (APP/PS1, 19±3 months) by PU.1 labelling, light microscopy. Microglial quantification in WT versus Tg and represented as the percentage of Iba-1-positive area and the number of PU.1 positive cells. (C) Hippocampal mRNA for specific microglial markers, expressed as fold change in Tg with respect to WT (age 19±3months). Mean±SEM (WT n=14; Tg n=19). t-test * vs. WT (p < 0.05).
Figure 3.
Figure 3.. Microglial priming in APP/PS1 mice.
Acute challenges (LPS or IL-1β i.c., 2h) superimposed on primed microglia in APP/PS1 (19±3 months). (A) Iba-1 labelling in WT and Tg, treated with saline, 1 μg LPS or 10 ng IL-1β. (B) IL-1 β labelling in the same animals. (C, left stack) Confocal micrographs from Tg+IL1β showing IL-1β -positive cells (green, 488nm) around Aβ plaque, labelled with 6E10 (red, 630nm). Larger panel shows IL-1β positive cells (green, 488nm) co-localised with Iba-1-positive cells (red, 594nm). Upper right panel shows IL-1β positive cells (green, 488nm) that do not overlap with red GFAP-positive cells (594nm). (D) NFkB-p65 labelling (left panels) showing lack of activation in Tg+Sal nuclei (arrowheads) and activation in Tg+LPS (arrows). ASC aggregation (right panels) showing speck formation in Tg but not WT animals (zoom in the insets). (E) Hippocampal mRNA for specific microglial markers after i.c. LPS (fold change with respect to WT; 2h). (F) Hippocampal mRNA for selective microglial markers, after IL-1β i.c. (fold change; 2h). Mean±SEM (n=8-10). Kruskal Wallis Test followed by Mann-Whitney test. * effect of treatment; # effect of genotype (p< 0.05).
Figure 4.
Figure 4.. Astrocytosis and differential expression of gene in isolated astrocytes and microglia in APP/PS1 and WT mice.
(A) Light microscopy labelling of 6E10 (left) and GFAP (right) of WT (first line) and Tg (second and third line). On the bottom, confocal image of Tg brain tissue labelled with 6E10 in red (630nm), green GFAP-positive astrocytes (488nm) surrounding the plaque. (B) B0 Transcriptional changes induced by genotype (WT vs. Tg) in hippocampal bulk mRNA. Aged 19±3 months. Mean±SEM (n=8-10) * vs. WT, t-test (p<0.05). (C) Transcriptional changes in isolated astrocytes and microglia from the hippocampus of WT and Tg mice. The first two graphs represent the purity of the isolated populations assessed by Gfap (for astrocytes) and CD11b (for microglia). The following panel are astrocytic-specific genes and the bottom row shows mostly microglia-specific genes (excepting Irf7, which is astrocytic and elevated in Tg).
Figure 5.
Figure 5.. Astrocytes are primed to show exaggerated chemokine production in APP/PS1.
(A) Transcriptional changes induced by intracerebral (i.c.) IL-1β challenge (10ng) in hippocampal mRNA levels of selected astrocyte-associated genes, 2 h after challenge, expressed as fold change with respect to WT+Sal. Aged 19±3months. Mean ±SEM (n=8-10). (B) Exaggerated response to IL-1β challenge (10ng, i.c.) in hippocampal mRNA levels of selected astrocyte-associated genes, 2 h after challenge, expressed as fold change with respect to WT+Sal. Aged 19±3months. Mean ±SEM (n=8-10). (C) Chemokine response to IL-1β challenge (10ng, i.c.) Light microscopy labelling of CCL2, CXCL1 and CXCL10 in WT and Tg mice, 2 h after i.c. challenge with IL-1β (10 ng) or saline. Right panel shows the confocal imaging of Tg+IL-1β group for CCL2 (red; 594nm) and GFAP (green; 488nm) on the left and CXCL10 (red; 594nm) and GFAP (green; 488nm) on the right. (D) Transcriptional changes in isolated astrocytes of the selected chemokines together with Il6 and Stat3, Ccl2, Cxcl1 and Cxcl10, using a systemic inflammation model (3 h after LPS (250μg/kg, intraperitoneal, i.p.)). Aged 14±2months. Mean ±SEM (n=6-13). Kruskal Wallis Test followed by Mann-Whitney test, * effect of treatment; # effect of genotype (p < 0.05).
Figure 6.
Figure 6.. Systemic LPS, IL-1β, acute cognitive dysfunction & gamma rhythm disruption in APP/PS1 mice
(A) Hippocampal mRNA (fold change) in selected microglial markers in APP/PS1 and WT mice (16±1 month) 2 h after LPS (100 μg/kg i.p.) challenge (Mean±SEM, n=5-7). (B) IL-1β staining in animals under the same conditions. (C) Deviation from baseline body temperature. (D) Locomotor activity in 3 minutes in the open field. (E) Reversal learning in Y maze. Mean±SEM (n=10-15). Kruskal Wallis Test. * effect of treatment; # effect of genotype (p < 0.05). (F) Effect of IL-1β (10 ng/ml) on gamma rhythm in WT and Tg brain slices. (i) Example long time-course local field potential traces of kainate-evoked (50-100 nM) persistent gamma frequency oscillations, treated acutely with IL-1β and recovering on washout. (ii) % Reduction in the power of gamma oscillations induced by acute IL-1β in WT/Tg mice. Mean±SEM (WT: n=9; Tg: n=22). * WT vs. Tg (p <0.05). (iii) Example short time course local field potential traces showing kainate-evoked gamma oscillations challenged acutely with IL-1β.
Figure 7.
Figure 7.. IL-6 and IL-1β levels in brain homogenates from AD patients.
AD patients that concomitantly presented with infection at time of death (red dots, n=39) show significantly higher levels of IL-1β (A) and IL-6 (B) than AD patients without an infection (blue dots, n=28). Mann-Whitney test, one-tailed (a priori prediction of elevated IL-1β). Mean±SEM (AD without infection n=28; AD with infection n=39; * denotes p<0.05 by Mann-Whitney test). (C) Linear regression plot of IL-6 levels vs. IL-1β levels with separate equations of lines for infection and uninfected cases and Pearson correlations. Shows positive and significant correlation between IL-6 and IL-1β levels in AD patients with infection (y=3.780x+4.576; r2=0.5239, p<0.0001) but not in patients without infection (y=0.8298x+3.59; r2=0.020, p=0.4656).

References

    1. Clark CM, Sheppard L, Fillenbaum GG, et al. Variability in annual Mini-Mental State Examination score in patients with probable Alzheimer disease: a clinical perspective of data from the Consortium to Establish a Registry for Alzheimer’s Disease. Arch Neurol. 1999;56(7):857–862. - PubMed
    1. Holmes C, Lovestone S. Long-term cognitive and functional decline in late onset Alzheimer’s disease: therapeutic implications. Age Ageing. 2003;32(2):200–204. - PubMed
    1. Cunningham C, Hennessy E. Co-Morbidity and Systemic Inflammation as Drivers of Cognitive Decline: New Experimental Models Adopting a Broader Paradigm in Dementia Research. Vol 7. BioMed Central; 2015:33. - PMC - PubMed
    1. Semmler A, Widmann CN, Okulla T, et al. Persistent cognitive impairment, hippocampal atrophy and EEG changes in sepsis survivors. J Neurol Neurosurg Psychiatry. 2013;84(1):62–69. - PubMed
    1. Pandharipande PP, Girard TD, Jackson JC, et al. Long-Term Cognitive Impairment after Critical Illness. N Engl J Med. 2013;369(14):1306–1316. - PMC - PubMed

Publication types