

Application of physiologically based biopharmaceutics modeling to understand the impact of dissolution differences on in vivo performance of immediate release products: The case of bisoprolol
- PMID: 34080804
- PMCID: PMC8213417
- DOI: 10.1002/psp4.12634
Application of physiologically based biopharmaceutics modeling to understand the impact of dissolution differences on in vivo performance of immediate release products: The case of bisoprolol
Abstract
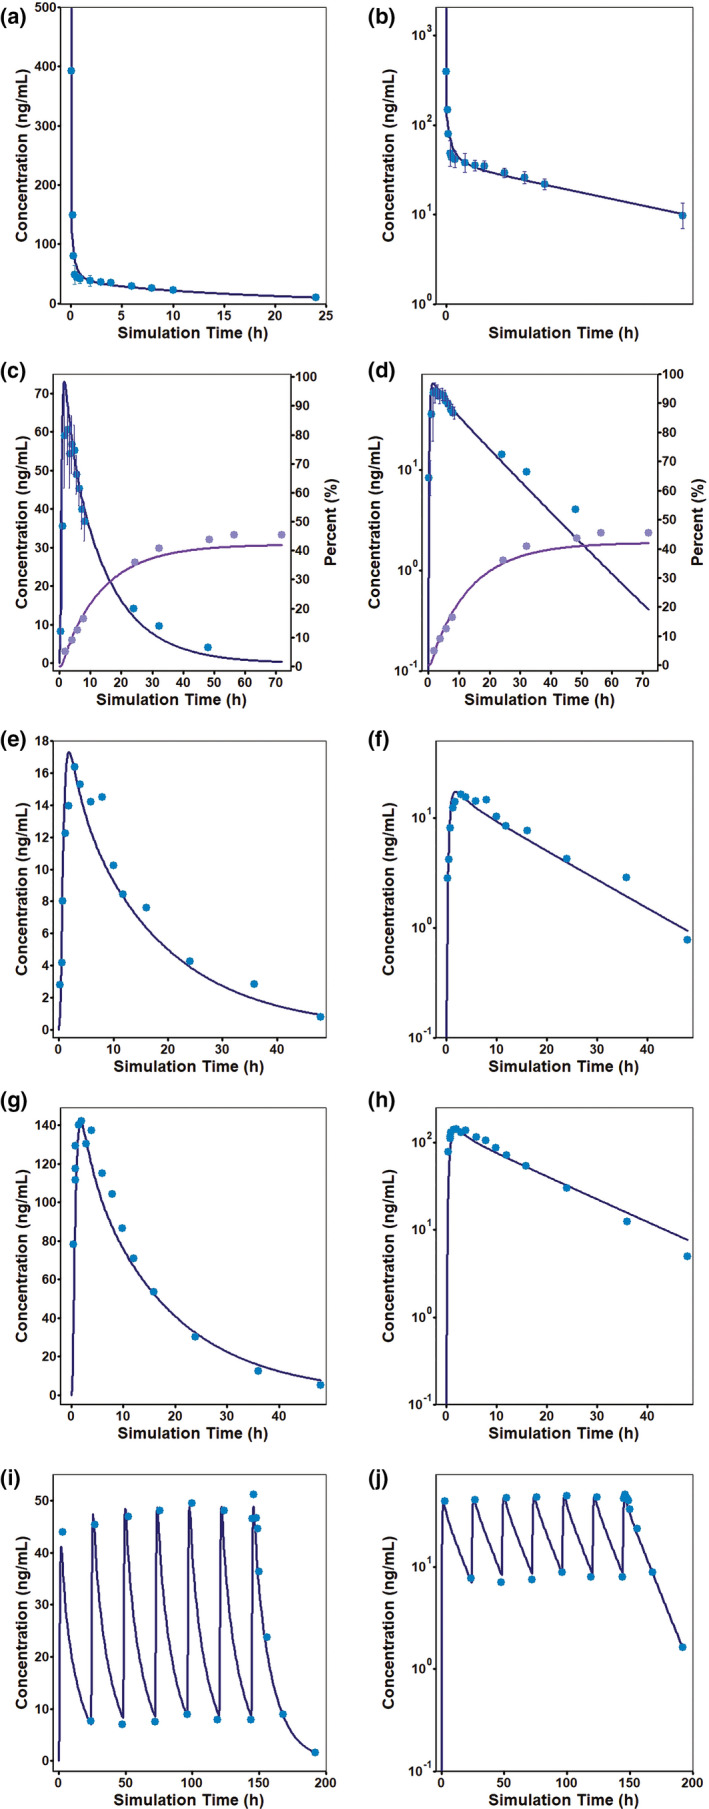
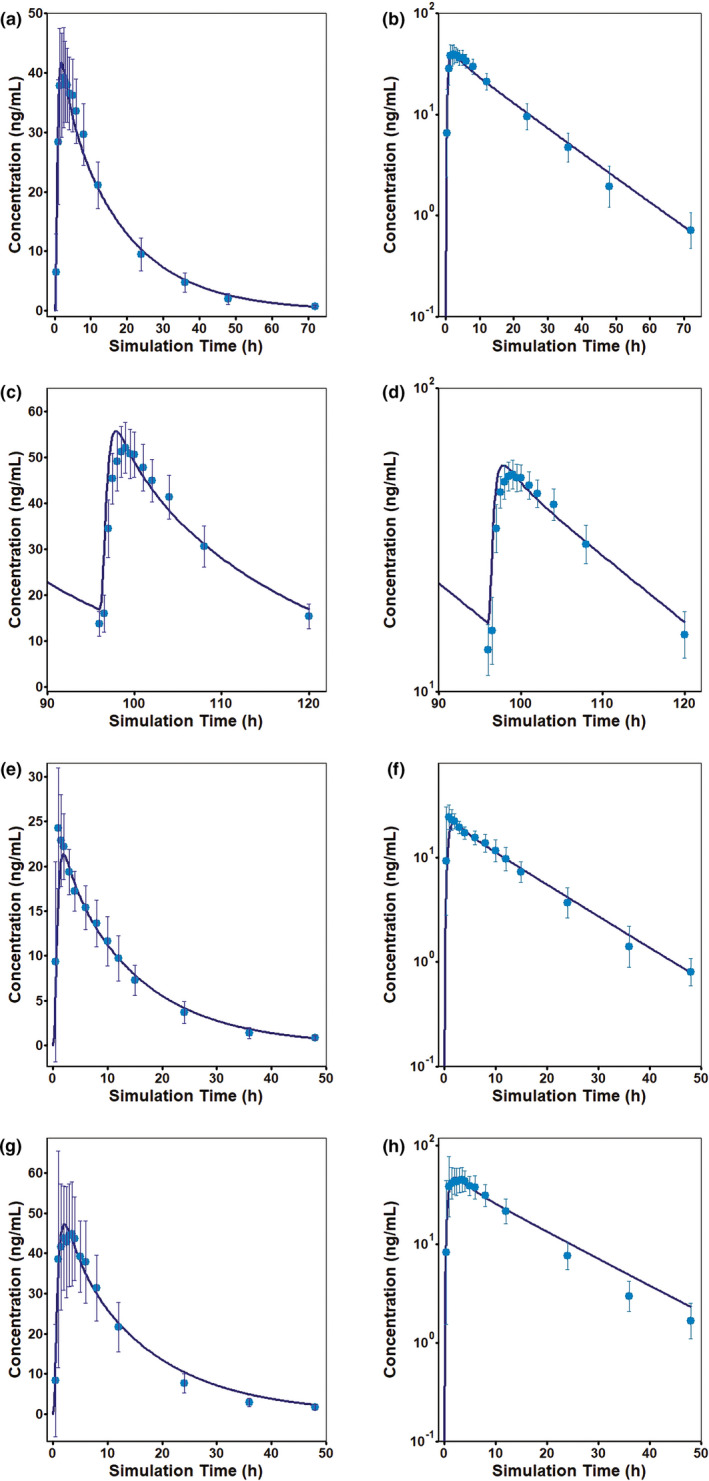
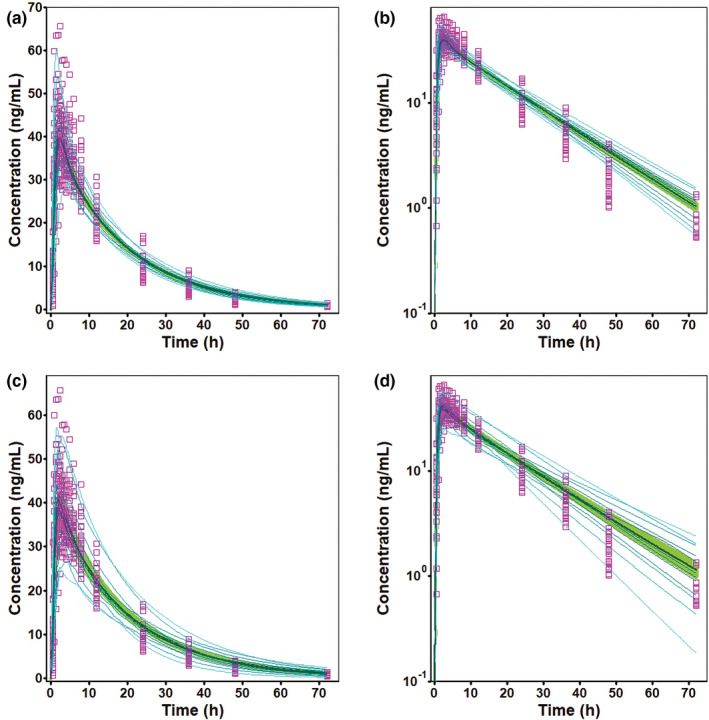
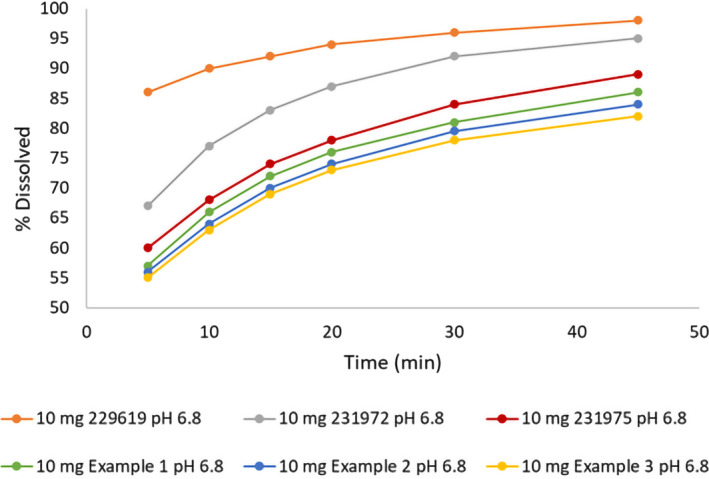
Merck KGaA observed slight differences in the dissolution of Concor® (bisoprolol) batches over the years. The purpose of this work was to assess the impact of in vitro dissolution on the simulated pharmacokinetics of bisoprolol using in vitro-in vivo relationship established with available in vitro dissolution and corresponding plasma concentrations-time data for several bisoprolol batches. A mechanistic absorption model/physiologically based pharmacokinetics model linked with a biopharmaceutics tool such as dissolution testing, namely, physiologically based biopharmaceutics modeling (PBBM), can be valuable in determining a dissolution "safe space." A PBBM for bisoprolol was built using in vitro, in silico, and clinical data. We evaluated potential influences of variability in dissolution of bisoprolol batches on its clinical performance through PBBM and virtual bioequivalence (BE) trials. We demonstrated that in vitro dissolution was not critical for the clinical performance of bisoprolol over a wide range of tested values. Based on virtual BE trials, safe space expansion was explored using hypothetical dissolution data. A formulation with in vitro dissolution reaching 70% dissolved in 15 min and 79.5% in 30 min was shown to be BE to classical fast dissolution of bisoprolol (>85% within 15 min), as point estimates and 90% confidence intervals of the maximum plasma concentration and area under the concentration-time curve were within the BE limits (0.8-1.25).
© 2021 Merck Healthcare KGaA. Pharmacometrics & Systems Pharmacology published by Wiley Periodicals LLC on behalf of American Society for Clinical Pharmacology and Therapeutics.
Conflict of interest statement
J.S.M. and G.F. are employees of Simulations Plus, Inc., developer GastroPlus®. M.B., P.K., and S.A.P. are employed by Merck KGaA, producer Concor®.
Figures
References
-
- US Food and Drug Administration . Impact story: modeling tools could modernize generic drug development. https://www.fda.gov/drugs/regulatory‐science‐action/impact‐story‐modelin.... Accessed July 19, 2020.
-
- Pepin XJH, Parrott N, Dressman J, et al. Current state and future expectations of translational modeling strategies to support drug product development, manufacturing changes and controls: a workshop summary report. J Pharm Sci. 2020;110:555‐566. - PubMed
-
- Leopold G, Pabst J, Ungethum W, Buhring KU. Basic pharmacokinetics of bisoprolol, a new highly beta 1‐selective adrenoceptor antagonist. J Clin Pharmacol. 1986;26:616‐621. - PubMed
-
- Leopold G. Balanced pharmacokinetics and metabolism of bisoprolol. J Cardiovasc Pharmacol. 1986;8(suppl 11):S16‐S20. - PubMed
-
- Bethge H, Leopold G, Wagner G. Bisoprolol in angina pectoris. Cardiovasc Drug Rev. 1991;9:110‐122.
Publication types
MeSH terms
Substances
LinkOut - more resources
Full Text Sources
Medical
