. 2021 Jun 15;93(23):8210-8218.
doi: 10.1021/acs.analchem.1c00784. Epub 2021 Jun 3.

Fast 19F Magic Angle Spinning NMR Crystallography for Structural Characterization of Fluorine-Containing Pharmaceutical Compounds

Affiliations

Fast 19F Magic Angle Spinning NMR Crystallography for Structural Characterization of Fluorine-Containing Pharmaceutical Compounds

Changmiao Guo et al. Anal Chem. .

Abstract

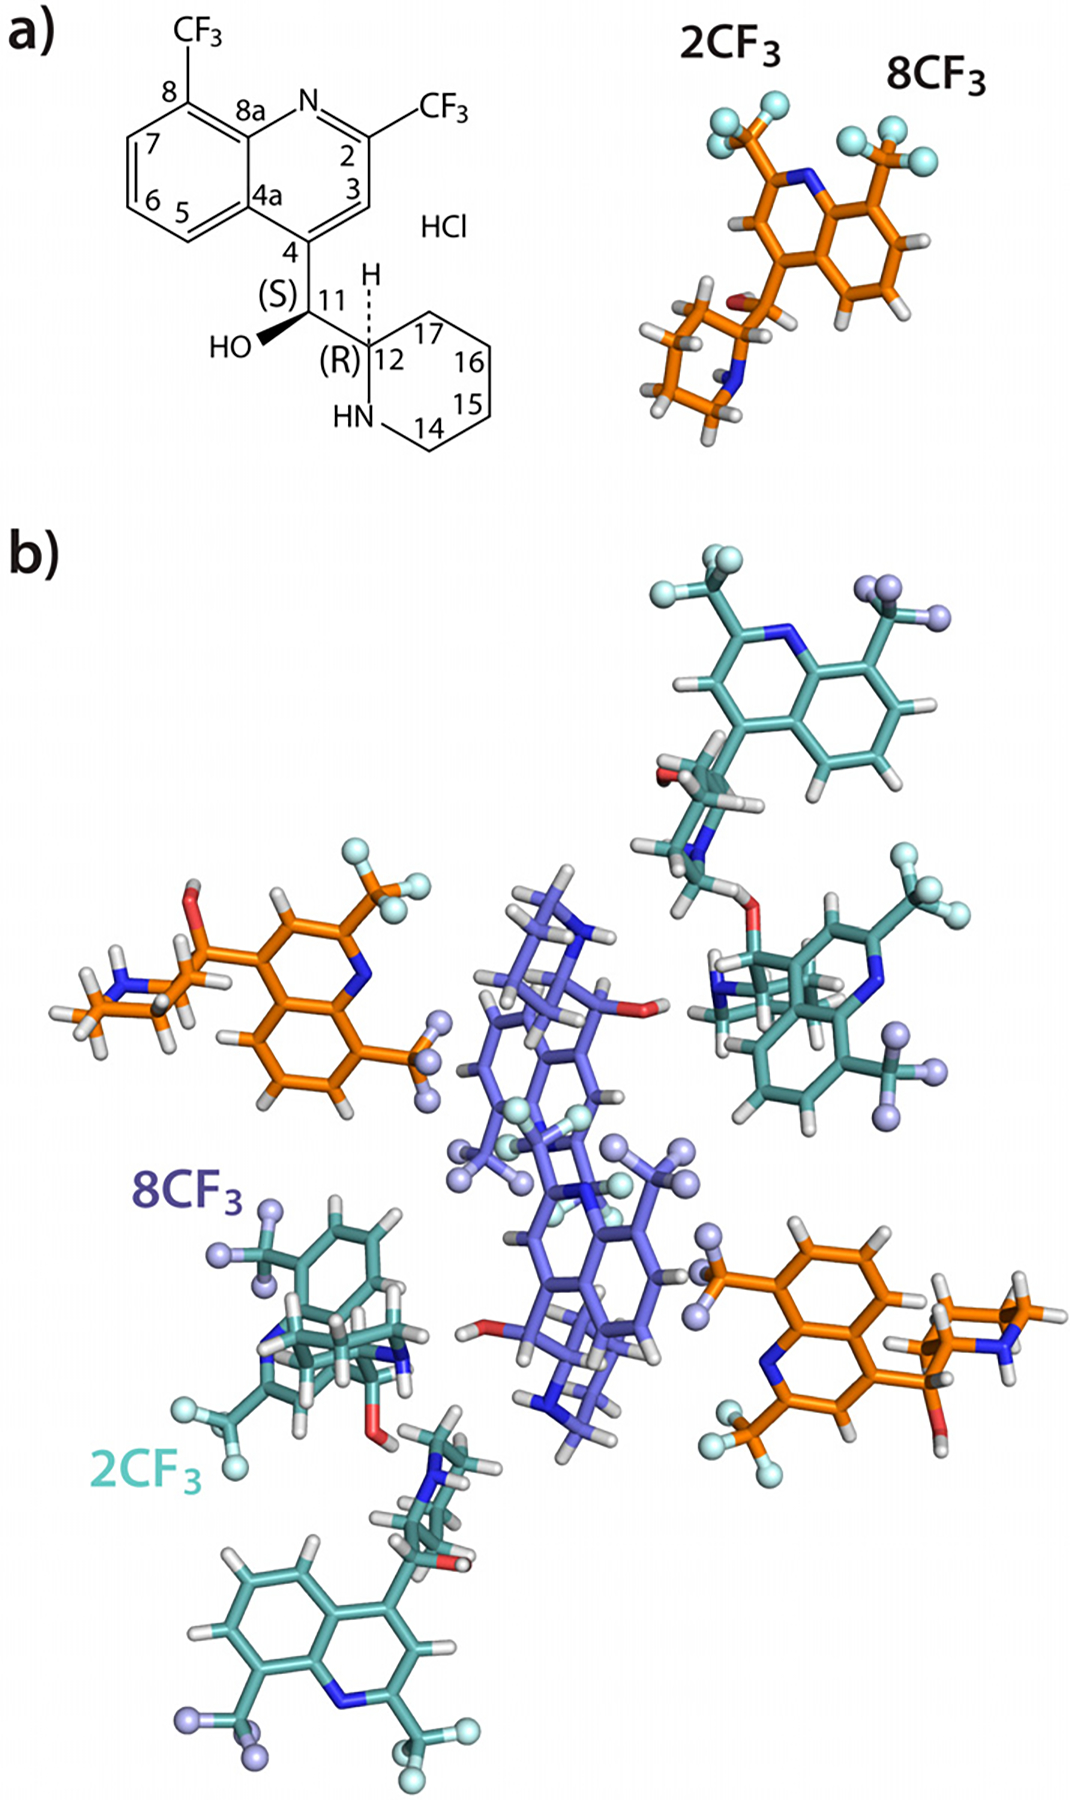
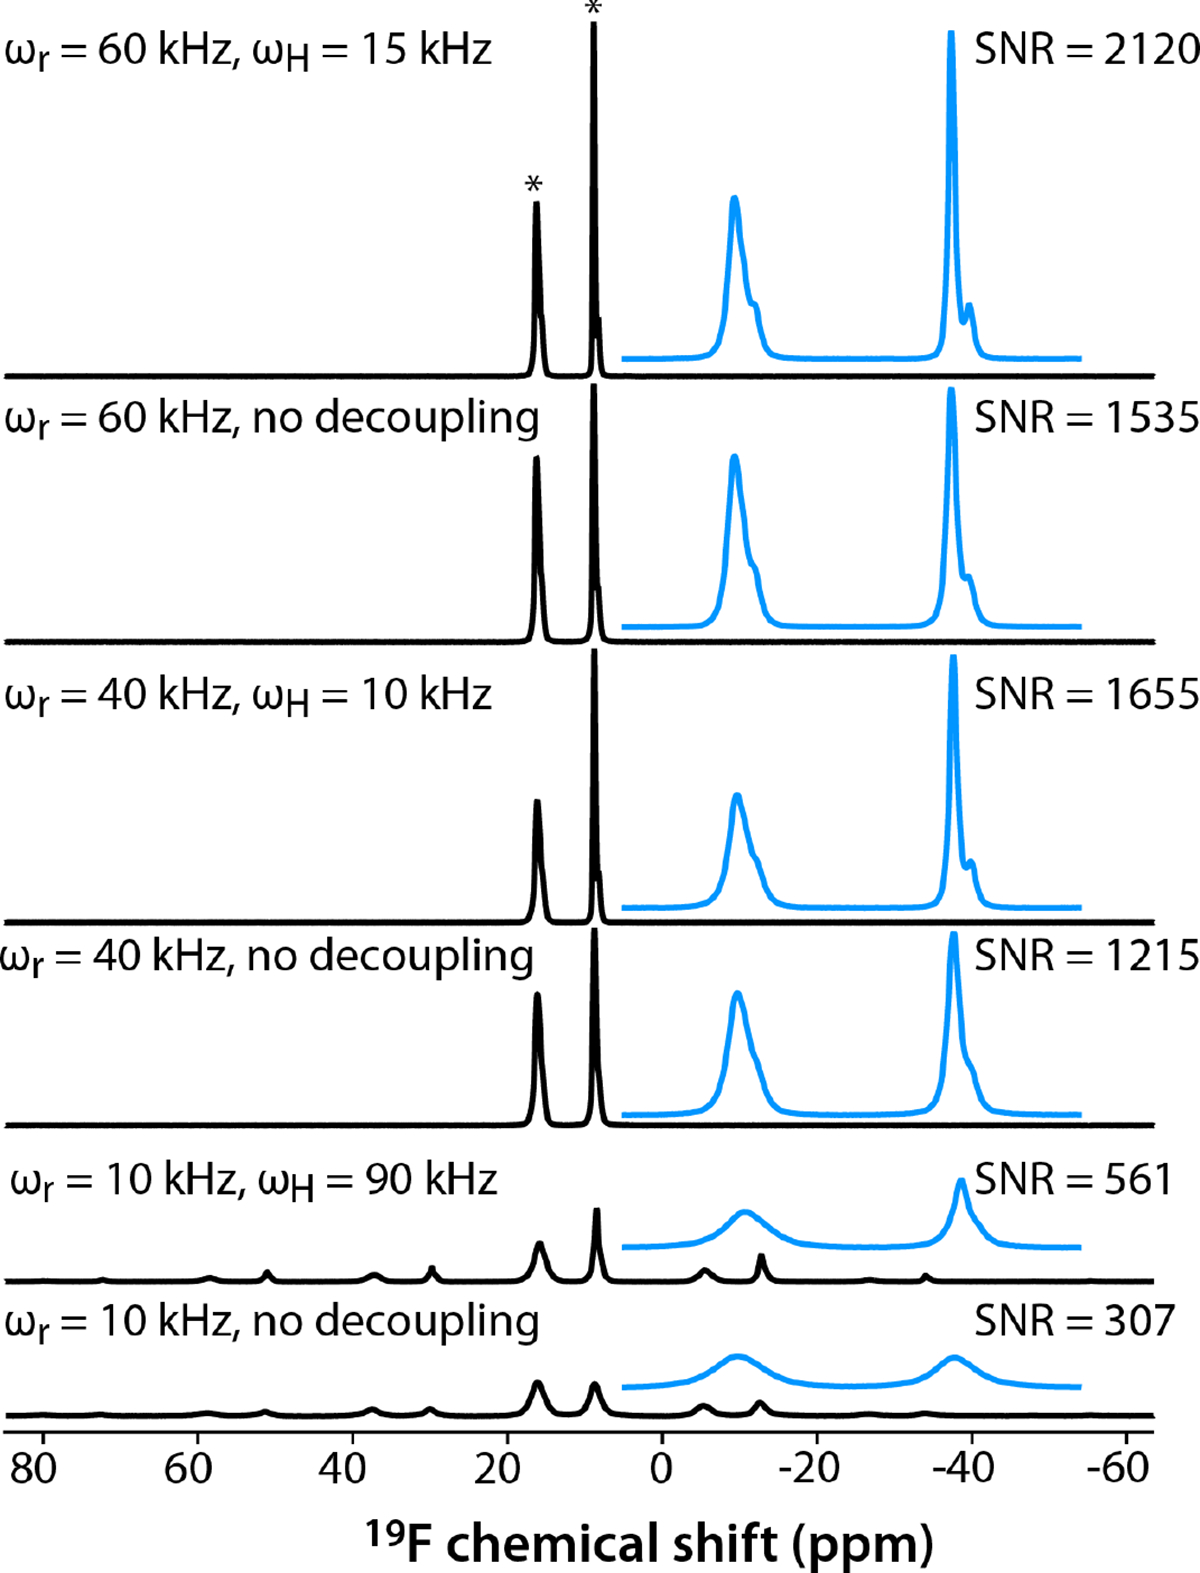
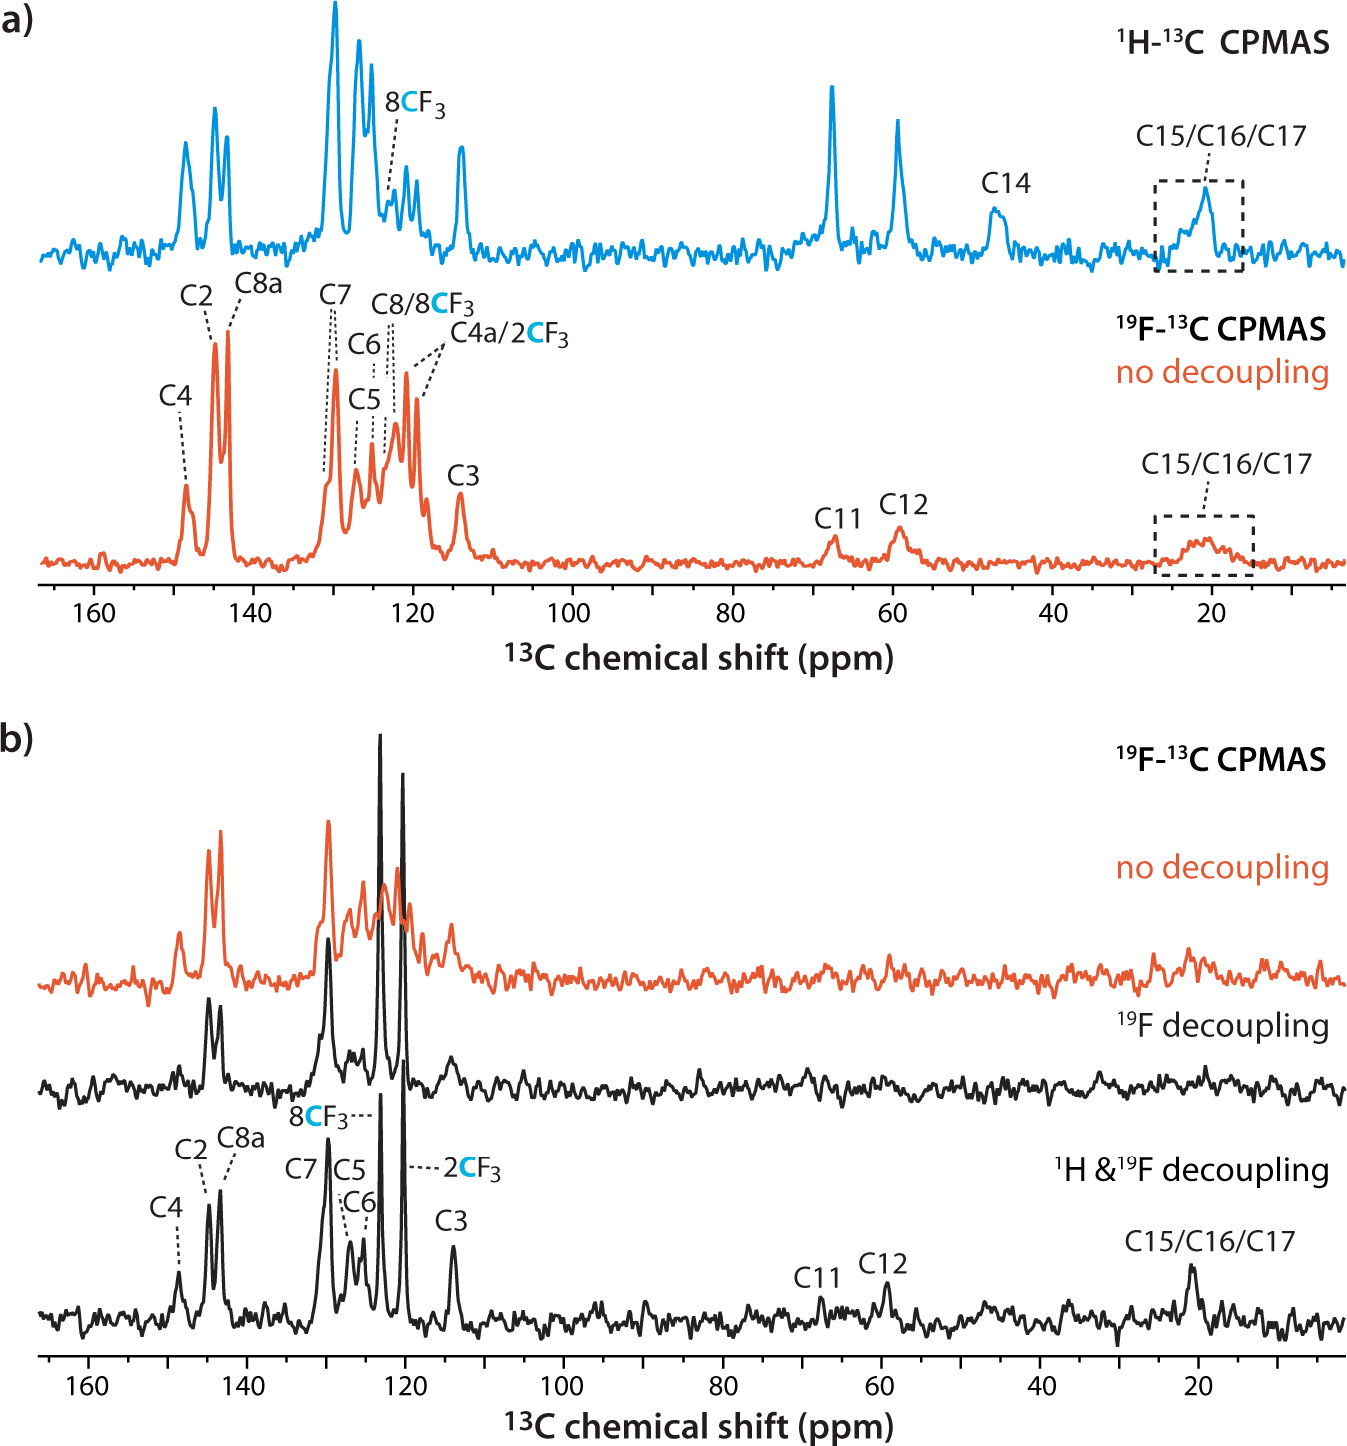
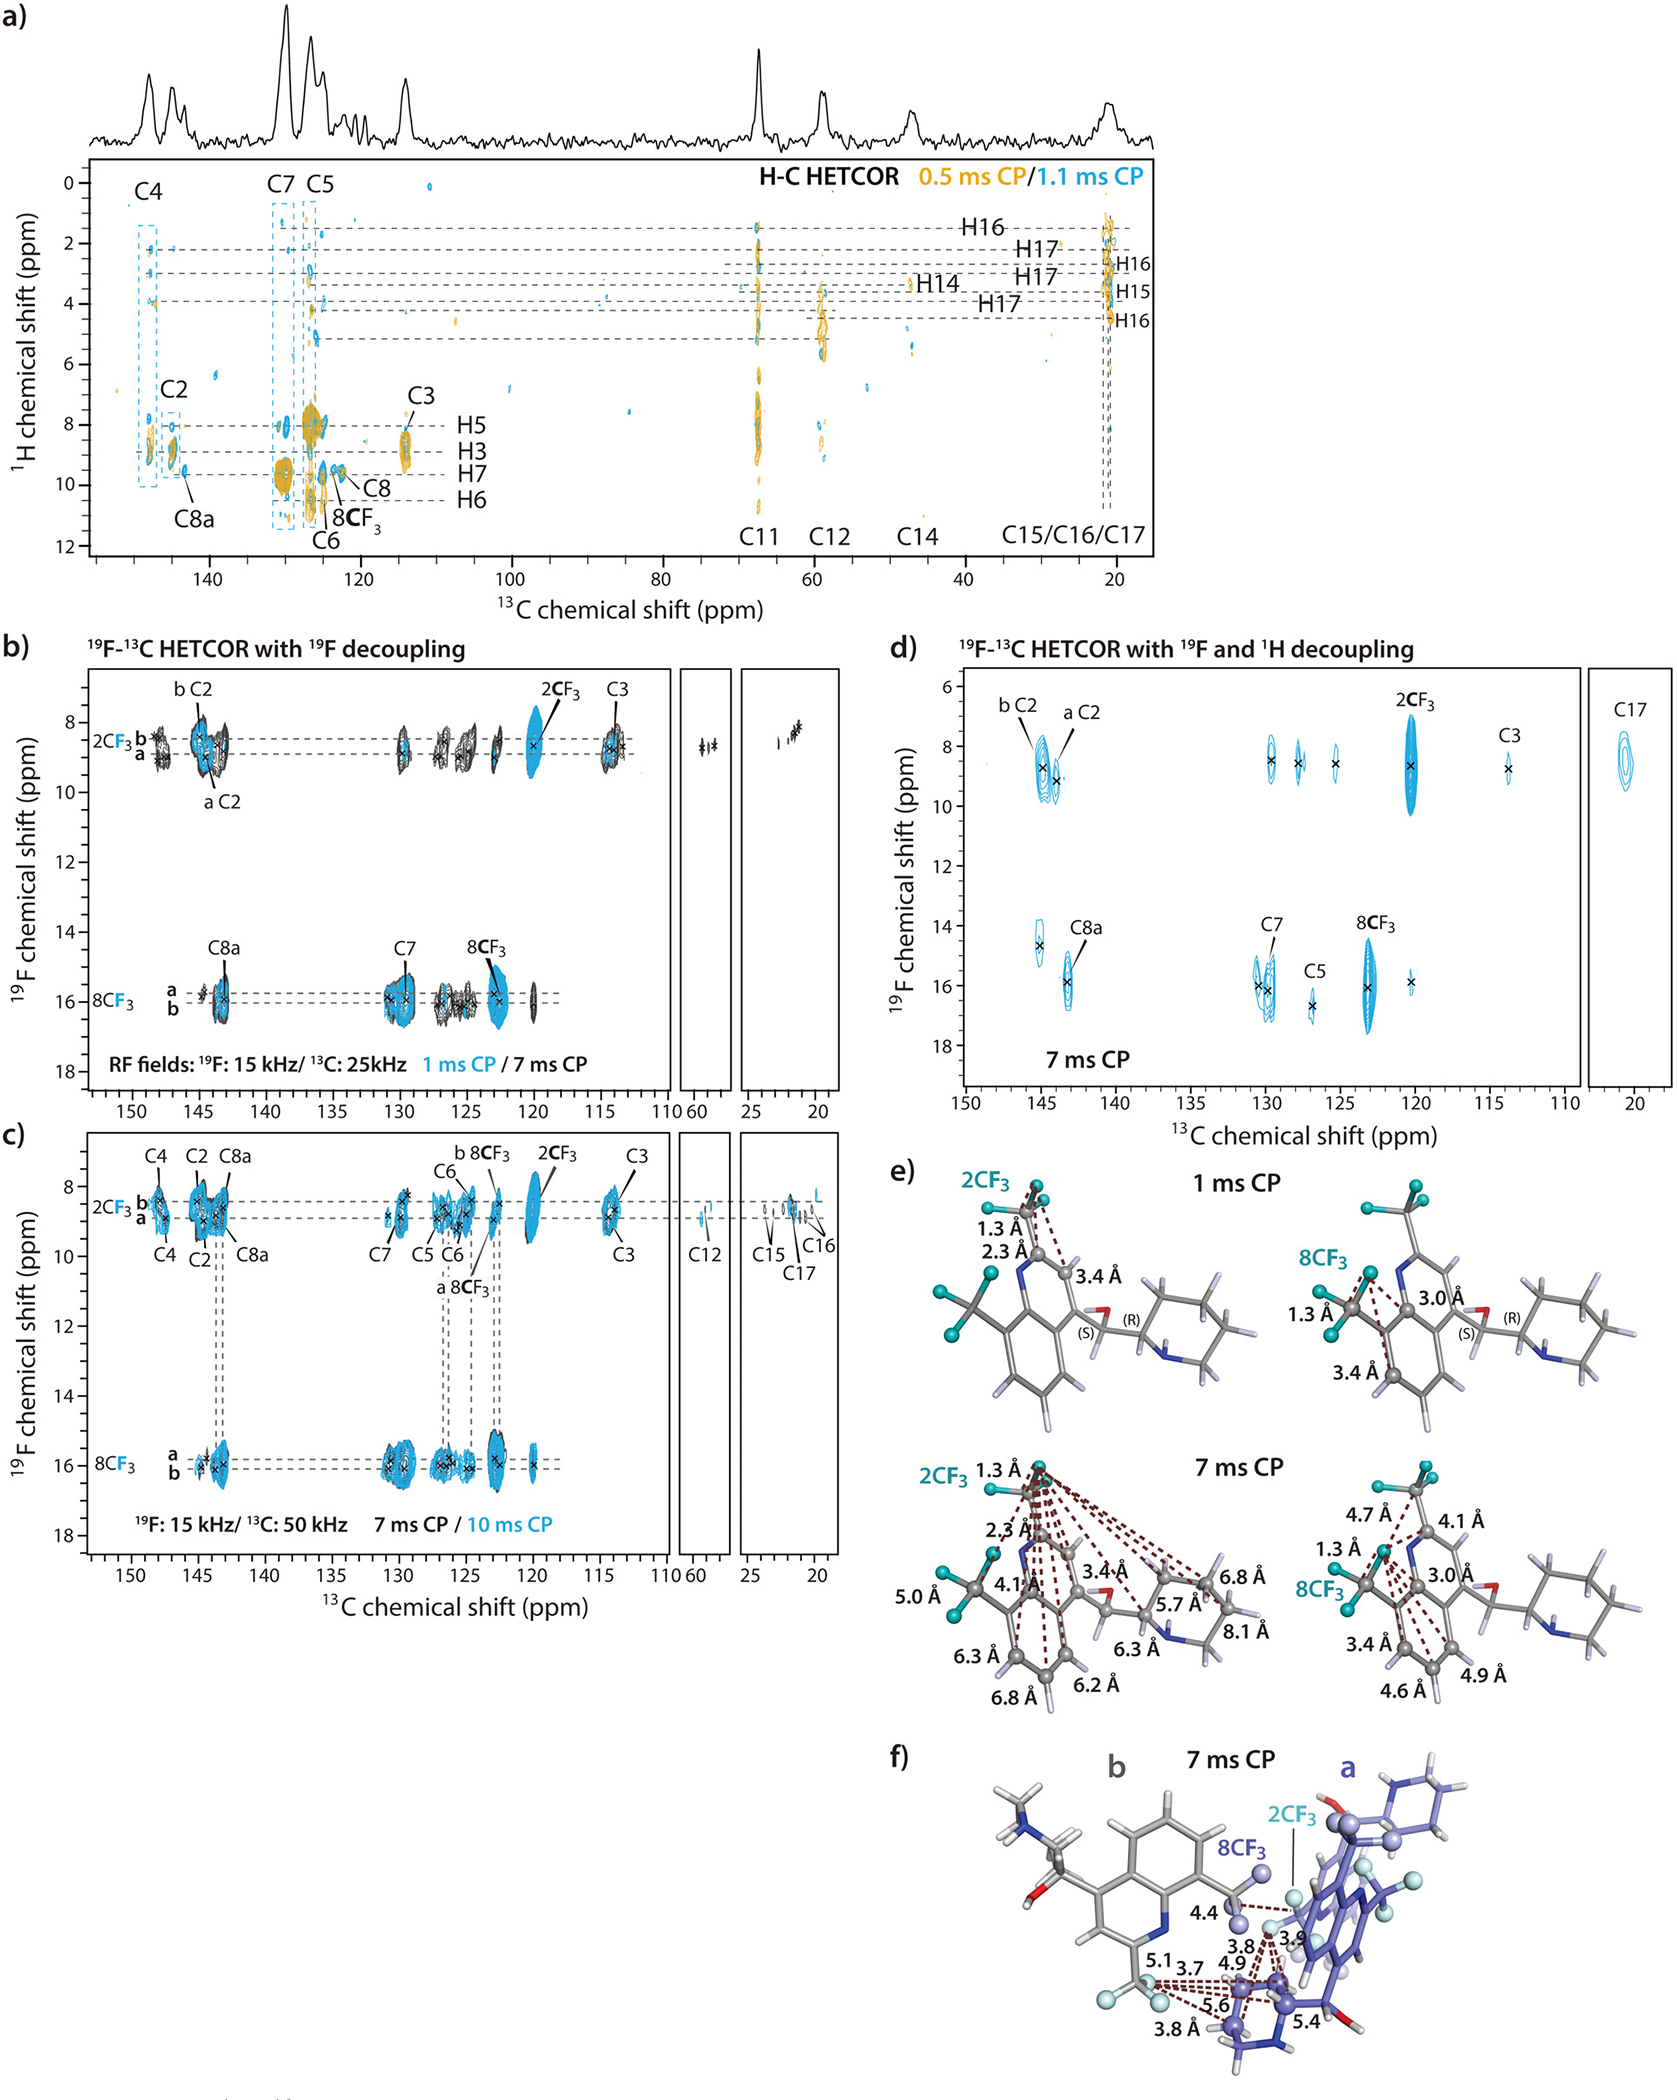
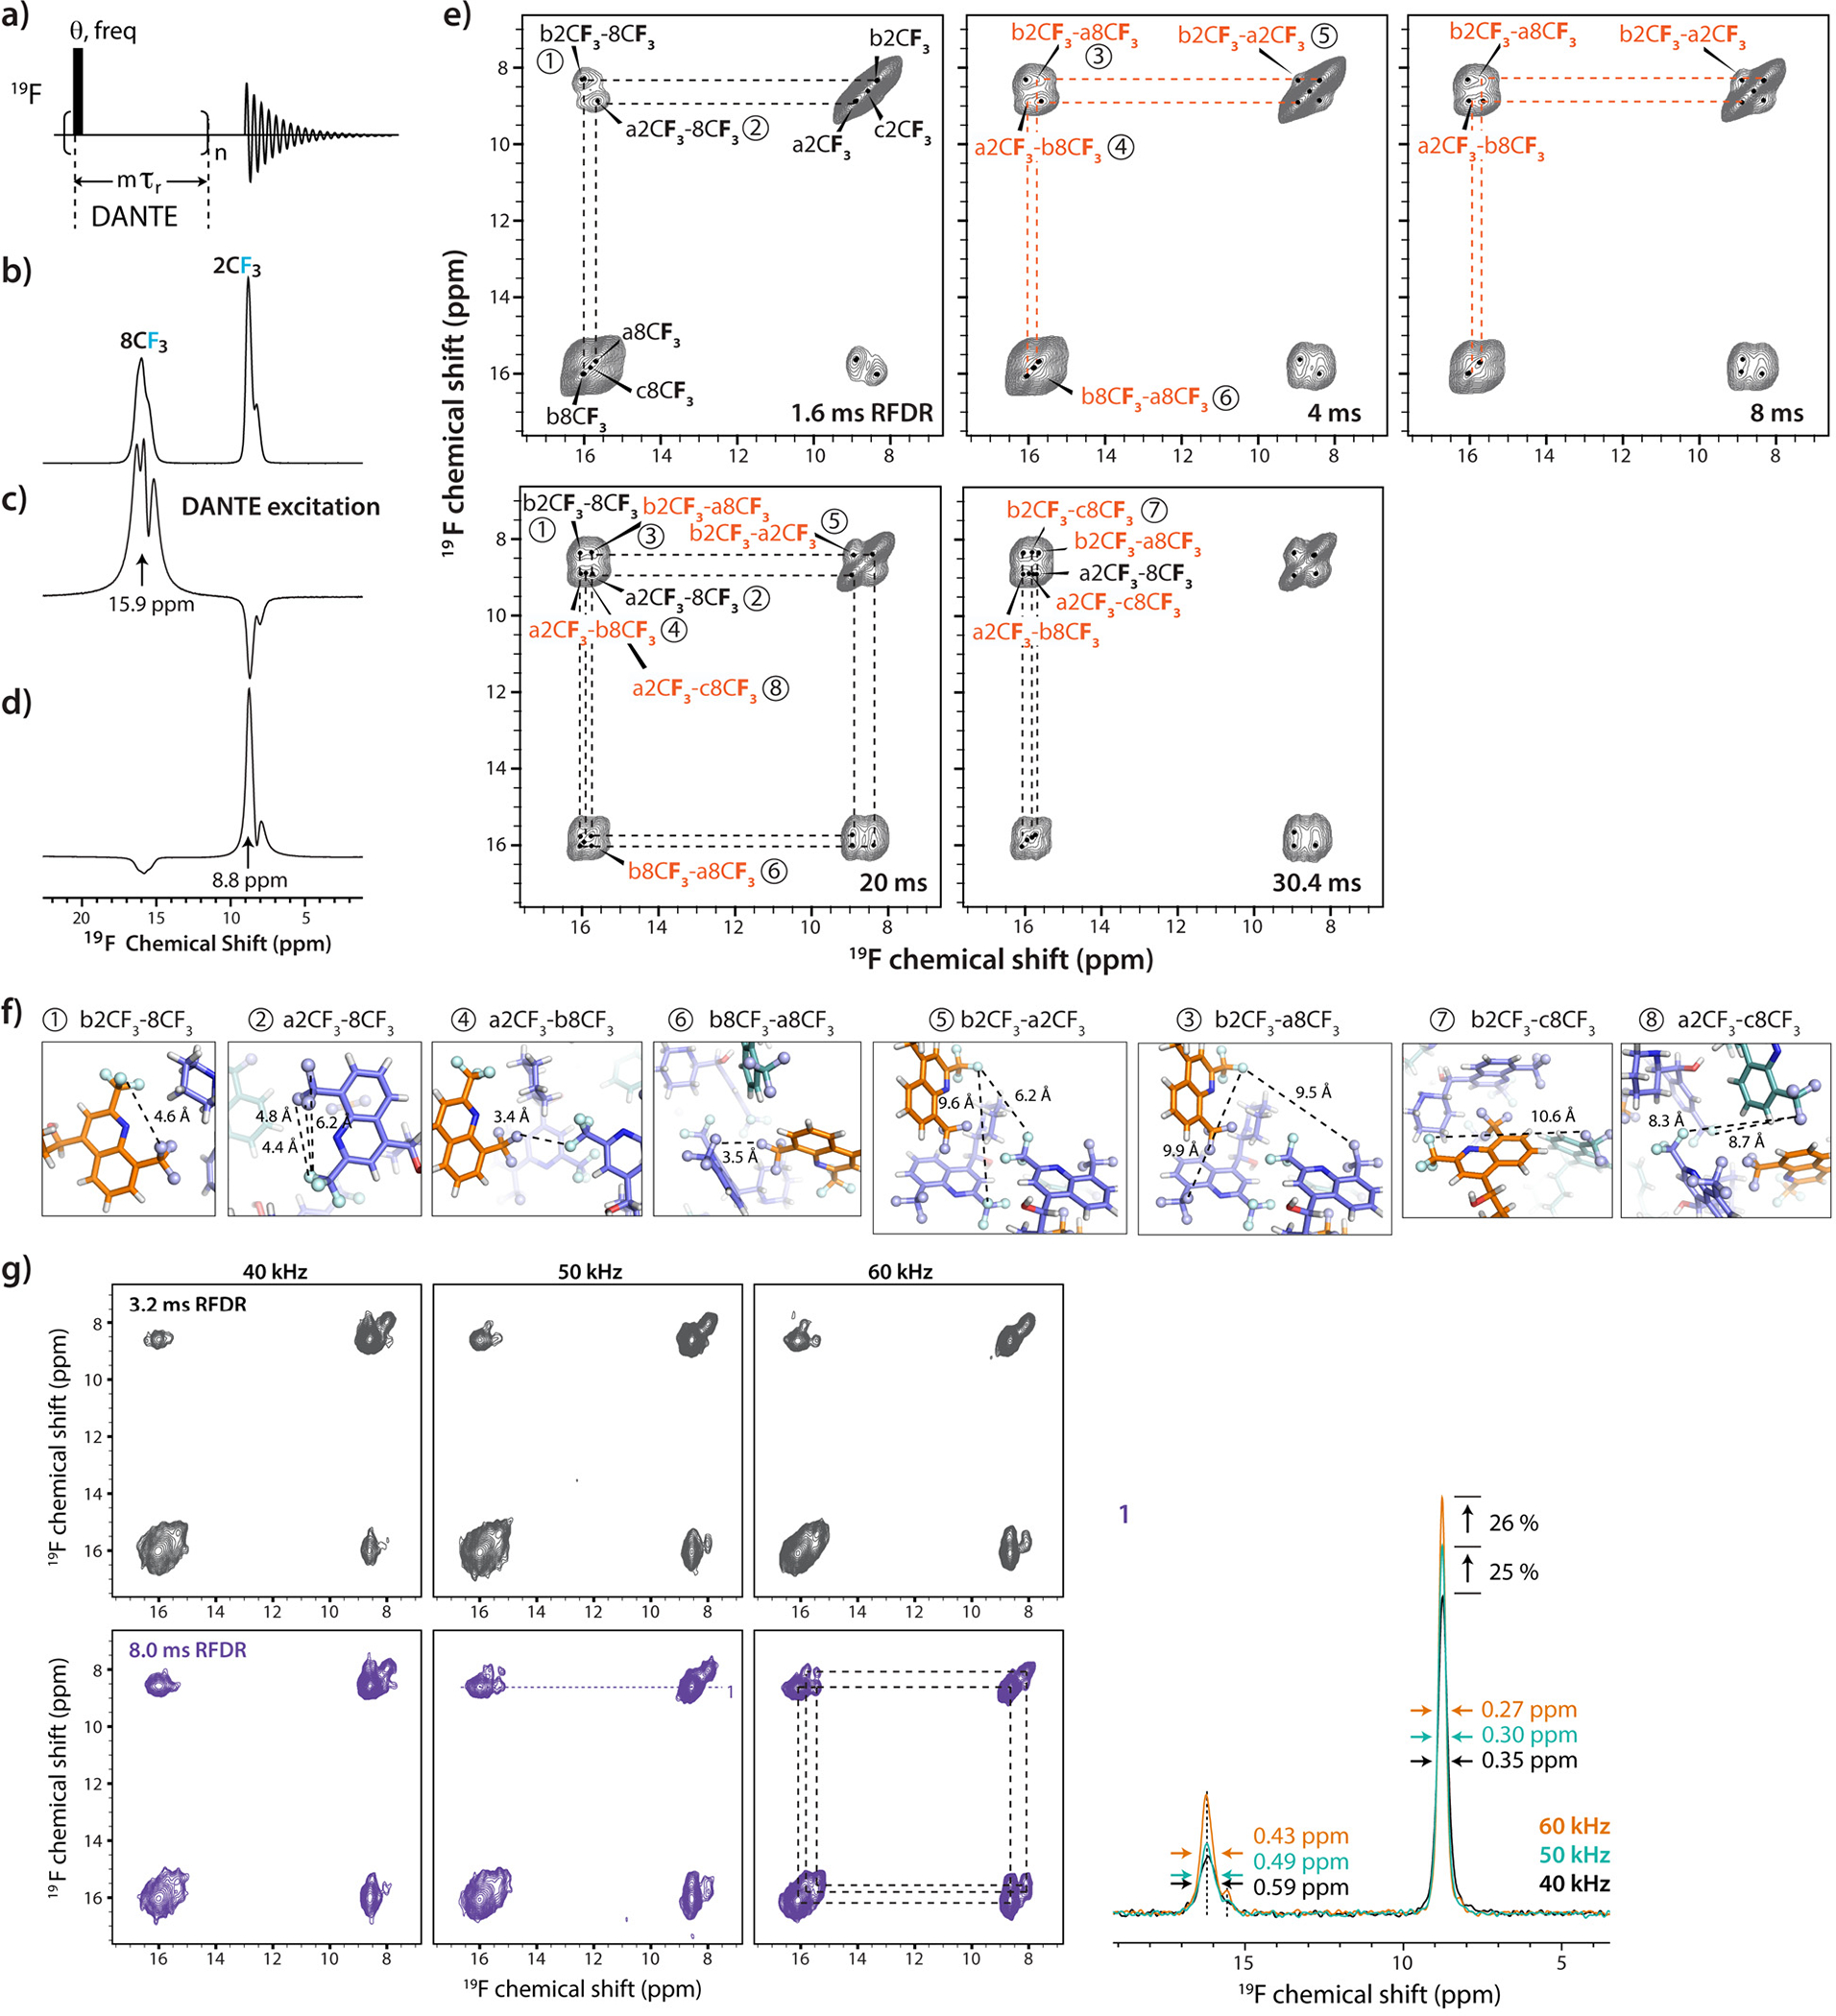
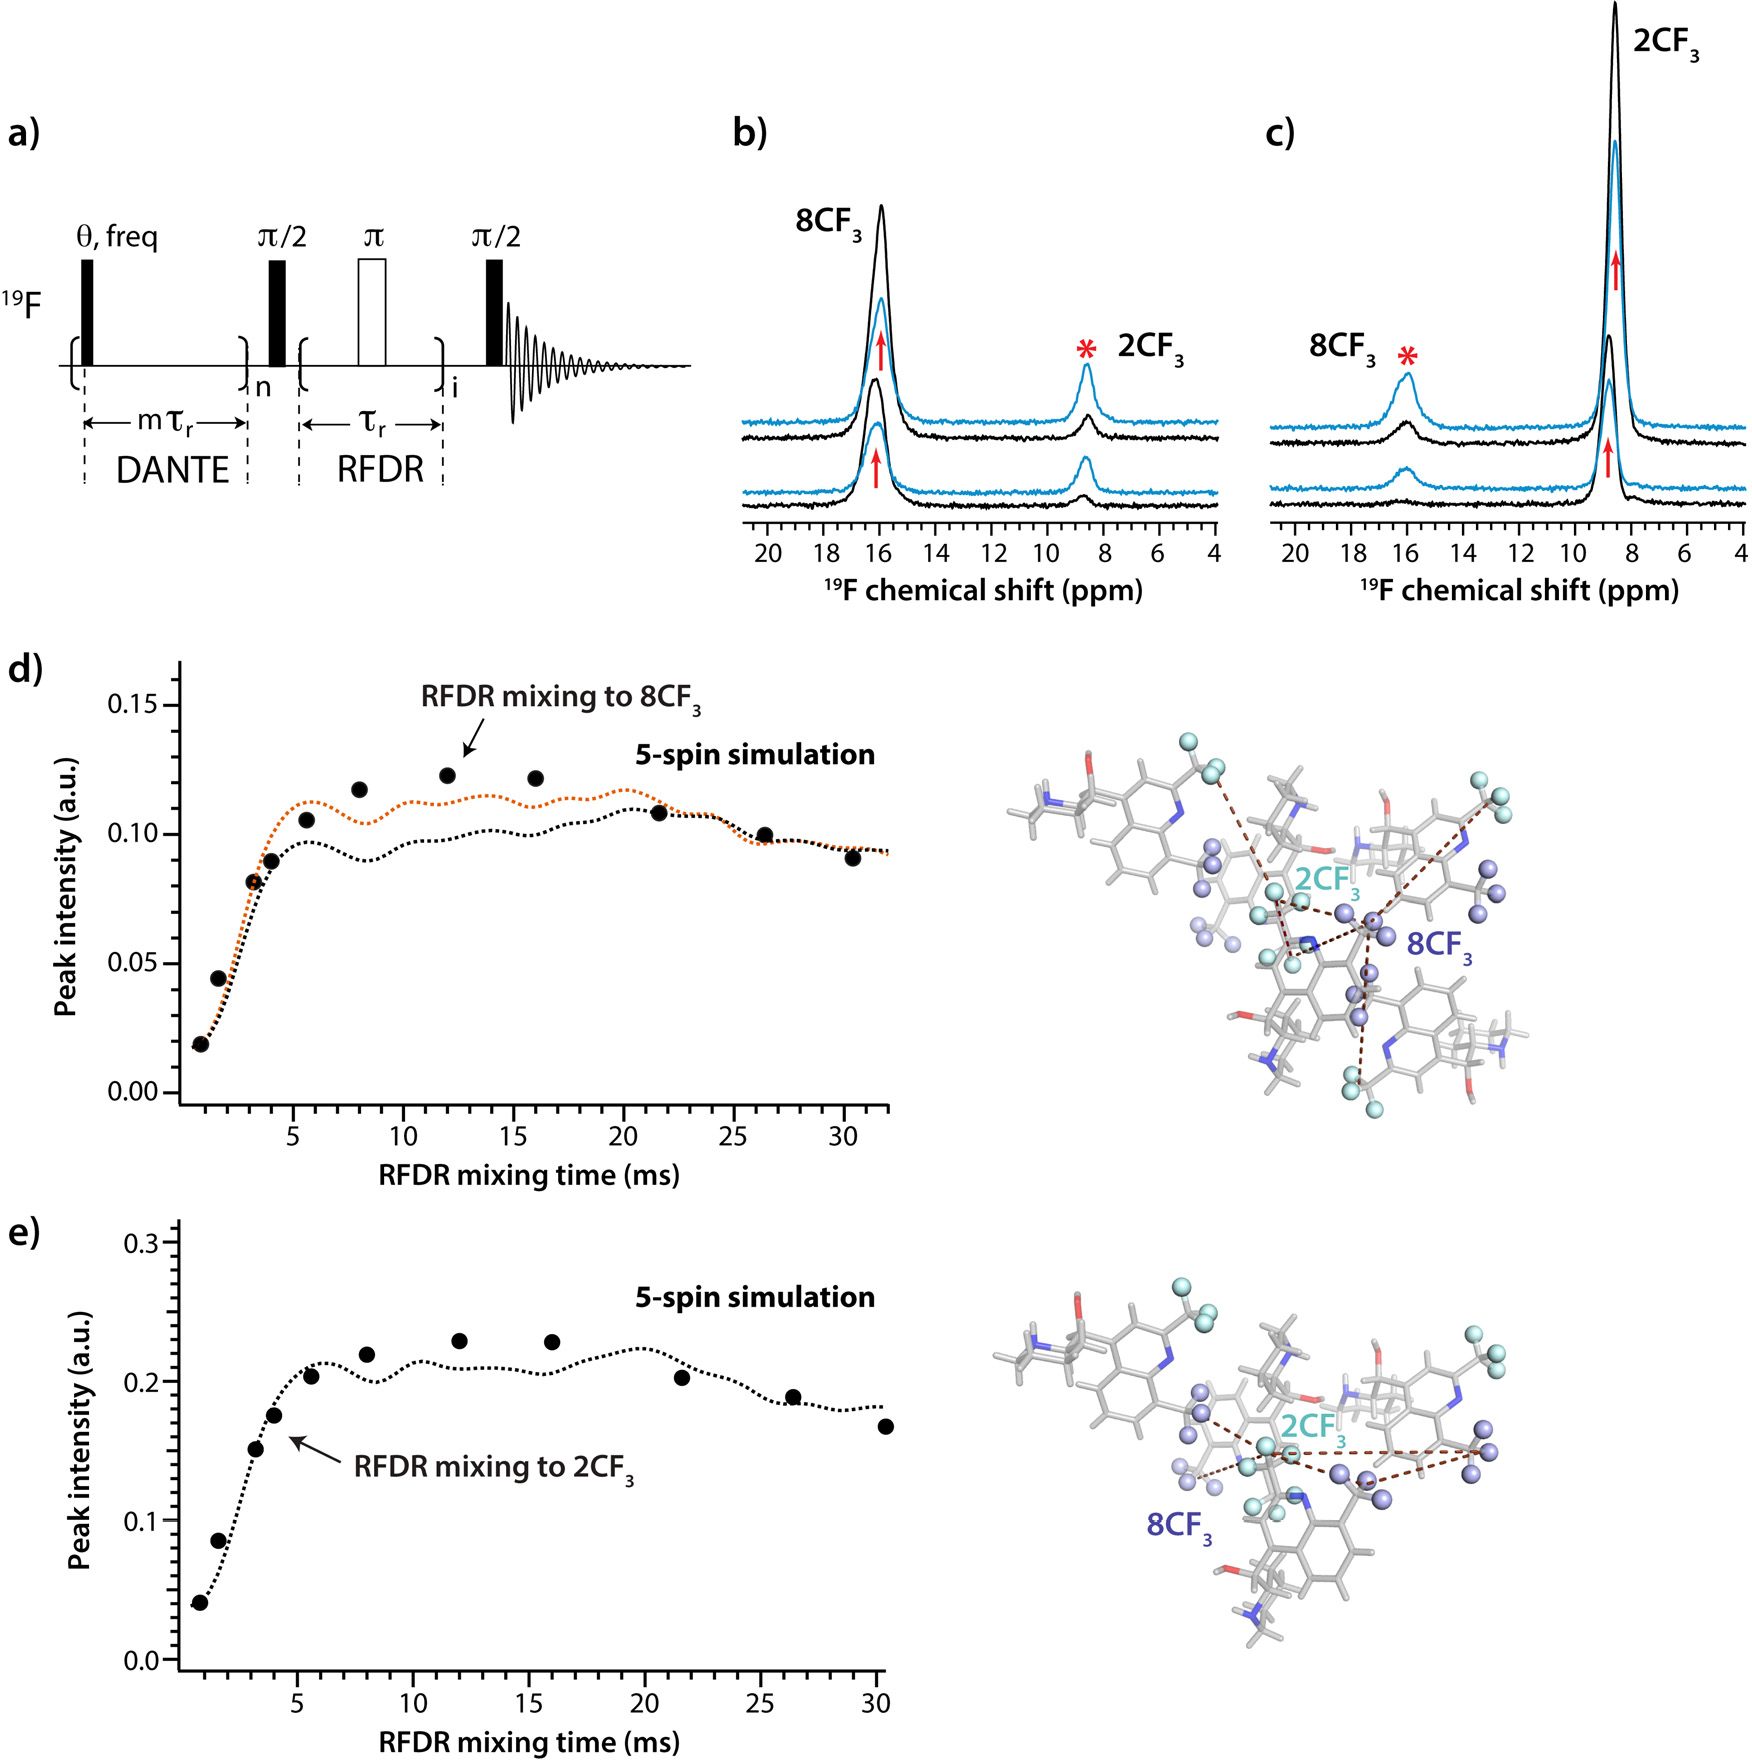
Fluorine-containing compounds comprise 20 to 30 percent of all commercial drugs, and the proportion of fluorinated pharmaceuticals is rapidly growing. While magic angle spinning (MAS) NMR spectroscopy is a popular technique for analysis of solid pharmaceutical compounds, fluorine has been underutilized as a structural probe so far. Here, we report a fast (40-60 kHz) MAS 19F NMR approach for structural characterization of fluorine-containing crystalline pharmaceutical compounds at natural abundance, using the antimalarial fluorine-containing drug mefloquine as an example. We demonstrate the utility of 2D 19F-13C and 19F-19F dipolar-coupling-based correlation experiments for 19F and 13C resonance frequency assignment, which permit identification of crystallographically inequivalent sites. The efficiency of 19F-13C cross-polarization and the effect of 1H and 19F decoupling on spectral resolution and sensitivity were evaluated in a broad range of experimental conditions. We further demonstrate a protocol for measuring accurate interfluorine distances based on 1D DANTE-RFDR experiments combined with multispin numerical simulations.


Conflict of interest statement

CONFLICT OF INTEREST

The authors declare no conflict of interest.

Figures

Figure 1.
Figure 1.
a) Chemical and 3D structure of mefloquine. b) Arrangement of mefloquine molecules in the crystal. The three types of inequivalent molecules are colored in purple, orange and cyan. The fluorine atoms are shown as spheres. The 8CF3 and 2CF3 groups are colored in light purple and light cyan, respectively.
Figure 2.
Figure 2.
19F MAS spectra of mefloquine acquired at MAS frequencies of 60 kHz (top two traces), 40 kHz (middle two traces), and 10 kHz (bottom two traces), with or without SWf-TPPM 1H decoupling at the RF field strength, as indicated next to each spectrum. The blue traces are expansions around the isotropic peaks (marked with asterisks). The signal-to-noise ratios (SNR) are indicated next to each trace. The spectra were acquired at 11.7 T using a 1.3 mm HFX MAS probe, averaging 32 scans.
Figure 3.
Figure 3.
a) 1H-13C and 19F-13C CPMAS spectra of mefloquine. The spectra were acquired at 20.0 T using a 1.9 mm HX MAS probe, averaging 512 scans and 1920 scans and CP contact time of 1.4 and 6 ms, respectively. The 19F-13C spectrum was acquired without decoupling. b) 19F-13C CPMAS spectra of mefloquine without decoupling acquired (top trace), with 19F decoupling (middle trace), and with 1H and 19F decoupling (bottom trace). The spectra were acquired at 16.4 T using a 1.6 mm HFXY MAS probe, averaging 512 scans; the CP contact time was 7 ms. The MAS frequency was 40 kHz in every case. Assignments for individual carbon signals are shown in the different spectra.
Figure 4.
Figure 4.
a) 2D 1H-13C HETCOR spectra acquired with CP contact times of 0.5 ms (yellow) and 1.1 ms (blue). b)-d) 2D 19F-13C HETCOR spectra acquired with CP contact times of 1ms and 7 ms (b), 7 ms and 10 ms with 19F decoupling (c), and with a CP contact time of 7 ms with 1H and 19F decoupling (d). The rf fields for 19F and 13C were 15 kHz and 25 kHz (b) or 50 kHz (c), respectively. The spectrum shown in d) was acquired at 16.4 T with 8 scans. All other spectra were acquired at 20.0 T with 256 scans. The MAS frequency was 40 kHz. Carbon assignments are indicated. e) Short- and long-range intramolecular 19F-13C distances in the mefloquine crystal structure consistent with correlations in the HETCOR spectra for 1ms and 7 ms contact times. f) Intermolecular 19F-13C distances < 6 Å in the crystal lattice.
Figure 5.
Figure 5.
a)-d) Pulse sequence (a), 1D 19F MAS NMR spectrum (b) with 19F DANTE selective excitation of the 8CF3 resonance at 15.9 ppm (c) and 2CF3 resonance at 8.8 ppm (d). Spectra were acquired at 20.0 T, with a MAS frequency of 40 kHz, averaging 16 scans and a DANTE interpulse delay of 4 rotor periods. e) 2D 19F-19F RFDR spectra with increased mixing times from 1.6 ms to 30.4 ms. Intramolecular and intermolecular correlations are shown in black and orange, respectively. f) The intra- and intermolecular interfluorine distances in crystal structure of mefloquine. The notation for each 19F-19F distance is identical to the corresponding correlation 2D 19F-19F RFDR spectra. The fluorine atoms in CF3 groups are shown in light cyan. g) Left panels: 2D 19F-19F RFDR spectra acquired at the MAS frequencies of 40 kHz (left), 50 kHz (middle), and 60 kHz (right). The RFDR mixing times were 3.2 ms (gray) and 8.0 ms (dark purple). Right panel: the 1D traces of the 2D spectra with 8 ms RFDR mixing extracted at 8.61 ppm for MAS frequencies of 40 kHz (cyan), 50 kHz (black) and 60 kHz (orange). The peak widths are indicated in the slices.
Figure 6.
Figure 6.
a) Pulse sequence for the 1D RFDR experiment with 19F DANTE-excitation. b),c) 1D 19F-19F DANTE-RFDR spectra with DANTE 90° selective excitation applied to the 19F resonances of 2CF3 (b) and 8CF3 (c), respectively. Spectra acquired with RFDR mixing times of 1.6 ms and 8.0 ms are shown in black and blue, respectively. The position of the DANTE excitation is shown with arrows and the resonances to which the magnetization was transferred by asterisks. d),e) Left: Experimental and simulated 19F-19F DANTE-RFDR magnetization exchange curves for the 8CF3 (d) and 2CF3 (e) resonances. The experimental data points are shown as black circles, the simulated curves, as dashed lines. In d), the 2CF3 spins were excited by DANTE pulses and magnetization was transferred to the 8CF3 spins during RFDR mixing period. In e), DANTE excitation was applied to the 8CF3 resonances and magnetization was transferred to the 2CF3 groups. Errors in the data points as defined by the standard deviation of the noise in a region of over 10 ppm are smaller than the size of the circles. The RMSDs of the simulated DANTE-RFDR magnetization exchange curves (dashed lines) are 0.008 (orange, the 2CF3 — 2CF3 distance is 7.2 Å) and 0.014 (black, the 2CF3 — 2CF3 distance is 7.4 Å) for 8CF3 (d) and 0.014 for 2CF3 (e). Right: Sets of interfluorine distances used in the 5-spin simulations, see also Table 3.

References

    1. Purser S; Moore PR; Swallow S; Gouverneur V Chem. Soc. Rev. 2008, 37, 320–330. - PubMed
    1. Zhou Y; Wang J; Gu Z; Wang S; Zhu W; Luis Acena J; Soloshonok VA; Izawa K; Liu H Chem. Rev. 2016, 116, 422–518. - PubMed
    1. Mei HB; Han JL; Fustero S; Medio-Simon M; Sedgwick DM; Santi C; Ruzziconi R; Soloshonok VA Chem. - Eur. J. 2019, 25, 11797–11819. - PubMed
    1. Inoue M; Sumii Y; Shibata N ACS Omega 2020, 5, 10633–10640. - PMC - PubMed
    1. Gakh YG; Gakh AA; Gronenborn AM Magn. Reson. Chem. 2000, 38, 551–558.

Publication types