. 2021 Jun 3:10:e68311.
doi: 10.7554/eLife.68311.

Tight nanoscale clustering of Fcγ receptors using DNA origami promotes phagocytosis

Affiliations

Tight nanoscale clustering of Fcγ receptors using DNA origami promotes phagocytosis

Nadja Kern et al. Elife. .

Abstract

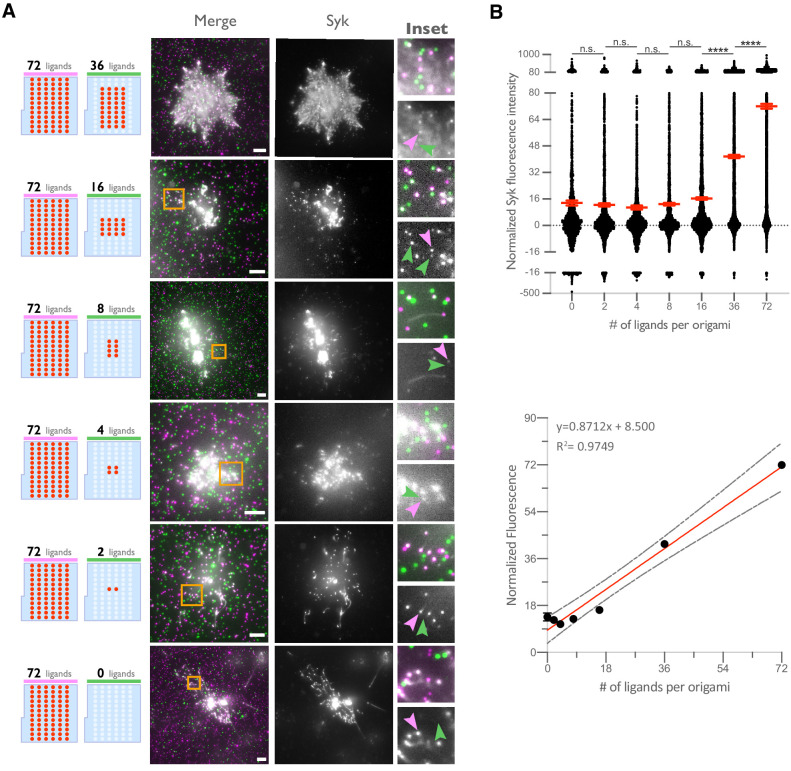
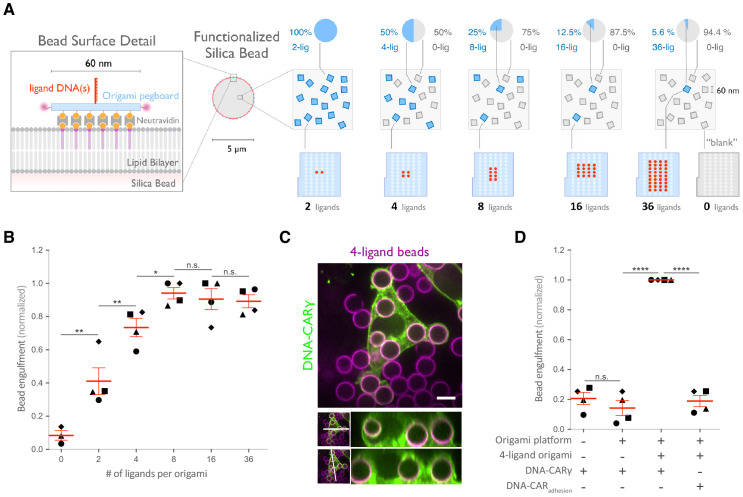
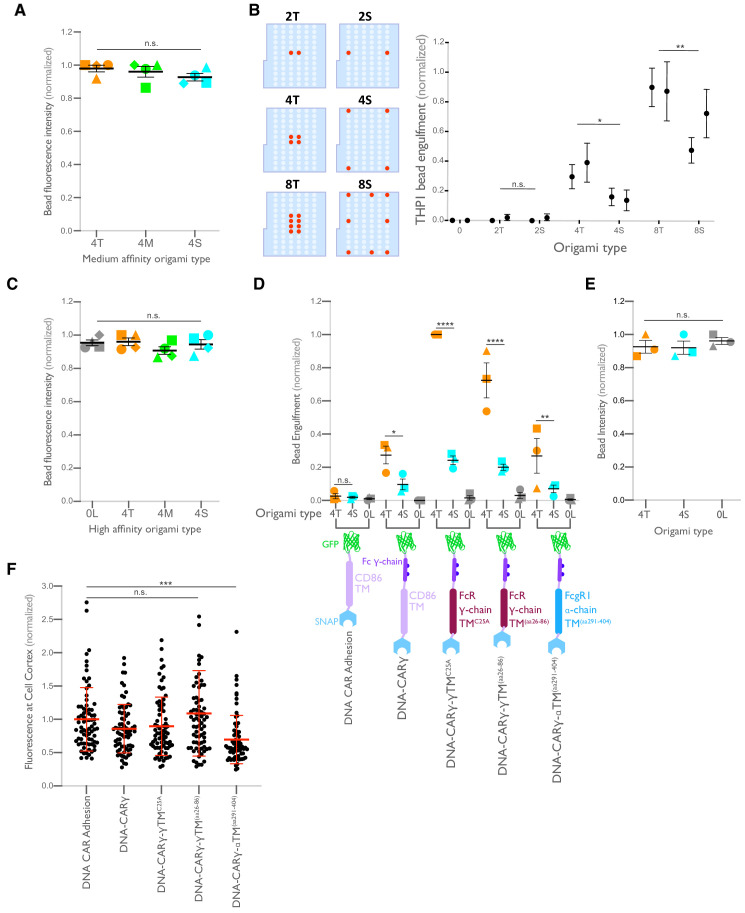
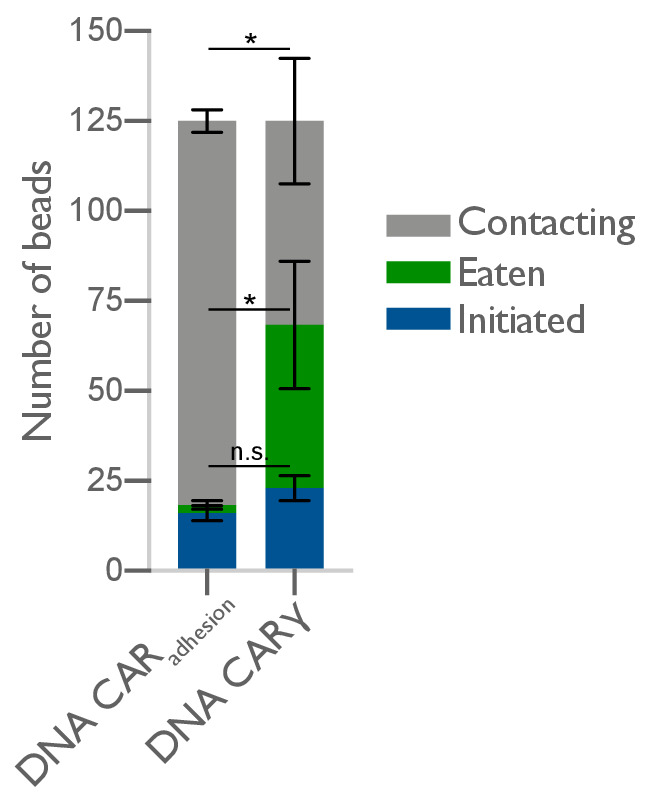
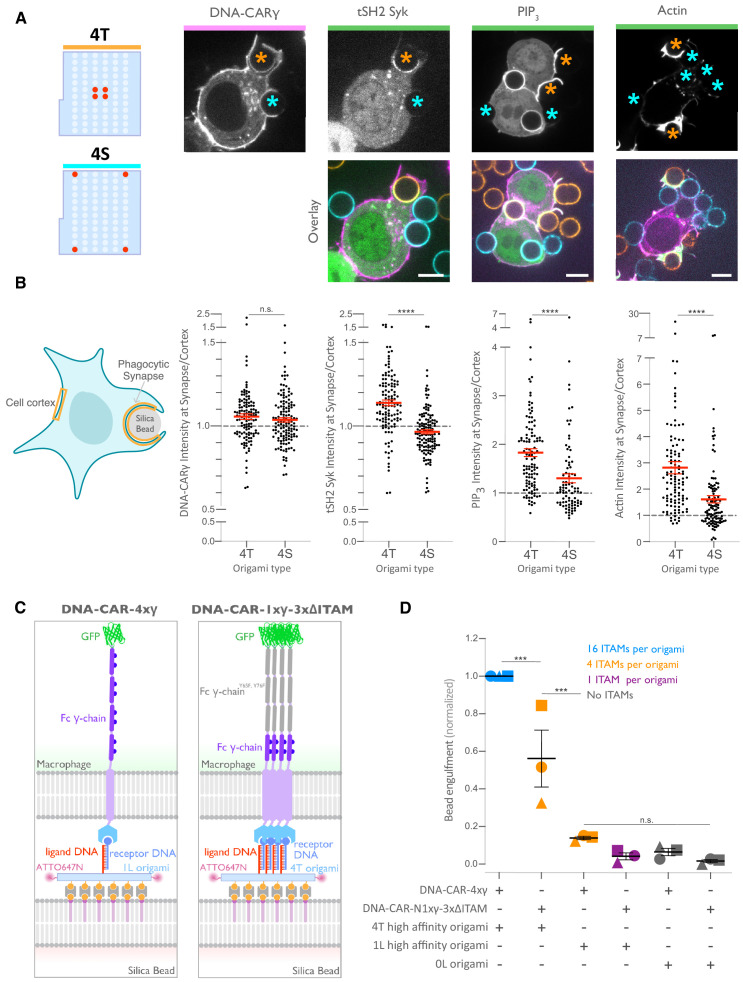
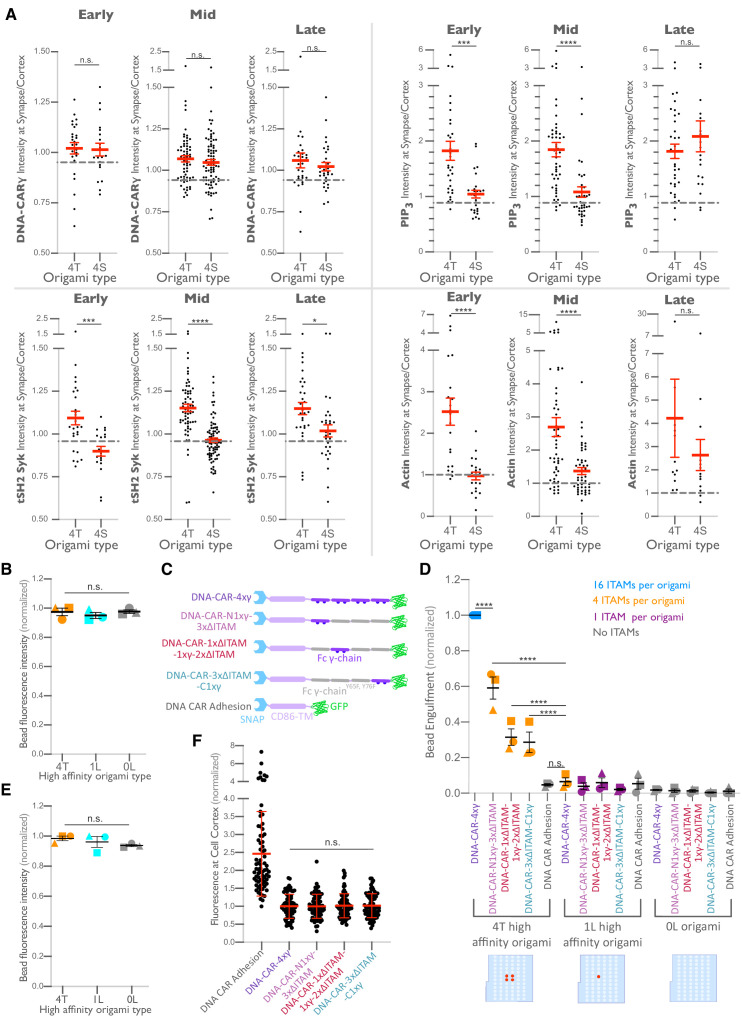
Macrophages destroy pathogens and diseased cells through Fcγ receptor (FcγR)-driven phagocytosis of antibody-opsonized targets. Phagocytosis requires activation of multiple FcγRs, but the mechanism controlling the threshold for response is unclear. We developed a DNA origami-based engulfment system that allows precise nanoscale control of the number and spacing of ligands. When the number of ligands remains constant, reducing ligand spacing from 17.5 nm to 7 nm potently enhances engulfment, primarily by increasing efficiency of the engulfment-initiation process. Tighter ligand clustering increases receptor phosphorylation, as well as proximal downstream signals. Increasing the number of signaling domains recruited to a single ligand-receptor complex was not sufficient to recapitulate this effect, indicating that clustering of multiple receptors is required. Our results suggest that macrophages use information about local ligand densities to make critical engulfment decisions, which has implications for the mechanism of antibody-mediated phagocytosis and the design of immunotherapies.

Keywords: Antibody; DNA origami; Fc Receptor; Phagocytosis; cell biology; human; immunology; immunotherapy; inflammation; mouse; synthetic biology.

Plain language summary

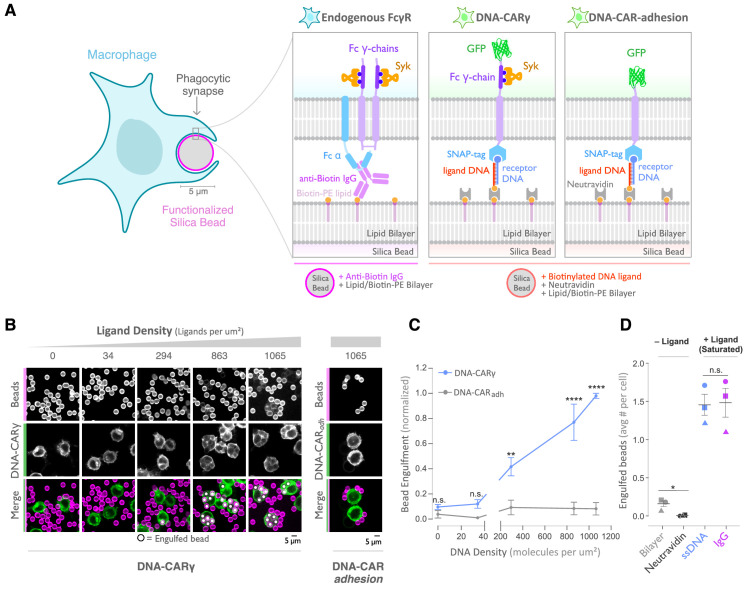
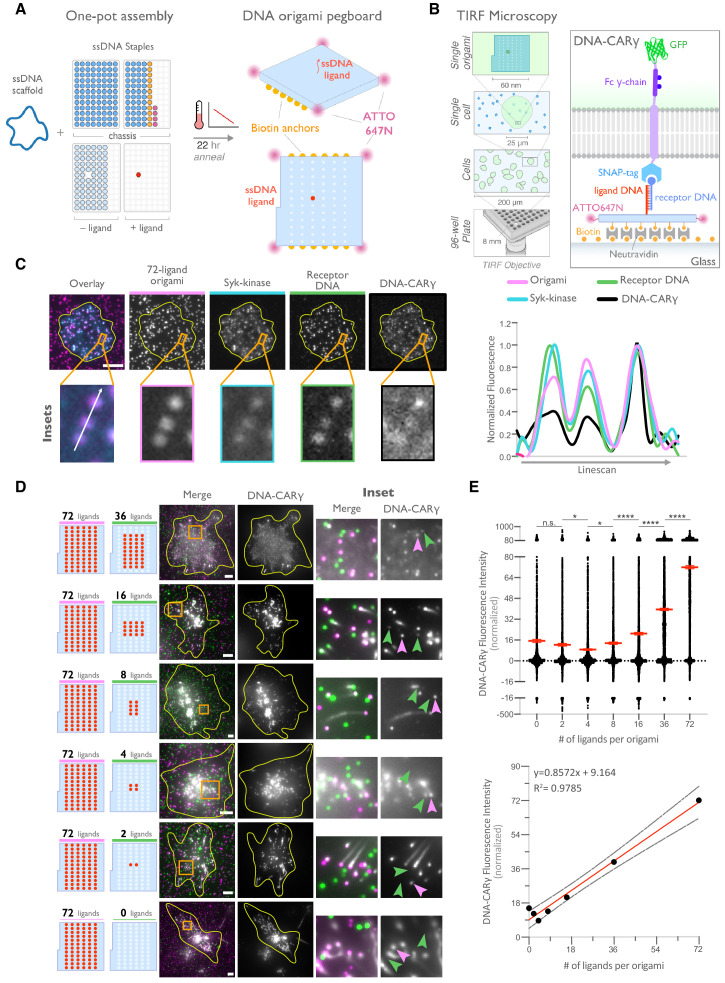
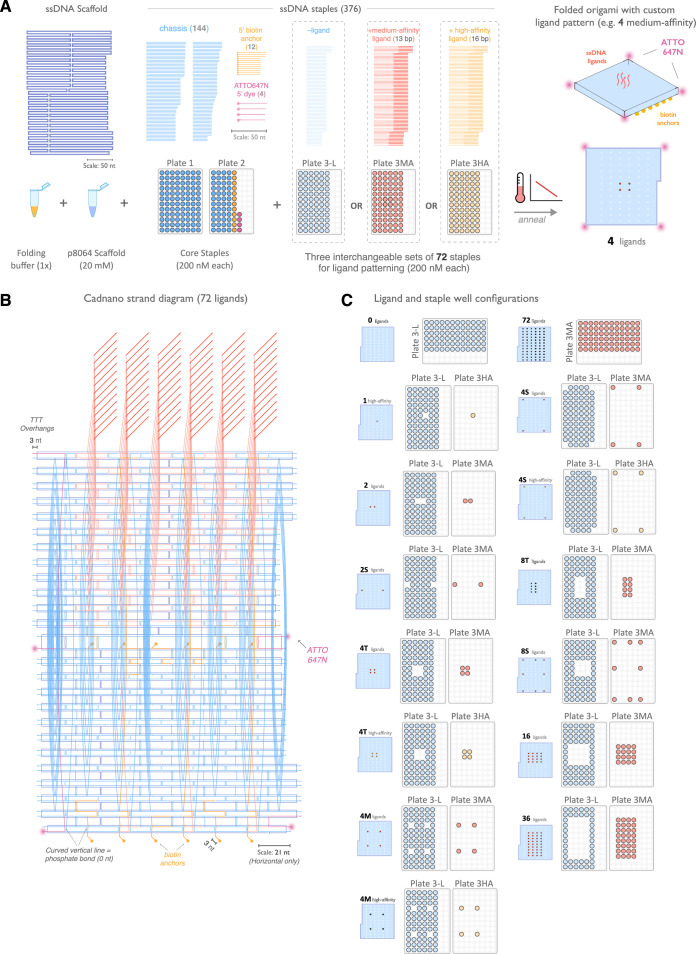
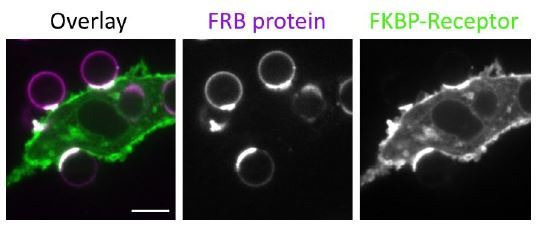
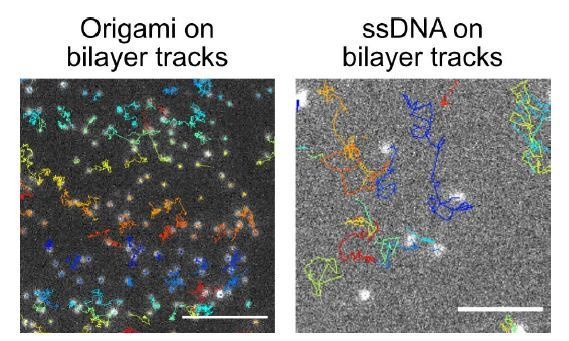
The word ‘phagocytosis’ means cellular eating. It is the process by which cells extend their membranes around foreign particles and engulf them. Macrophages, a type of immune cell found in every tissue of the body, perform phagocytosis to eat pathogens and diseased cells. To avoid eating healthy cells, macrophages focus on targets marked by proteins called antibodies. They look for cells coated with high levels of a type of antibody called immunoglobulin G, or IgG for short, but only eat cells coated with enough IgG, raising the question, can macrophages count? Macrophages recognize IgG antibodies using cell surface receptors called Fc-gamma Receptors. When these receptors bind to IgG, they cluster together. Researchers do not yet know how the number of IgG antibodies per cluster, or the spacing between them, affects phagocytosis. To find this out, researchers need to be able to manipulate the clustering experimentally. One way to do this is using a technique called DNA origami. This technique creates nanoscale patterns of DNA strands on a target surface. If the part of a receptor that interacts with its target is then replaced with a complementary DNA strand to the strands on the target surface, the receptor will bind the surface following the nanoscale pattern. This allows researchers to generate synthetic targets with specific patterns of receptor-target interaction. Kern et al. replaced the part of the macrophage Fc-gamma Receptor that interacts with IgG with a strand of DNA. They then used DNA origami to arrange complementary DNA strands on pegboards and attached these pegboards to silica beads. The different arrangements of DNA on these pegboards mimicked the types of antibody clusters macrophages might encounter on the surfaces of the cells and particles they have to engulf in the body. Kern et al. found that tight clusters of the DNA targets on the pegboards made the macrophages most likely to begin phagocytosis, particularly clusters of eight or more DNA strands spaced less than seven nanometers apart. Macrophages encountering these tight clusters showed an increase in Fc-gamma receptor activation, which is crucial for macrophage attack. Whether or not macrophages can count, they can at least sense the level of clustering of IgG antibodies to determine if a target should be engulfed. Doctors use antibody therapies that rely on Fc-gamma receptor engagement to treat cancer, autoimmune and neurodegenerative diseases. Understanding how clustering affects phagocytosis could aid in the design of new antibody treatments. It could also help improve the design of synthetic receptors to create designer immune cells that can attack specific targets. The next step will be to recreate the results from the synthetic system used by Kern et al. with natural receptors and antibodies.


Conflict of interest statement

NK, RD, SD, RV, MM No competing interests declared

Figures

Figure 1.
Figure 1.. A DNA-based system for controlling engulfment.
(A) Schematic shows the endogenous (left box) and DNA-based (middle and right boxes) engulfment systems. Engulfment via endogenous FcγRs (left box) is induced through anti-biotin IgG bound to 1-oleoyl-2-(12-biotinyl(aminododecanoyl))-sn-glycero-3-phosphoethanolamine (biotin-PE) lipids incorporated into the bilayer surrounding the silica bead targets. Engulfment induced via the DNA-based system uses chimeric antigen receptors (CAR) expressed in the macrophage and biotinylated ligand DNA that is bound to the lipid bilayer surrounding the silica bead. The DNA-CARγ (middle box) consists of a single-stranded DNA (ssDNA) (receptor DNA) covalently attached to an extracellular SNAP-tag fused to a CD86 transmembrane domain, the intracellular domain of the FcRγ chain, and a fluorescent tag. The DNA-CARadhesion (right box) is identical but lacks the signaling FcRγ chain. (B) Example images depicting the engulfment assay. Silica beads were coated with a supported lipid bilayer (magenta) and functionalized with neutravidin and the indicated density of ligand DNA (Figure 1—figure supplement 1A). The functionalized beads were added to RAW264.7 macrophages expressing either the DNA-CARγ or the DNA-CARadhesion (green) and fixed after 45 min. The average number of beads engulfed per macrophage was assessed by confocal microscopy. Scale bar denotes 5 µm here and in all subsequent figures. Internalized beads are denoted with a white sphere in the merged images. (C) The number of beads engulfed per cell for DNA-CARγ (blue) or DNA-CARadhesion (gray) macrophages was normalized to the maximum bead eating observed in each replicate. Dots and error bars denote the mean ± SEM of three independent replicates (n ≥ 100 cells analyzed per experiment). (D) DNA-CARγ-expressing macrophages were incubated with bilayer-coated beads (gray) functionalized with anti-biotin IgG (magenta), neutravidin (black), or neutravidin and saturating amounts of ssDNA (blue). The average number of beads engulfed per cell was assessed. Full data representing the fraction of macrophages engulfing specific numbers of IgG or ssDNA beads is shown in Figure 1—figure supplement 1. Each data point represents the mean of an independent experiment, denoted by symbol shape, and bars denote the mean ± SEM. n.s. denotes p>0.05, * indicates p<0.05, ** indicates p<0.005, and **** indicates p<0.0001 by a multiple t-test comparison corrected for multiple comparisons using the Holm–Sidak's method (C) or Student’s t-test (D).
Figure 1—figure supplement 1.
Figure 1—figure supplement 1.. DNA-based engulfment system reflects endogenous engulfment.
(A) Graph depicts the calibration used to determine the surface density of single-stranded DNA (ssDNA) on beads used in Figure 1B, C. The intensity of Alexa Fluor 647 fluorescent bead standards (black dots) was measured, and a simple linear regression (red line) was fit to the data. The fluorescence intensity of Alexa Fluor 647-ssDNA coated beads (blue dots) was measured, and the surface density was interpolated using the regression determined from the fluorescent bead standards. The concentration of ssDNA used for each bead coupling condition is indicated next to the blue points on the graph. (B) Macrophages expressing the DNA-CARγ (blue) or the DNA-CARadhesion (gray) engulfed similar distributions of IgG-functionalized beads. Data is pooled from two independent replicates. (C) Graph depicts the fraction of macrophages engulfing the indicated number of IgG (magenta) or ssDNA (blue) beads from data pooled from the three independent replicates presented in Figure 1D. (D) Graph shows the average number of neutravidin (black), ligand-DNA (blue), or IgG (magenta) functionalized beads engulfed by the monocyte-like cell line THP1. Lines denote the mean engulfment from each independent replicate, and bars denote ± SEM. p values were calculated using the Mann–Whitney test (B, C) and n.s. denotes p>0.05 as determined by the Student’s t-test (D).
Figure 2.
Figure 2.. DNA origami pegboard induces ligand-dependent signaling.
(A) Schematic shows the DNA origami pegboard used in this study (right) and the components used to create it using a one-pot assembly method (left, Figure 2—figure supplement 1). The top of the two-tiered DNA origami pegboard has 72 positions spaced 7 nm and 3.5 nm apart in the x and y dimensions, which can be modified to expose a single-stranded ligand DNA (red) or no ligand (light blue). A fluorophore is attached at each corner of the pegboard for visualization (pink). The bottom tier of the pegboard displays 12 biotin molecules (yellow) used to attach the origami to neutravidin-coated surfaces. Full representation of the DNA origami pegboard assembly is shown in Figure 2—figure supplement 1. (B) Schematic portraying the Total Internal Reflection Fluorescence (TIRF) microscopy setup used to image THP-1 cells interacting with origami pegboards functionalized to glass coverslips in (C) and (D) (left). On the right is a zoomed-in side view of an origami pegboard functionalized to a biotin (yellow) and neutravidin (gray) functionalized glass coverslip and interacting with a single DNA-CARγ receptor. (C) TIRF microscopy images of THP-1 cells show that the DNA-CARγ (BFP; fifth panel; black in linescan), the receptor DNA bound to the DNA-CARγ (Cy5; fourth panel; green in linescan), and Syk (mNeonGreen; third panel; cyan in merge and linescan) are recruited to individual 72-ligand (72L) origami pegboards (Atto-647; second panel; magenta in merge and linescan). Each diffraction-limited magenta spot represents an origami pegboard. The top panels show a single cell (outlined in yellow), and the bottom insets (orange box in top image) show three origami pegboards at higher magnification. The linescan (right, area denoted with a white arrow in merged inset) shows the fluorescence intensity of each of these channels. Intensity was normalized so that 1 is the highest observed intensity and 0 is background for each channel. (D) TIRF microscopy images show DNA-CARγ-expressing THP1s interacting with 72L origami pegboards (pink) and origami pegboards presenting the indicated number of ligands (pegboards labeled in green). Left schematics represent origami pegboard setups for each row of images where red dots denote the presence of a ligand DNA. Middle images depict a single macrophage (outlined in yellow), and right images show the area indicated with an orange box on the left. Examples of DNA-CARγ-mNeonGreen (gray) recruitment to individual origami pegboards is marked by pink (72L origami pegboard) and green (origami pegboard with the indicated ligand number) arrowheads (right). (E) Quantification of experiment shown in (D). Top graph shows the DNA-CARγ intensity at the indicated origami pegboard type normalized to the average DNA-CARγ intensity at 72L origami pegboards in the same well. Each dot represents one origami pegboard, and red lines denote the mean ± SEM of pooled data from three separate replicates. n.s. denotes p>0.05, * indicates p<0.05, and **** indicates p<0.0001 by an ordinary one-way ANOVA with Holm–Sidak’s multiple comparison test. A linear regression fit (bottom) of the average fluorescence intensities of each of the origami pegboards suggests that the mean DNA-CARγ fluorescent intensities are linearly proportional to the number of ligands per DNA origami pegboard. The black dots represent the mean normalized DNA-CARγ intensity, the red line denotes the linear regression fit, and the gray lines show the 95% confidence intervals.
Figure 2—figure supplement 1.
Figure 2—figure supplement 1.. Design and assembly of nanoscale ligand-patterning pegboard built from DNA origami.
(A) 2D schematic of origami scaffold and staples. The p8064 single-stranded DNA (ssDNA) scaffold is combined with 160 ssDNA staples that form the chassis, biotin-modified surface anchors, and ATTO647N-labeled dyes, plus a combination of 72 ligand-patterning staples. We used three variants of the ligand-patterning staples: ‘-ligand’ that lacks a 3' single-stranded overhang and terminates flush with the pegboard surface, and a ‘medium-affinity’ (red) and ‘high-affinity’ (yellow) that form 13 bp and 16 bp duplexes with the DNA-CAR receptors, respectively. Assembly is performed by thermal annealing in a one-pot reaction. (B) Cadnano strand diagram for the pegboard with 72 medium-affinity ligands included. (C) Fourteen pegboard configurations were used in this study. Configurations are labeled by ligand count, spacing, and ligand affinity, and the corresponding plate wells used in each assembly are shown.
Figure 2—figure supplement 2.
Figure 2—figure supplement 2.. Syk intensity increases with ligand number in origami cluster.
(A) TIRF microscopy images showing DNA-CARγ-mNeonGreen and Syk-BFP-expressing THP1s interacting with 72-ligand (72L) origami pegboards (pink) and origami pegboards presenting the indicated number of ligands (green) plated together on a glass surface (schematics shown on the left). Middle images depict a single macrophage, and right images show the area indicated with a yellow box on the left. Examples of Syk-BFP (gray) recruitment to individual origami pegboards are marked by pink (72L origami) and green (indicated ligand number origami) arrowheads (right). (B) Top graph shows the Syk intensity at each indicated origami pegboard type normalized to the average Syk intensity at 72L origami pegboards for each condition. Each dot represents the normalized Syk intensity at one origami, and red lines denote the mean ± SEM of pooled data from three separate replicates. At ligand numbers fewer than 16, we did not detect Syk enrichment over background fluorescence of cytosolic Syk. A linear regression fit (bottom) of the average Syk fluorescence intensity at each origami pegboard type suggests that the mean Syk recruitment is linearly proportional to the number of ligands per DNA origami. n.s. denotes p>0.05 and **** indicates p<0.0001 by an ordinary one-way ANOVA with Holm–Sidak’s multiple comparison test.
Figure 3.
Figure 3.. Nanoscale clustering of ligand enhances phagocytosis.
(A) Schematic showing an origami pegboard functionalized to a lipid bilayer surrounding a silica bead (left) and the origami pegboard mixtures used to functionalize the bilayer-coated silica beads for experiment quantified in (B) (right). Blue squares represent origami pegboards with the indicated number of ligands (schematics below, red dot denotes ligand DNA and light blue dot denotes no ligand), and gray squares represent 0-ligand ‘blank’ origami pegboards. Pie charts above describe the ratios of ligand origami presenting pegboards to ‘blank’ pegboards. (B) Beads were functionalized with mixtures of origami pegboards containing the indicated ligand-presenting origami pegboard and the 0-ligand ‘blank’ origami pegboards in amounts designated in (A). The graph depicts the number of beads internalized per DNA-CARγ-expressing macrophage normalized to the maximum bead eating in that replicate. Each dot represents an independent replicate (n ≥ 100 cells analyzed per experiment), denoted by symbol shape, with red lines denoting mean ± SEM. Data is normalized to the maximum bead eating in each replicate. (C) Example image showing the DNA-CARγ (green) drives engulfment of beads (bilayer labeled in magenta) functionalized with 4-ligand DNA origami pegboards. A cross section of the z plane indicated in the inset panel (white line, bottom) shows that beads are fully internalized. (D) Bilayer-coated silica beads were functionalized with neutravidin, neutravidin and DNA origami pegboards presenting 0 DNA ligands, or neutravidin and 4-ligand DNA origami pegboards. The graph depicts normalized bead eating per cell of the indicated bead type for cells expressing the DNA-CARγ or the DNA-CARadhesion. Each dot represents an independent replicate, denoted by symbol shape (n ≥ 100 cells analyzed per experiment), with red lines denoting mean ± SEM. The data are normalized to the maximum bead eating in each replicate. * denotes p<0.05, ** denotes p<0.005, **** denotes p<0.0001, and n.s. denotes p>0.05 in (B) and (D) as determined by an ordinary one-way ANOVA with Holm–Sidak’s multiple comparison test.
Figure 3—figure supplement 1.
Figure 3—figure supplement 1.. Origami intensity on beads is comparable across conditions.
Graph shows the average Atto647N fluorescence intensity from the beads used in Figure 3A, B measured using confocal microscopy. Each dot represents an independent replicate (n ≥ 100 cells analyzed per experiment), denoted by symbol shape, with red lines denoting mean ± SEM. n.s. denotes p>0.05 as determined by an ordinary one-way ANOVA with Holm–Sidak’s multiple comparison test.
Figure 4.
Figure 4.. Spatial arrangement of ligands within nanoclusters regulates engulfment.
(A) Schematics (top) depict 4-ligand origami pegboards presenting ligands at the positions indicated in red. Beads were functionalized with 0-ligand ‘blank’ (gray) origami pegboards, 4T (orange) origami pegboards, 4M (green) origami pegboards, or 4S (cyan) origami pegboards at equal amounts and fed to DNA-CARγ-expressing macrophages. Representative confocal images (middle) depict bead (bilayer in magenta) engulfment by macrophages (green). Internalized beads are denoted with a white sphere. Quantification of the engulfment assay is shown in the graph below depicting the number of beads engulfed per macrophage normalized to the maximum observed eating in that replicate. (B) Schematics of the receptor DNA (blue) paired with the medium-affinity 13 base pair DNA-ligand (red) used in all previous experiments including (A) and the high-affinity 16 base pair ligand-DNA (yellow) used for experiment shown in the graph below. Beads were functionalized with 0-ligand ‘blank’ (gray), high-affinity 4T (orange), high-affinity 4M (green), or high-affinity 4S (cyan) origami pegboards and fed to DNA-CARγ-expressing macrophages. Graph shows the number of beads engulfed per macrophage normalized to the maximum observed eating in that replicate. Each data point represents the mean of an independent experiment, shapes denote data from the same replicate, and bars show the mean ± SEM (A, B). * denotes p<0.05, *** denotes p<0.0005, **** denotes p<0.0001, and n.s. denotes p>0.05 as determined by an ordinary one-way ANOVA with Holm–Sidak’s multiple comparison test (A, B).
Figure 4—figure supplement 1.
Figure 4—figure supplement 1.. Ligand clustering enhances engulfment in RAW macrophages expressing DNA-CARs with endogenous FcγR transmembrane domains and in THP1s.
(A) Graph shows the average Atto647N fluorescence intensity from the beads used in Figure 4A measured using confocal microscopy. (B) Beads were functionalized with the indicated ligand-presenting origami pegboards in amounts calculated to equalize the total number of origami pegboards and ligands across conditions. Schematics (left) depict the origami utilized, where the positions presenting a ligand (red dots) and the positions not occupied by a ligand (light blue) are indicated. Graph (right) depicts the average number of the indicated type of beads internalized per DNA-CARγ-expressing THP1, normalized to the maximum bead eating in that replicate. (C) Graph shows the average Atto647N647 fluorescence intensity from the beads used in Figure 4B measured using confocal microscopy. (D) Schematics below the graph depict the DNA-CAR constructs designed with varying transmembrane domains. Beads were functionalized with 4T origami pegboards (orange), 4S origami pegboards (cyan), or 0-ligand ‘blank’ origami pegboards (gray) and fed to macrophages expressing the DNA-CAR receptor depicted below each section of the graph. Graph depicts the number of beads engulfed per macrophage normalized to the maximum observed eating in that replicate. (E) Graph shows the average Atto647N fluorescence intensity from the beads used in (D) measured using confocal microscopy. (F) DNA-CAR receptors used in (D) are expressed and trafficked to the membrane at similar levels. Fluorescent intensity at the cell cortex of the DNA-CAR-infected macrophage was quantified using the mean intensity of a two-pixel width linescan at the cell membrane, with the mean intensity of a linescan immediately adjacent to the cell subtracted for local background. The fluorescence intensity was normalized to the average intensity of the DNA-CARadhesion in each experiment. Each dot represents an individual cell, and data is pooled from three independent experiments, with red lines denoting mean ± SEM. n.s. denotes p>0.05, * denotes p<0.05, ** denotes p<0.005, *** denotes p<0.0005, and **** indicates p<0.0001 as determined by an ordinary one-way ANOVA with Holm–Sidak’s multiple comparison test (A–F).
Figure 5.
Figure 5.. Nanoscale ligand clustering controls engulfment initiation.
(A) Schematic portraying origami pegboards used to analyze the steps in the engulfment process quantified in (C–E). Bead binding is defined as the first frame the macrophage contacts a bead; initiation is the first frame in which the macrophage membrane has begun to extend around the bead, and completion is defined as full internalization. The macrophage membrane was visualized using the DNA-CARγ, which was present throughout the cell cortex. The % of beads that progress to the next stage of engulfment (% success) is indicated for 4T (orange, origami labeled with Atto550N) and 4S (cyan, origami labeled with Atto647N) beads. **** denotes p<0.0001 as determined by Fisher’s exact test. (B) Still images from a confocal microscopy timelapse showing the macrophage (green) interacting with both the 4T origami pegboard-functionalized beads (orange) and the 4S origami pegboard-functionalized beads (cyan), but preferentially engulfing the 4T origami pegboard-functionalized beads. In the bottom panel (DNA-CARγ channel), engulfed beads have been indicated by a sphere colored to match its corresponding origami type. (C) Graph depicts quantification of the time from bead contact to engulfment initiation for all beads that were successfully engulfed. Each dot represents one bead with red lines denoting mean ± SEM. (D) Graph depicts the time from engulfment initiation to completion. Each dot represents one bead with red lines denoting mean ± SEM. (E) Graph shows the fraction of contacted 4T and 4S beads engulfed (orange and cyan, respectively) by the macrophages. Data represent quantification from four independent experiments, denoted by symbol shape, and bars denote the mean ± SEM. n.s. denotes p>0.05 and ** indicates p<0.005 by Student’s t-test comparing the 4T- and 4S-functionalized beads (C–E).
Figure 5—figure supplement 1.
Figure 5—figure supplement 1.. DNA-CARadhesion fails to induce frequent engulfment initiation attempts.
The average number of 4T origami pegboard-functionalized beads contacting (gray), in the initiation stage of engulfment (blue), or fully engulfed (green) by macrophages expressing either the DNA-CARadhesion or the DNA-CARγ were quantified from fixed still images after 45 min of engulfment. 125 beads in contact with DNA-CAR-expressing macrophages were analyzed in three independent replicates. Bars represent the average number of beads identified at each stage, and black lines denote ± SEM between replicates. n.s. denotes p>0.05 and * denotes p<0.05 as determined by an unpaired t-test with Holm–Sidak’s multiple comparison test.
Figure 6.
Figure 6.. Nanoscale ligand spacing controls receptor activation.
(A) Beads were functionalized with 4T (orange) or 4S (cyan) origami pegboards at equal amounts, added to macrophages expressing the DNA-CARγ (magenta) and the indicated signaling reporter protein (green; grayscale on top). Phagocytic synapses were imaged via confocal microscopy. Asterisks indicate whether a 4T (orange) or a 4S (cyan) bead is at the indicated phagocytic synapse in the upper panel. (B) Schematic (left) depicts the areas measured from images shown in (A) to quantify the fluorescence intensity (yellow outlines). Each phagocytic synapse measurement was normalized to the fluorescence intensity of the cell cortex at the same z-plane. Graphs (right) depict the ratio of fluorescence at 4T- or 4S-functionalized bead synapses to the cortex for the indicated reporter. Each dot represents one bead with red lines denoting mean ± SEM. (C) Schematic portraying the CAR constructs and origami used in the experiment quantified in (D). The DNA-CAR-4xγ construct (left) consists of four repeats of the intracellular domain of the DNA-CARγ connected by a GGSG linker. The DNA-CAR-1xγ−3xΔITAM (right) is identical to the DNA-CAR-4xγ except that the tyrosines composing the immune receptor tyrosine-based activation motif (ITAM) domains (purple circles) are mutated to phenylalanines in the three C-terminal repeats (gray). Cells expressing either of these constructs were fed beads functionalized with either high-affinity 1-ligand origami pegboards (left), high-affinity 4T origami pegboards (right), or 0-ligand ‘blank’ origami pegboards (not shown), and engulfment was assessed after 45 min. (D) Graph shows the number of beads engulfed per macrophage normalized to the maximum observed eating in that replicate. Each data point represents the mean from an independent experiment, denoted by symbol shape, and bars denote the mean ± SEM. Blue points represent a condition where 16 ITAMs are available per origami, orange points represent conditions where 4 ITAMs are available per origami, purple points represent a condition where 1 ITAM is available per origami, and gray points represent conditions where no ITAM is available. n.s. denotes p>0.05, *** denotes p<0.0005, and **** denotes p<0.00005 as determined by the Student’s t-test (B) or an ordinary one-way ANOVA with Holm–Sidak’s multiple comparison test (D).
Figure 6—figure supplement 1.
Figure 6—figure supplement 1.. Differential recruitment of downstream signaling molecules is greater at early and mid-stage phagocytic cups.
(A) Data from experiment shown in Figure 6B is separated by early (macrophage membrane extends across <30% of the bead, left), mid (macrophage membrane extends across 30–70% of the bead, middle), and late (macrophage membrane extends across >70% of the bead, right) stage phagocytic cups. Graphs depict the ratio of fluorescence intensity at 4T- or 4S-functionalized bead synapses compared to the cortex. Each dot represents one bead with red lines denoting mean ± SEM. n.s. denotes p>0.05, * denotes p<0.05, *** denotes p<0.0005, and **** denotes p<0.00005 by the Student’s t-test. (B) Graph shows the average Atto647N fluorescence intensity from the beads used in Figure 6D measured using confocal microscopy. (C) Schematics depict the DNA-CAR-4xγ constructs used for experiment quantified in (D). (D) DNA-CAR constructs shown in (C) were expressed in RAW macrophages and fed beads functionalized with 4T high-affinity origami pegboards, 1-ligand high-affinity origami pegboards, or 0-ligand origami pegboards. Graph depicts the number of beads engulfed per macrophage normalized to the maximum observed eating in that replicate. Each data point represents the mean from an independent experiment, denoted by symbol shape, and bars denote the mean ± SEM. Blue points represent a condition where 16 immune receptor tyrosine-based activation motifs (ITAMs) are available per origami, orange points represent conditions where 4 ITAMs are available per origami, purple points represent a condition where 1 ITAM is available per origami, and gray points represent conditions where no ITAM is available. (E) Graph shows the average Atto647N fluorescence intensity from the beads used in (D) measured using confocal microscopy. (F) DNA-CAR receptors used in (D) are expressed and trafficked to the membrane at similar levels. Fluorescent intensity at the cell cortex of the DNA-CAR-infected macrophage was quantified using the mean intensity of a two-pixel width linescan at the cell membrane, with the mean intensity of a linescan immediately adjacent to the cell subtracted for local background. The fluorescence intensity was normalized to the average intensity of the DNA-CAR-4xγ in each experiment. Each dot represents an individual cell, and data is pooled from three independent experiments, with red lines denoting mean ± SEM. n.s. denotes p>0.05 and **** indicates p<0.0001 as determined by an ordinary one-way ANOVA with Holm–Sidak’s multiple comparison test (B, D–F).
Author response image 1.
Author response image 2.
Author response image 3.

Similar articles

Cited by

References

    1. Arnold M, Cavalcanti-Adam EA, Glass R, Blümmel J, Eck W, Kantlehner M, Kessler H, Spatz JP. Activation of integrin function by nanopatterned adhesive interfaces. ChemPhysChem. 2004;5:383–388. doi: 10.1002/cphc.200301014. - DOI - PubMed
    1. Bag N, Wagenknecht-Wiesner A, Lee A, Shi S, Holowka DA, Baird BA. Lipid-based, protein-based, and steric interactions synergize to facilitate transmembrane signaling stimulated by antigen-clustering of IgE receptors. bioRxiv. 2020 doi: 10.1101/2020.12.26.424347. - DOI - PMC - PubMed
    1. Bakalar MH, Joffe AM, Schmid EM, Son S, Podolski M, Fletcher DA. Size-Dependent segregation controls macrophage phagocytosis of Antibody-Opsonized targets. Cell. 2018;174:131–142. doi: 10.1016/j.cell.2018.05.059. - DOI - PMC - PubMed
    1. Beekman JM, van der Linden JA, van de Winkel JG, Leusen JH. FcgammaRI (CD64) resides constitutively in lipid rafts. Immunology Letters. 2008;116:149–155. doi: 10.1016/j.imlet.2007.12.003. - DOI - PubMed
    1. Ben M'Barek K, Molino D, Quignard S, Plamont MA, Chen Y, Chavrier P, Fattaccioli J. Phagocytosis of immunoglobulin-coated emulsion droplets. Biomaterials. 2015;51:270–277. doi: 10.1016/j.biomaterials.2015.02.030. - DOI - PubMed

Publication types

MeSH terms