. 2021 Aug;8(16):e2100827.
doi: 10.1002/advs.202100827. Epub 2021 Jun 3.

A Fully Integrated Closed-Loop System Based on Mesoporous Microneedles-Iontophoresis for Diabetes Treatment

Affiliations

A Fully Integrated Closed-Loop System Based on Mesoporous Microneedles-Iontophoresis for Diabetes Treatment

Xiangling Li et al. Adv Sci (Weinh). 2021 Aug.

Abstract

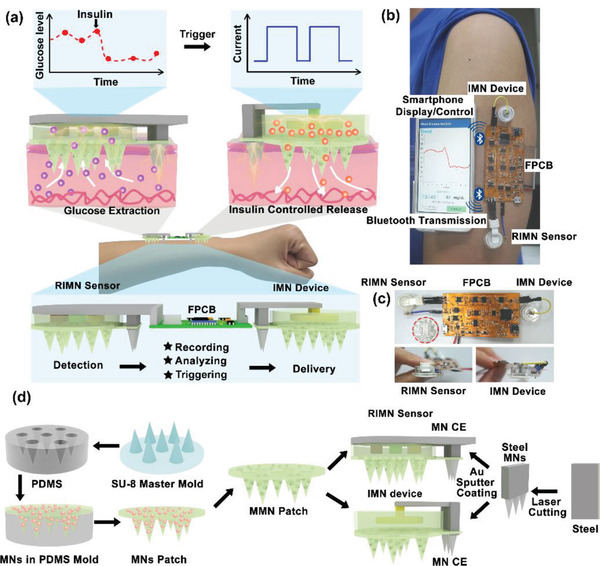
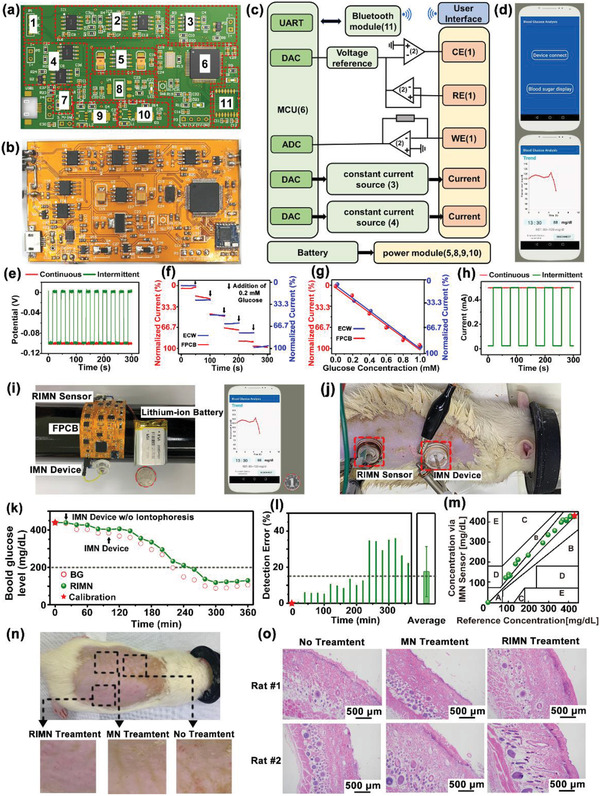
A closed-loop system that can mini-invasively track blood glucose and intelligently treat diabetes is in great demand for modern medicine, yet it remains challenging to realize. Microneedles technologies have recently emerged as powerful tools for transdermal applications with inherent painlessness and biosafety. In this work, for the first time to the authors' knowledge, a fully integrated wearable closed-loop system (IWCS) based on mini-invasive microneedle platform is developed for in situ diabetic sensing and treatment. The IWCS consists of three connected modules: 1) a mesoporous microneedle-reverse iontophoretic glucose sensor; 2) a flexible printed circuit board as integrated and control; and 3) a microneedle-iontophoretic insulin delivery component. As the key component, mesoporous microneedles enable the painless penetration of stratum corneum, implementing subcutaneous substance exchange. The coupling with iontophoresis significantly enhances glucose extraction and insulin delivery and enables electrical control. This IWCS is demonstrated to accurately monitor glucose fluctuations, and responsively deliver insulin to regulate hyperglycemia in diabetic rat model. The painless microneedles and wearable design endows this IWCS as a highly promising platform to improve the therapies of diabetic patients.

Keywords: closed-loop system; diabetes monitor and therapy; intelligent wearable device; mesoporous microneedles-iontophoresis; minimally invasive.


Conflict of interest statement

The authors declare no conflict of interest.

Figures

Figure 1
Figure 1
a) Illustration of the IWCS based on MN platform for real‐time and in situ diabetes monitoring and treatment. The IWCS consisted of a RIMN glucose sensor, a FPCB, and IMN therapeutic components. The system detected glucose fluctuation via the RIMN, where the signals were recorded, transmitted, and had given feedback via FPCB, triggering release of insulin via IMN device. b) The photographic image showing the concept of IWCS worn on human arm and wireless communication with smartphone for data transmission and display. c) The digital photos of IWCS, including zoom‐in image of RIMN sensor (left) and MN device (right), where a coin (marked with red circle) for visually size comparison. d) Illustration of the fabrication procedure of the whole IWCS and each component. The essential component, MMN patch, was fabricated via a typical molding technique, coupled with template perforation and porogen removal. The MMN and iontophoretic electrodes were assembled by a 3D‐printed chamber to form the RIMN Sensor and IMN device.
Figure 2
Figure 2
Characterizations of MMN. a) The SEM images showing a series of MMN with different porosities (30–60%). b) Digital photograph showing the morphology of MMN patch. c) The stress–strain test of MMN by dynamometer. The critical breaking and yielding forces were labeled, respectively. d) Quantitative analysis of the critical breaking and yielding forces of MMN with different porosities. e,f) Optical and SEM images showing MMN with 50% porosity could remain intact after insertion into skin. g) SEM image showing mechanical failure of MMN with 60% porosity after insertion into skin. h) Quantification of the molecular (methylene blue and insulin‐FITC) diffusion rates across the interface of MMNs with different porosities. N = 3 measurements. i) Heatmap plot summarizing the behaviors of the tested mechanical failure forces (yielding and breaking) and the diffusion rates (methylene blue and insulin‐FITC) at different MN porosities. j) Fluorescence images of MMN stained with Rhodamine B. k) Photograph and fluorescence image showing Rhodamine B deposition into pigskin by MMN penetration. l) Optical photograph and SEM images of MN C.E.
Figure 3
Figure 3
Performance characterization of the RIMN sensor. a) Illustration of the fabrication procedure and b) the optical image of planar glucose electrode. c) The amperometric response of planar glucose electrode. 1) The electrode was tested with a series of glucose solution (0–0.8 mm). 2) Glucose concentration stepwise‐increased by 0.2 mm (blue arrows). 3) The linear relations of the current signals and the corresponding glucose concentrations. d) Schematic diagram (top) and optical image (bottom) of the RIMN sensor. e) COMSOL 2D model of glucose extraction by RIMN. f) The electrical field distribution (indicated with black curves) and glucose concentration profile (indicated with brown color) at t = 300 s after reverse iontophoresis. g) Concentration–time relations of subcutaneous glucose extraction were quantitatively analyzed. h) Schematic showing the experimental setup of RIMN sensor for glucose sensing in vitro. i) Quantification of glucose extraction efficiency under different iontophoretic currents and time conditions. j) The linear relations of the current signals and glucose concentrations via RIMN sensors. k) The amperometric responses of RIMN sensor upon different glucose concentrations under 0 and 0.5 mA reverse iontophoretic extraction for 5 min. l) Photograph showing the application of RIMN sensor on anesthetized rat. m,n) The dynamic glucose signals recorded by RIMN sensors on m) healthy rat and n) diabetic rat model. The detected current signal via RIMN was converted to glucose concentration and the actual BG were measured via standard glucose test strips. The asterisk indicated the calibration point. The blue arrow indicated the time point of glucose or insulin injections. o) Statistical analysis showing the detection errors of RIMN sensor compared to the actual BG at corresponding time points. The asterisks indicated calibration points. The dash line indicated the clinical criterion of error <15%. p,q) Clarke's error grid analysis showing the detection accuracy of RIMN sensor compared to the actual BG. The asterisks indicated calibration points.
Figure 4
Figure 4
Performance characterization of the IMN Device. a) The schematic diagram (top) and optical image (bottom) of IMN device. b) Illustration of the COMSOL 2D model of IMN device for transdermal insulin delivery. c) The electrical field distribution (indicated with black curves) and insulin concentration profile (indicated with brown color) after iontophoresis at 0, 0.2, 0.5 mA for t = 180 min via IMN device. Theoretical calculations of the effects of d) iontophoretic duration, e) electric filed, and f) MN porosity on delivery. g) Schematic and h) photographs showing the experimental setup of IMN device for insulin delivery in vitro. i) Quantification of insulin released from the IMN device for 180 min, either at constant iontophoretic current (0.5 mA) or free diffusion (0 mA). N = 3 measurements. j) Photograph showing application of IMN device on anesthetized rats. k) Diabetic rats were treated via IMN device, non‐iontophoretic MN device, and subcutaneous injection of insulin, while the non‐treated diabetic and healthy rats were used as controls. After treatments, the BG fluctuations were continuously monitored for 10 h. The green region indicated the normoglycemia. N = 3 BG measurements. l) Quantitative analysis of the corresponding durations at normoglycemia and the minimum BG for different treatments. N = 3 BG measurements. m) Measurement of the plasma insulin concentrations of diabetic rats treated with IMN device and non‐iontophoretic MN device for 2 h. N = 3 measurements. Data were presented as mean ± SD. Significance was calculated by one‐way ANOVA. *p <0.05.
Figure 5
Figure 5
Performance characterization of the whole IWCS. a) Design sketch and b) the photograph of a flattened FPCB. The red dashed boxes indicate the locations of the integrated circuit components. c) The system block diagram of IWCS. The whole system consists of devices, hardware system, and software system. Hardware system consisted of three‐electrode constant‐potential circuit, signal conditioning circuit, power supply module, Bluetooth, MCU, and two‐channel constant‐current sources. d) The home page (top) and the display page (down) of the smartphone app real‐time showing glucose monitor. e) The voltage output of as‐prepared FPCB at continuous and intermittent constant voltages of 0 and −100 mV, which could be applied as bias potential for sensing. f) The relations of the current signal on glucose electrodes using as‐prepared FPCB and commercial ECW. g) The linear relations of the currents and glucose concentration measured using as‐prepared FPCB compared to ECW. h) The current output of as‐prepared FPCB at continuous and intermittent constant current output at 0.5 mA for iontophoresis. i) The photograph of the whole IWCS (left), including RIMN sensor, FPCB, IMN device, and lithium‐ion polymer battery, communications with a smartphone app (right). A coin (marked with red circle) was placed next to the IWCS for visual size comparison. j) Photograph showing the simultaneous applications of the RIMN sensor and IMN devices on anesthetized rats. k) The dynamic glucose signals upon simultaneous applications of RIMN sensors and IMN devices on diabetic rat model. The detected current signal via RIMN was converted to glucose concentration, and the actual BG were measured via standard glucose test strips. The asterisk indicated the calibration point. The black arrow indicated the time point of insulin delivery by IMN device. The dash line indicated the boundary of normoglycemia (BG <200 mg dL−1). l) Statistical analysis showing the detection errors of RIMN sensor compared to the actual BG at corresponding time points. The asterisks indicated calibration points. The dash line indicated the clinical criterion of error <15%. m) The Clarke's error grid analysis showing the detection accuracy of RIMN sensor compared to the actual BG. The asterisks indicated calibration points. n) Biosafety Tests of MN Applications. Rat were treated with RIMN (0.5 mA) or MN for 5 min, totally four times with 10 min intervals. The images showing the skin surfaces 24 h after treatments of MN. Both RIMN and MN treatments did not cause obvious skin irritation. o) The skin tissues were sectioned and stained with hematoxylin eosin (H&E).

References

    1. a) Reddy B., Hassan U., Seymour C., Angus D. C., Isbell T. S., White K., Weir W., Yeh L., Vincent A., Bashir R., Nat. Biomed. Eng. 2018, 2, 640; - PubMed
    2. b) Min J., Chin L. K., Oh J., Landeros C., Vinegoni C., Lee J., Lee S. J., Park J. Y., Liu A.‐Q., Castro C. M., Lee H., Im H., Weissleder R., Sci. Transl. Med. 2020, 12, eaaz9746; - PMC - PubMed
    3. c) Laksanasopin T., Guo T. W., Nayak S., Sridhara A. A., Xie S., Olowookere O. O., Cadinu P., Meng F., Chee N. H., Kim J., Chin C. D., Munyazesa E., Mugwaneza P., Rai A. J., Mugisha V., Castro A. R., Steinmiller D., Linder V., Justman J. E., Nsanzimana S., Sia S. K., Sci. Transl. Med. 2015, 7, 273re1; - PubMed
    4. d) del Río J. S., Henry O. Y. F., Jolly P., Ingber D. E., Nat. Nanotechnol. 2019, 14, 1143. - PubMed
    1. a) Veiseh O., Tang B. C., Whitehead K. A., Anderson D. G., Langer R., Nat. Rev. Drug Discovery 2015, 14, 45; - PMC - PubMed
    2. b) Yu J., Wang J., Zhang Y., Chen G., Mao W., Ye Y., Kahkoska A. R., Buse J. B., Langer R., Gu Z., Nat. Biomed. Eng. 2020, 4, 499; - PMC - PubMed
    3. c) Bhatt D. L., Szarek M., Pitt B., Cannon C. P., Leiter L. A., McGuire D. K., Lewis J. B., Riddle M. C., Inzucchi S. E., Kosiborod M. N., Cherney D. Z. I., Dwyer J. P., Scirica B. M., Bailey C. J., Díaz R., Ray K. K., Udell J. A., Lopes R. D., Lapuerta P., Steg P. G., N. Engl. J. Med. 2020, 384, 129;
    4. d) Wang Y., Wang C., Li K., Song X., Yan X., Yu L., He Z., J. Controlled Release 2021, 330, 618. - PubMed
    1. a) Kollipara S., Silverstein J. H., Marschilok K., Am. J. Health Educ. 2009, 40, 292;
    2. b) Zhuo X., Zhang P., Barker L., Albright A., Thompson T. J., Gregg E., Diabetes Care 2014, 37, 2557; - PubMed
    3. c) Owens D. R., Zinman B., Bolli G. B., Lancet 2001, 358, 739. - PubMed
    1. a) Aye T., Block J., Buckingham B., Endocrinol. Metab. Clin. North Am. 2010, 39, 609; - PMC - PubMed
    2. b) Hovorka R., Leelarathna L., Eur. Endocrinol. 2010, 6, 58.
    3. c) Brown S. A., Kovatchev B. P., Raghinaru D., Lum J. W., Buckingham B. A., Kudva Y. C., Laffel L. M., Levy C. J., Pinsker J. E., Wadwa R. P., Dassau E., F. J.Doyle, 3rd, Anderson S. M., Church M. M., Dadlani V., Ekhlaspour L., Forlenza G. P., Isganaitis E., Lam D. W., Kollman C., Beck R. W., N. Engl. J. Med. 2019, 381, 1707; - PMC - PubMed
    4. d) Elleri D., Dunger D. B., Hovorka R., BMC Med. 2011, 9, 120. - PMC - PubMed
    1. a) Teymourian H., Barfidokht A., Wang J., Chem. Soc. Rev. 2020, 49, 7671; - PubMed
    2. b) Veiseh O., Tang B. C., Whitehead K. A., Anderson D. G., Langer R., Nat. Rev. Drug Discovery 2015, 14, 45. - PMC - PubMed

Publication types