. 2021 Aug 1;32(16):1501-1513.
doi: 10.1091/mbc.E21-05-0258. Epub 2021 Jun 3.

Stochastic contraction of myosin minifilaments drives evolution of microridge protrusion patterns in epithelial cells

Affiliations

Stochastic contraction of myosin minifilaments drives evolution of microridge protrusion patterns in epithelial cells

Aaron P van Loon et al. Mol Biol Cell. .

Abstract

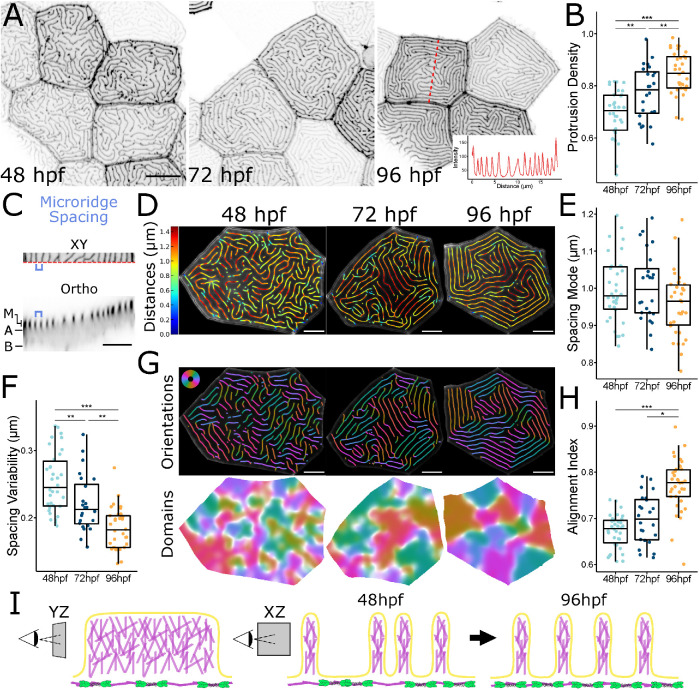
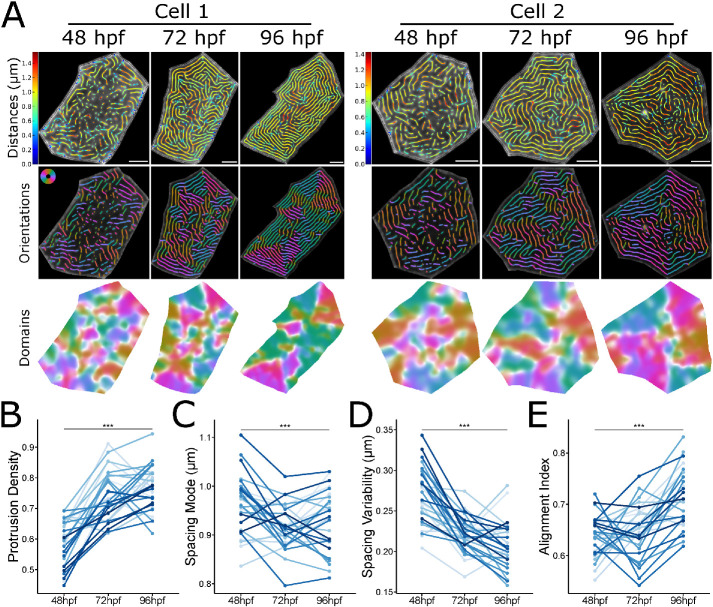
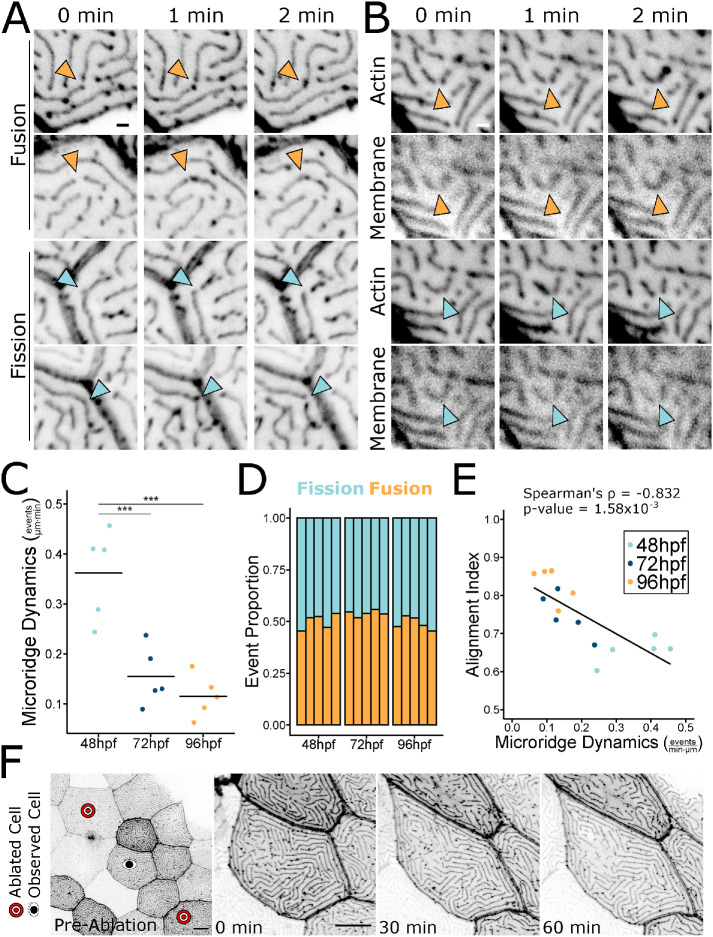
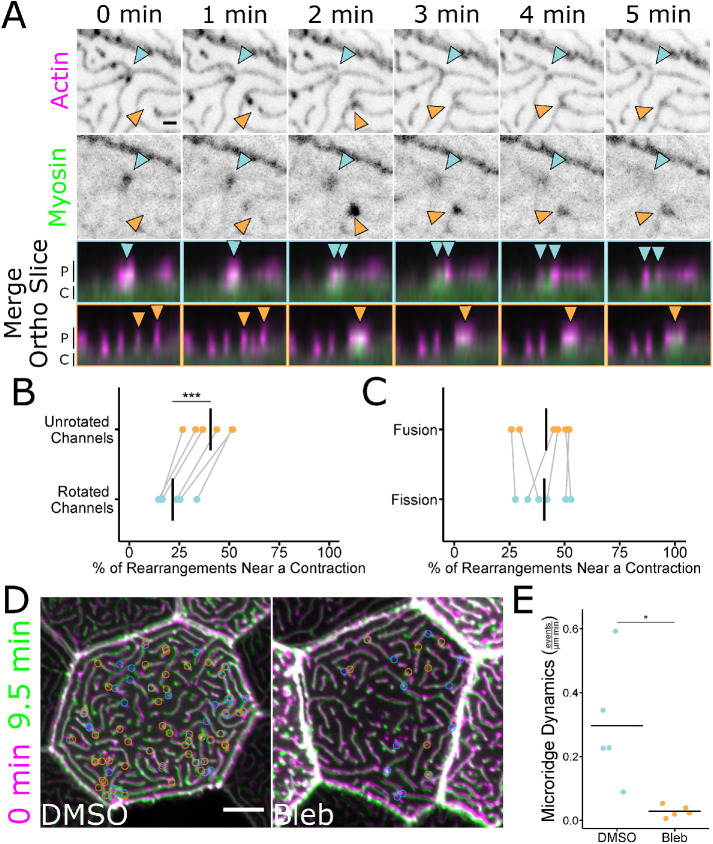
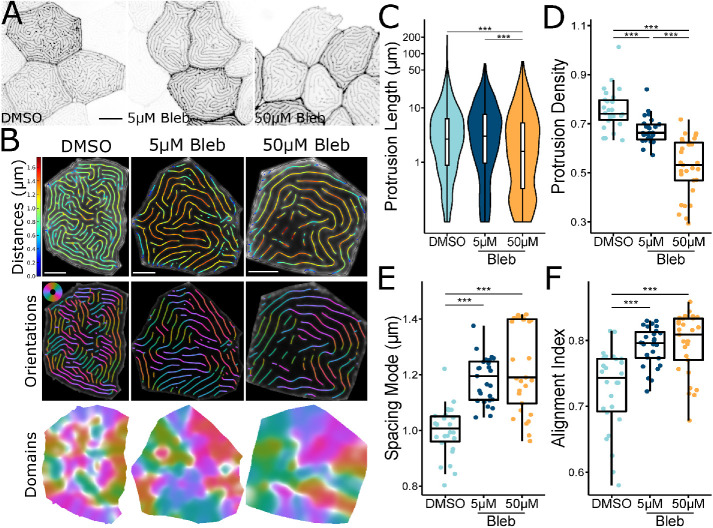
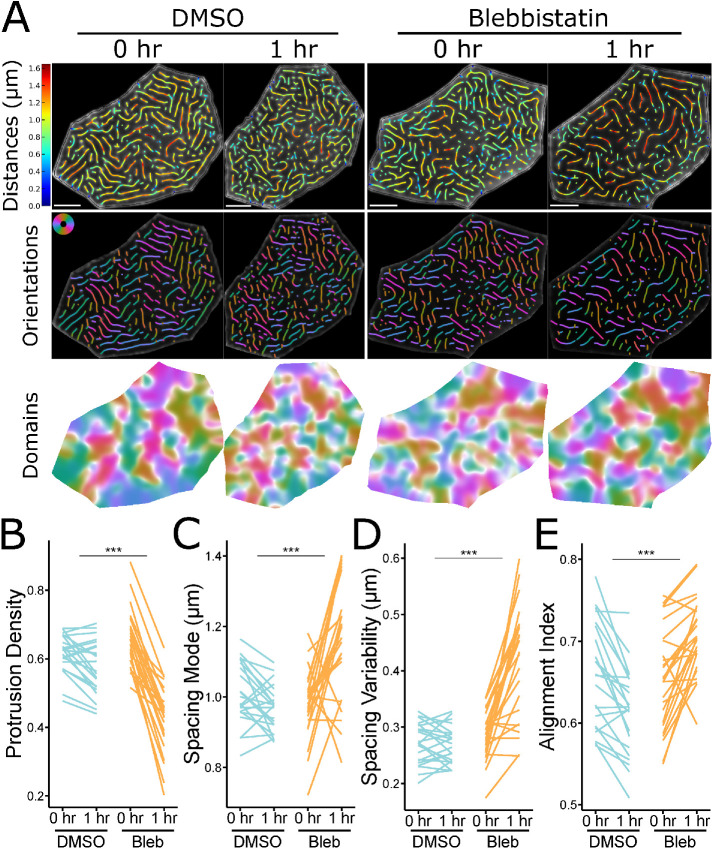
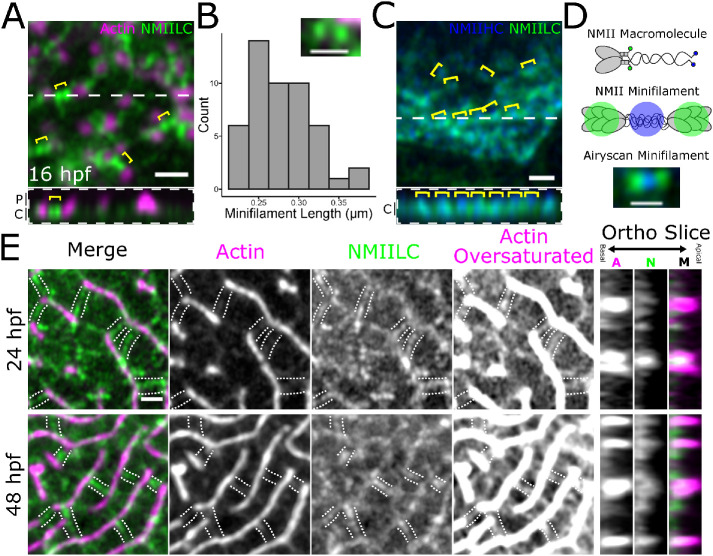
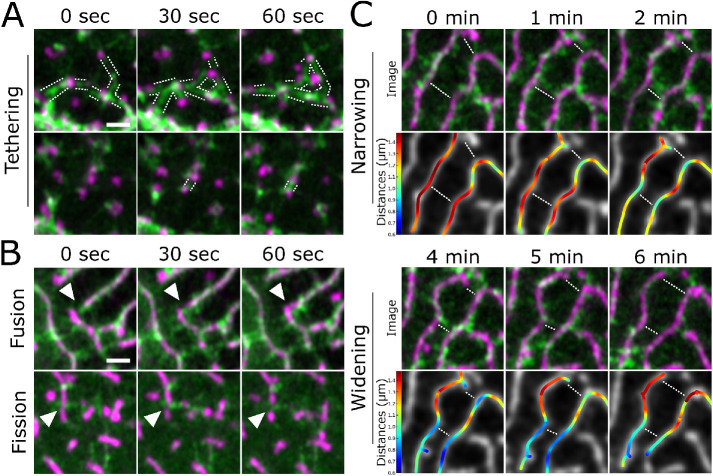
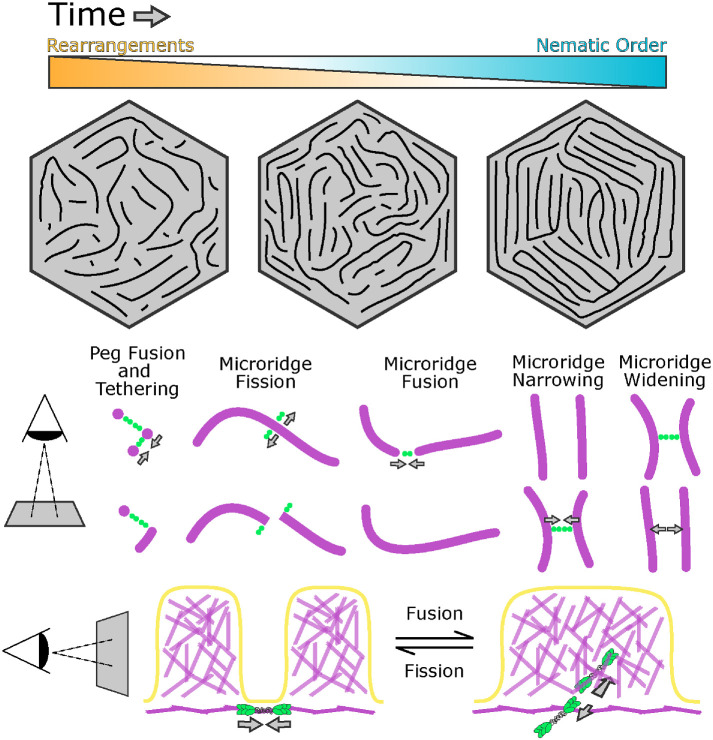
Actin-based protrusions vary in morphology, stability, and arrangement on cell surfaces. Microridges are laterally elongated protrusions on mucosal epithelial cells, where they form evenly spaced, mazelike patterns that dynamically remodel by fission and fusion. To characterize how microridges form their highly ordered, subcellular patterns and investigate the mechanisms driving fission and fusion, we imaged microridges in the maturing skin of zebrafish larvae. After their initial development, microridge spacing and alignment became increasingly well ordered. Imaging F-actin and non-muscle myosin II (NMII) revealed that microridge fission and fusion were associated with local NMII activity in the apical cortex. Inhibiting NMII blocked fission and fusion rearrangements, reduced microridge density, and altered microridge spacing. High-resolution imaging allowed us to image individual NMII minifilaments in the apical cortex of cells in live animals, revealing that minifilaments are tethered to protrusions and often connect adjacent microridges. NMII minifilaments connecting the ends of two microridges fused them together, whereas minifilaments oriented perpendicular to microridges severed them or pulled them closer together. These findings demonstrate that as cells mature, cortical NMII activity orchestrates a remodeling process that creates an increasingly orderly microridge arrangement.


Figures

FIGURE 1:
FIGURE 1:
Microridge patterns mature over time. (A) Representative images of periderm cells expressing Lifeact-GFP in zebrafish larvae at the specified developmental stage. Images were inverted so that high intensity fluorescence appears black and low intensity is white. Inset at 96 hpf is an intensity line profile plot along the dashed red line in the associated image, showing the regular spacing between adjacent microridges along the line. (B) Dot and box-and-whisker plot of microridge density, defined as the sum microridge length (μm) normalized to apical cell area (μm2), on periderm cells at the specified stage; 48 hpf, n = 34 cells from 12 fish; 72 hpf, n = 24 cells from 10 fish; 96 hpf, n = 34 cells from 15 fish. P = 1.87 × 10⁻⁹, one-way ANOVA followed by Tukey’s HSD test: 48–72 hpf, P = 3.32 × 10⁻³; 48–96 hpf, P = 1.17 × 10⁻⁹; 72–96 hpf, P = 6.65 × 10⁻³. (C) Microridge-to-microridge spacing. Top: cropped image of a 96 hpf periderm cell expressing Lifeact-GFP. The blue bracket shows the distance between two adjacent microridges. Bottom: orthogonal optical section from the above periderm cell along the dashed red line at the bottom edge of the XY image. M, microridge protrusions; A, apical; B, basal. Blue bracket shows the distance between the same microridges as above. (D) Visualization of microridge spacing at three developmental stages. Color coding indicates the distance from each point on each microridge to the nearest neighboring microridge. Colors correspond to the distances indicated on the bar to the left. (E) Dot and box-and-whisker plots of the mode distance between neighboring microridges in periderm cells at the specified stage; 48 hpf, n = 34 cells from 12 fish; 72 hpf, n = 24 cells from 10 fish; 96 hpf, n = 34 cells from 15 fish. P = 0.089, one-way ANOVA. (F) Dot and box-and-whisker plot of microridge spacing variability, defined as the interquartile range of distances between neighboring microridges in periderm cells at the specified stages; 48 hpf, n = 34 cells from 12 fish; 72 hpf, n = 24 cells from, 10 fish; 96 hpf n = 34 cells from 15 fish. P = 9.91 × 10⁻¹⁰, one-way ANOVA followed by Tukey’s HSD test: 48–72 hpf, P = 7.72 × 10⁻³; 48–96 hpf, P = 8.11 × 10⁻¹⁰; 72–96 hpf, P = 1.90 × 10⁻³. (G) Visualization of microridge orientations at the specified stages. Microridge orientations are color-coded along each microridge (top); colors correspond to the color wheel on the top left. Microridge alignment domains were expanded from microridge orientations (bottom), using the same color wheel and scale as above. See Materials and Methods for details. (H) Dot and box-and-whisker plot of the microridge alignment index for periderm cells at the specified stages; 48 hpf, n = 34 cells from 12 fish; 72 hpf, n = 24 cells from 10 fish; 96 hpf, n = 34 cells from 15 fish. P = 2.96 × 10⁻¹², one-way ANOVA followed by Tukey’s HSD test: 48–72 hpf, P = 0.121; 48–96 hpf, P = 4.02 × 10⁻¹⁰; 72–96 hpf, P = 8.79 × 10⁻⁷. (I) Diagram of microridge structure and spacing. (YZ) Branched actin fills microridge protrusions, depicted as a lengthwise section, the apical actomyosin cortex is shown below the protrusions. (XZ) Microridge spacing, depicted as a cross-section, is variable after microridge formation (48 hpf), but gradually matures to a more regularly spaced pattern (96 hpf). Scale bars: 10 μm (A) and 5 μm (C, D, and G). *p ≤ 0.05, **p ≤ 0.01, and ***p ≤ 0.001. For box-and-whisker plots, the middle line is the median, and the bottom and top ends of boxes are 25th and 75th percentiles, respectively.
FIGURE 2:
FIGURE 2:
Microridge patterns mature on individual periderm cells. (A) Microridge distances, orientations, and alignment domains in two cells from 48–96 hpf. (B) Line and point plot of microridge density, defined as the sum microridge length (μm) normalized to apical cell area (μm2), in periderm cells over time; n = 28 cells from 9 fish. P = 5.87 × 10⁻¹⁵, one-way repeated measures ANOVA. (C) Line and point plot of the mode distances between neighboring microridges in periderm cells over time. n = 28 cells from 9 fish. P = 4.08 × 10⁻⁴, one-way repeated measures ANOVA. (D) Line and point plot of microridge spacing variability (interquartile range of distances) between neighboring microridges in periderm cells over time; n = 28 cells from 9 fish. P = 7.37 × 10⁻¹¹, one-way repeated measures ANOVA. (E) Line and point plot of microridge alignment index in periderm cells over time; n = 28 cells from 9 fish. P = 5.16 × 10⁻⁸, one-way repeated measures ANOVA. Scale bars: 5 μm (A). ***p ≤ 0.001.
FIGURE 3:
FIGURE 3:
Microridges dynamically rearrange. A) Stills from time-lapse movies of 48 hpf periderm cells expressing Lifeact-GFP, showing microridges undergoing fission or fusion. Orange arrowheads indicate fusion; blue arrowheads indicate fission. Images were inverted, so that high intensity fluorescence appears black and low intensity is white. Images are still frames from Supplemental Video S2. (B) Stills from time-lapse movies of 48 hpf periderm cells expressing Lifeact-GFP (actin) and mRuby-PH-PLC (membrane), showing microridges undergoing fission or fusion. Orange arrowheads indicate fusion; blue arrowheads indicate fission. Images were inverted, so that high intensity fluorescence appears black and low intensity is white. Images are still frames from Supplemental Video S3. (C) Jittered dot plot of the sum of fission and fusion events in each cell, normalized to cell apical area, over a 9.5-min period (events/μm⋅min) at the specified stage. Middle bar represents the mean. n = 5 cells from 5 fish at all stages. P = 1.62 × 10⁻⁴, one-way ANOVA followed by Tukey’s HSD test: 48–72 hpf, P = 9.75 × 10⁻⁴; 48–96 hpf, P = 2.17 × 10⁻⁴; 72–96 hpf, P = 0.629. (D) Stacked bar plot of the proportion of fission and fusion events indicated stages. Each bar represents one cell, n = 5 cells from 5 fish at all developmental stages. Fusion events were used in a Test of Equal Proportions (P = 0.224) and fusion event proportion estimates were 0.501, 0.543, and 0.488 for 48, 72, and 96 hpf, respectively. (E) Scatter plot of microridge dynamics (events/μm⋅min) over a 9.5-min period vs. the microridge alignment index at the start of the 9.5-min period; n = 5 cells from 5 fish at all developmental stages. P = 1.16 × 10⁻⁴, Spearman’s rank correlation ρ = –0.832. (F) Stills from a time-lapse movie of Lifeact-GFP-expressing periderm cells stretching in response to neighbor cell ablation in a 72 hpf zebrafish. Preablation image shows the cell of interest between the ablated cells and the images of the cell of interest immediately after ablation (0 min) and at 30-min intervals after ablation. The cell stretched dramatically, but microridge rearrangements did not appreciably increase. Microridge rearrangements occurred at a rate of 0.00393 events/μm⋅min over the course of the video (compare to rates in C). Images were inverted, so that high intensity fluorescence appears black and low intensity is white. Images are still frames from Supplemental Video S4. Scale bars: 1 μm (A and B) and 10 μm (E). ***p ≤ 0.001.
FIGURE 4:
FIGURE 4:
Microridge rearrangements spatially and temporally correlate with NMII contraction. (A) Stills from a time-lapse movie of 48 hpf zebrafish periderm cells expressing Lifeact-mRuby (actin) and Myl12.1-EGFP (myosin). Microridge fission occurred as a myosin contraction event dissipated (blue arrowheads). Microridges fused as a myosin contraction intensified (orange arrowheads). Merged images show the microridge protrusions (P) and apical cortex (C) of the above fission (blue arrowheads and borders) and fusion (orange arrowheads and borders) events from an orthogonal view. Single-channel images were inverted, so that high intensity fluorescence appears black and low intensity is white. Images are still frames from Supplemental Video S5. (B) Dot plot of the percentage of microridge fission and fusion events within 1 μm of an NMII contraction over a 9.5-min period. The graph compares unrotated channels to data analyzed after rotating the NMII fluorescence channel 90° relative to the actin fluorescence channel. The gray lines connect the unrotated samples to their rotated counterparts; n = 6 cells from 6 fish, including 3 cells from 3 fish at 24 hpf and 3 cells from 3 fish at 48 hpf. P = 2.27 × 10⁻⁴, paired t test. (C) Dot plot of the percentage of microridge fission and fusion events within 1 μm of an NMII contraction event over a 9.5-min period. The graph compares contraction-associated fusion events to contraction-associated fission events in the same cells. The gray lines connect points from the same cell; n = 6 cells from 6 fish, including 3 cells from 3 fish at 24 hpf and 3 cells from 3 fish at 48 hpf. P = 0.778, paired t test. (D) Overlap frames from 9.5-min time-lapse movies of 49 hpf zebrafish periderm cells expressing Lifeact-GFP after 1-h exposure to 1% DMSO (vehicle control) or 50 μM blebbistatin. Circles indicate the locations where fission (blue) and fusion (orange) events were detected over the course of the 9.5-min movies (frames were collected at 30-s intervals). Overlapped images are from Supplemental Video S6. (E) Jittered dot plot of the sum of fission and fusion events in each cell, normalized to cell apical area, over a 9.5-min period (events/μm⋅min) in cells after 1-h exposure to 1% DMSO (vehicle control) or 50 μM blebbistatin; n = 5 cells from 5 fish for control and treatment. P = 0.033, unpaired t test. Scale bars: 1 μm (A) and 5 μm (D). *p ≤ 0.05 and ***p ≤ 0.001. Bars in dot plots represent the mean.
FIGURE 5:
FIGURE 5:
Inhibiting NMII changes microridge patterns. (A) Representative images of periderm cells expressing Lifeact-GFP on 72 hpf zebrafish after 24-h exposure to the specified concentration of blebbistatin or vehicle control (DMSO). Images were inverted, so that high intensity fluorescence appears black and low intensity is white. (B) Visualizations of microridge distances, orientations, and alignment domains from periderm cells at 72 hpf, after 24-h exposure to the specified concentration of blebbistatin or vehicle control (DMSO). (C) Violin and box-and-whisker plot of projection length for periderm cells in 72 hpf zebrafish, after 24-h exposure to the specified concentration of blebbistatin or vehicle control (DMSO). DMSO, n = 26 cells from 9 fish; 5 μM blebbistatin, n = 27 cells from 9 fish; 50 μM blebbistatin, n = 29 cells from 9 fish. P < 2.2 × 10⁻¹⁶, Kruskal–Wallis test followed by Dunn’s test with Benjamini-Hochberg p value adjustment: DMSO-5 μM blebbistatin, P = 0.173; DMSO-50 μM blebbistatin, P = 2.51 × 10⁻¹³; 5 μM blebbistatin-50 μM blebbistatin, P = 3.79 × 10⁻¹⁷. (D) Dot and box-and-whisker plot of microridge density, defined as the sum microridge length (μm) normalized to apical cell area (μm2), for periderm cells in 72 hpf zebrafish after 24-h exposure to the specified concentration of blebbistatin or vehicle control (DMSO). DMSO, n = 26 cells from 9 fish; 5 μM blebbistatin, n = 27 cells from 9 fish; 50 μM blebbistatin, n = 29 cells from 9 fish. P = 2.80 × 10⁻¹⁴, one-way ANOVA followed by Tukey’s HSD test: DMSO-5 μM blebbistatin, P = 3.07 × 10⁻³; DMSO-50 μM blebbistatin, P <2 × 10–16; 5 μM blebbistatin-50 μM blebbistatin, P = 7.70 × 10⁻⁸. (E) Dot and box-and-whisker plot of the mode distance between neighboring microridges in periderm cells in 72 hpf zebrafish after 24-h exposure to the specified concentration of blebbistatin or vehicle control (DMSO). DMSO, n = 26 cells from 9 fish; 5 μM blebbistatin, n = 27 cells from 9 fish; 50 μM blebbistatin, n = 29 cells from 9 fish. P = 0.318, one-way ANOVA. (F) Dot and box-and-whisker plot of the alignment index on periderm cells in 72 hpf zebrafish after 24-h exposure to the specified concentration of blebbistatin or vehicle control (DMSO). DMSO, n = 26 cells from 9 fish; 5 μM blebbistatin, n = 27 cells from 9 fish; 50 μM blebbistatin, n = 29 cells from 9 fish. P = 4.56 × 10⁻⁷, one-way ANOVA followed by Tukey’s HSD test: DMSO-5 μM blebbistatin, P = 1.11 × 10⁻⁵; DMSO-50 μM blebbistatin, P = 2.38 × 10⁻⁶; 5 μM blebbistatin-50 μM blebbistatin, P = 0.951. Scale bars: 10 µm (A) and 5 μm (B). **p ≤ 0.01 and ***p ≤ 0.001. For box-and-whisker plots, the middle line is the median, and bottom and top ends of boxes are 25th and 75th percentiles, respectively.
FIGURE 6:
FIGURE 6:
Short-term inhibition of NMII contractility alters microridge patterns in individual cells. (A) Representative visualizations of microridge distances, orientations, and alignment domains in periderm cells expressing Lifeact-GFP before (48 hpf, 0 h) and after (49 hpf, 1 h) 1-h treatment with 50 μM blebbistatin or vehicle (DMSO). (B) Line plot of microridge density, defined as the sum microridge length (μm) normalized to apical cell area (μm2), from periderm cells before (48 hpf, 0 h) and after (49 hpf, 1 h) 1-h treatment with 50 μM blebbistatin or vehicle control (DMSO). DMSO, n = 22 cells from 4 fish; 50 μM blebbistatin, n = 25 cells from 4 fish. P = 4.09 × 10⁻¹¹, one-way repeated measures ANOVA. (C) Line plot of microridge spacing mode from periderm cells before (48 hpf, 0 h) and after (49 hpf, 1 h) 1-h treatment with 50 μM blebbistatin or vehicle control (DMSO). DMSO, n = 22 cells from 4 fish; 50 μM blebbistatin, n = 25 cells from 4 fish. P = 7.76 × 10⁻⁶, one-way repeated measures ANOVA. (D) Line plot of microridge spacing variability (interquartile range of distances) between neighboring microridges in periderm cells before (48 hpf, 0 h) and after (49 hpf, 1 h) 1-h treatment with 50 μM blebbistatin or vehicle control (DMSO). DMSO, n = 22 cells from 4 fish; 50 μM blebbistatin, n = 25 cells from 4 fish. P < 2 × 10–16, one-way repeated measures ANOVA. (E) Line plot of the alignment index in periderm cells before (48 hpf, 0 h) and after (49 hpf, 1 h) 1-h treatment with 50 μM blebbistatin or vehicle control (DMSO). Note that control treatment with DMSO decreased alignment, likely reflecting disruption of the pattern by the mounting and unmounting procedure required for this experiment, but treatment with blebbistatin increased alignment, emphasizing the role of NMII in this process. DMSO, n = 22 cells from 4 fish; 50 μM blebbistatin, n = 25 cells from 4 fish. P = 1.02 × 10⁻⁸, one-way repeated measures ANOVA. Scale bars: 5 μm (A). ***p ≤ 0.001.
FIGURE 7:
FIGURE 7:
NMII minifilaments connect adjacent pegs and microridges. (A) Airyscan image of a 16 hpf zebrafish periderm cell expressing fluorescent reporters for actin (Lifeact-Ruby) and NMII light chain (Myl12.1-GFP). Pairs of green puncta (yellow brackets) appear in the cortex between adjacent pegs (magenta puncta). Below is an orthogonal view of the peg protrusions (P) and apical cortex (C) along the dashed white line in the top image. (B) Histogram of distances between the intensity maxima of presumptive NMII minifilaments. Inset is a representative image showing GFP signal at opposing ends of a presumptive NMII minifilament in a periderm cell expressing reporters for actin (Lifeact-Ruby) and NMII light chain (Myl12.1-GFP); n = 49 minifilaments from 4 cells on 4 fish. (C) Airyscan image of a 24 hpf zebrafish periderm cell expressing fluorescent reporters for NMII heavy chain (NMIIHC, Myh9a-mCherry) and NMII light chain (NMIILC, Myl12.1-GFP). NMIIHC channel was pseudo-colored blue. Yellow brackets show examples of GFP-mCherry-GFP fluorescence patterns. Below is an orthogonal view of apical cortex (C) along the dashed white line in the top image. (D) Diagram of NMII fluorescent protein fusion design and expected NMII minifilament fluorescence pattern. The top graphic shows an NMII macromolecule, composed of two heavy chains, two essential light chains, and two regulatory light chains. GFP was fused to the regulatory light chains (Myl12.1-GFP), while mCherry was fused to the tail of the heavy chains (Myh9a-mCherry; represented in blue). The middle graphic shows the expected fluorescence pattern when multiple NMII macromolecules, labeled like the one in the top graphic, assemble into an NMII minifilament. The bottom Airyscan image shows an NMII minifilament in the cortex of a 24 hpf zebrafish periderm cell expressing Myl12.1-GFP and Myh9a-mCherry. (E) Airyscan images showing NMII minifilaments connecting adjacent microridges side-to-side and end-to-end during (24 hpf) and after (48 hpf) microridge formation in periderm cells expressing reporters for actin (Lifeact-Ruby) and NMII light chain (Myl12.1-GFP). The oversaturated images reveal actin filaments in the cortex. The panels to the right show actin (C), NMII (N),s and merged channels (M) in an orthogonal section. The dotted lines track along NMII minifilament “bridges” and F-actin in the apical cortex. Scale bars: 1 μm (A, C, and E) and 500 nm (B and D)
FIGURE 8:
FIGURE 8:
NMII minifilaments dynamically connect pegs and organize microridge rearrangements. A) Airyscan time-lapse images of NMII minifilaments dynamically connecting pegs as they emerge in the cortex of a periderm cell expressing fluorescent reporters for actin (Lifeact-mRuby) and NMII (Myl12.1-GFP). The dotted lines track along NMII minifilament “bridges.” Images are still frames from Supplemental Video S7. (B) Airyscan time-lapse images of microridge rearrangements (white arrowheads) in periderm cells expressing fluorescent reporters for actin (Lifeact-mRuby) and NMII (Myl12.1-GFP). In the top panels, an NMII minifilament connects the ends of adjacent microridges, fusing them together. In the bottom panels, NMII minifilaments oriented perpendicular to a microridge appear to sever it. Images are still frames from Supplemental Video S7. (C) Stills from an Airyscan time-lapse movie showing the spacing between microridges narrowing (first 2 min; top) and then widening (last 2 min; bottom) in a periderm cell expressing fluorescent reporters for actin (Lifeact-mRuby) and NMII (Myl12.1-GFP). Top rows show Airyscan images; bottom rows show color-coded distances. The top two rows show NMII minifilaments connecting adjacent microridges and apparently pulling them together. The bottom two rows show the NMII minifilament bridge between microridges dissipating as the adjacent microridges move further apart. The dotted lines highlight narrowing and widening regions. Distance map colors correspond to color bars on the left. Images are still frames from Supplemental Video S7. Scale bars: 1 μm (A and B).
FIGURE 9:
FIGURE 9:
Model for microridge maturation and minifilament-mediated rearrangements. Top: the nematic order of microridge patterns increases as rearrangements decrease in frequency. Bottom: the orientation of NMII minifilaments determines the outcome of rearrangement events and regulates spacing (see Discussion).

Similar articles

Cited by

References

    1. Bement WM, Leda M, Moe AM, Kita AM, Larson ME, Golding AE, Pfeuti C, Su K-C, Miller AL, Goryachev AB, von Dassow G (2015). Activator-inhibitor coupling between Rho signalling and actin assembly makes the cell cortex an excitable medium. Nat Cell Biol 17, 1471–1483. - PMC - PubMed
    1. Billington N, Wang A, Mao J, Adelstein RS, Sellers JR (2013). Characterization of three full-length human nonmuscle myosin II paralogs. J Biol Chem 288, 33398–33410. - PMC - PubMed
    1. Chinowsky CR, Pinette JA, Meenderink LM, Lau KS, Tyska MJ (2020). Non-muscle myosin-2 contractility-dependent actin turnover limits the length of epithelial microvilli. Mol Biol Cell mbcE20090582. - PMC - PubMed
    1. Çolakog˘lu G, Brown A (2009). Intermediate filaments exchange subunits along their length and elongate by end-to-end annealing. J Cell Biol 185, 769–777. - PMC - PubMed
    1. Costa M, Draper BW, Priess JR (1997). The role of actin filaments in patterning the Caenorhabditis elegans cuticle. Dev Biol 184, 373–384. - PubMed

Publication types

LinkOut - more resources