

Patterns in COVID-19 Vaccination Coverage, by Social Vulnerability and Urbanicity - United States, December 14, 2020-May 1, 2021
- PMID: 34081685
- PMCID: PMC8174677
- DOI: 10.15585/mmwr.mm7022e1
Patterns in COVID-19 Vaccination Coverage, by Social Vulnerability and Urbanicity - United States, December 14, 2020-May 1, 2021
Abstract
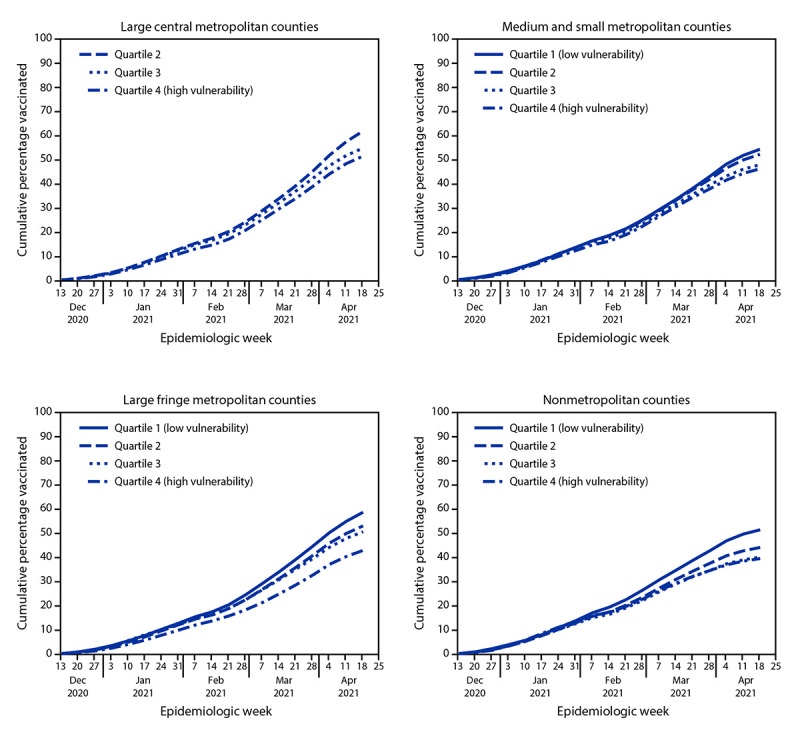
Disparities in vaccination coverage by social vulnerability, defined as social and structural factors associated with adverse health outcomes, were noted during the first 2.5 months of the U.S. COVID-19 vaccination campaign, which began during mid-December 2020 (1). As vaccine eligibility and availability continue to expand, assuring equitable coverage for disproportionately affected communities remains a priority. CDC examined COVID-19 vaccine administration and 2018 CDC social vulnerability index (SVI) data to ascertain whether inequities in COVID-19 vaccination coverage with respect to county-level SVI have persisted, overall and by urbanicity. Vaccination coverage was defined as the number of persons aged ≥18 years (adults) who had received ≥1 dose of any Food and Drug Administration (FDA)-authorized COVID-19 vaccine divided by the total adult population in a specified SVI category.† SVI was examined overall and by its four themes (socioeconomic status, household composition and disability, racial/ethnic minority status and language, and housing type and transportation). Counties were categorized into SVI quartiles, in which quartile 1 (Q1) represented the lowest level of vulnerability and quartile 4 (Q4), the highest. Trends in vaccination coverage were assessed by SVI quartile and urbanicity, which was categorized as large central metropolitan, large fringe metropolitan (areas surrounding large cities, e.g., suburban), medium and small metropolitan, and nonmetropolitan counties.§ During December 14, 2020-May 1, 2021, disparities in vaccination coverage by SVI increased, especially in large fringe metropolitan (e.g., suburban) and nonmetropolitan counties. By May 1, 2021, vaccination coverage was lower among adults living in counties with the highest overall SVI; differences were most pronounced in large fringe metropolitan (Q4 coverage = 45.0% versus Q1 coverage = 61.7%) and nonmetropolitan (Q4 = 40.6% versus Q1 = 52.9%) counties. Vaccination coverage disparities were largest for two SVI themes: socioeconomic status (Q4 = 44.3% versus Q1 = 61.0%) and household composition and disability (Q4 = 42.0% versus Q1 = 60.1%). Outreach efforts, including expanding public health messaging tailored to local populations and increasing vaccination access, could help increase vaccination coverage in high-SVI counties.
Conflict of interest statement
All authors have completed and submitted the International Committee of Medical Journal Editors form for disclosure of potential conflicts of interest. No potential conflicts of interest were disclosed.
Figures
References
-
- Agency for Toxic Substances and Disease Registry. CDC/ATSDR social vulnerability index. Atlanta, GA: US Department of Health and Human Services, CDC and Agency for Toxic Substances and Disease Registry; 2021. https://www.atsdr.cdc.gov/placeandhealth/svi/index.html
-
- Office of the President of the United States. National strategy for the COVID-19 response and pandemic preparedness. Washington, DC: White House; 2021. https://www.whitehouse.gov/wp-content/uploads/2021/01/National-Strategy-...
MeSH terms
Substances
LinkOut - more resources
Full Text Sources
Medical
Research Materials
