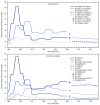
Estimated Annual Number of HIV Infections ─ United States, 1981-2019
- PMID: 34081686
- PMCID: PMC8174674
- DOI: 10.15585/mmwr.mm7022a1
Estimated Annual Number of HIV Infections ─ United States, 1981-2019
Abstract
The first cases of Pneumocystis carinii (jirovecii) pneumonia among young men, which were subsequently linked to HIV infection, were reported in the MMWR on June 5, 1981 (1). At year-end 2019, an estimated 1.2 million persons in the United States were living with HIV infection (2). Using data reported to the National HIV Surveillance System, CDC estimated the annual number of new HIV infections (incidence) among persons aged ≥13 years in the United States during 1981-2019. Estimated annual HIV incidence increased from 20,000 infections in 1981 to a peak of 130,400 infections in 1984 and 1985. Incidence was relatively stable during 1991-2007, with approximately 50,000-58,000 infections annually, and then decreased in recent years to 34,800 infections in 2019. The majority of infections continue to be attributable to male-to-male sexual contact (63% in 1981 and 66% in 2019). Over time, the proportion of HIV infections has increased among Black/African American (Black) persons (from 29% in 1981 to 41% in 2019) and among Hispanic/Latino persons (from 16% in 1981 to 29% in 2019). Despite the lack of a cure or a vaccine, today's HIV prevention tools, including HIV testing, prompt and sustained treatment, preexposure prophylaxis, and comprehensive syringe service programs, provide an opportunity to substantially decrease new HIV infections. Intensifying efforts to implement these strategies equitably could accelerate declines in HIV transmission, morbidity, and mortality and reduce disparities.
Conflict of interest statement
All authors have completed and submitted the International Committee of Medical Journal Editors form for disclosure of potential conflicts of interest. No potential conflicts of interest were disclosed.
Figures


References
-
- CDC. Pneumocystis pneumonia—Los Angeles. MMWR Morb Mortal Wkly Rep 1981;30:250–2.https://www.cdc.gov/mmwr/preview/mmwrhtml/lmrk077.htm - PubMed
-
- CDC. HIV surveillance data tables. Vol 2, no. 2. Core indicators for monitoring the Ending the HIV Epidemic initiative (early release): National HIV Surveillance System data reported through December 2020; and preexposure prophylaxis (PrEP) data reported through September 2020. Atlanta, GA: US Department of Health and Human Services, CDC; 2021. https://www.cdc.gov/hiv/library/reports/surveillance-data-tables/vol-2-n...
MeSH terms
LinkOut - more resources
Full Text Sources
Medical

