. 2021 Jul 1;81(13):2752-2764.e6.
doi: 10.1016/j.molcel.2021.05.008. Epub 2021 Jun 2.

ATF3 coordinates serine and nucleotide metabolism to drive cell cycle progression in acute myeloid leukemia

Affiliations

ATF3 coordinates serine and nucleotide metabolism to drive cell cycle progression in acute myeloid leukemia

Daniela Di Marcantonio et al. Mol Cell. .

Abstract

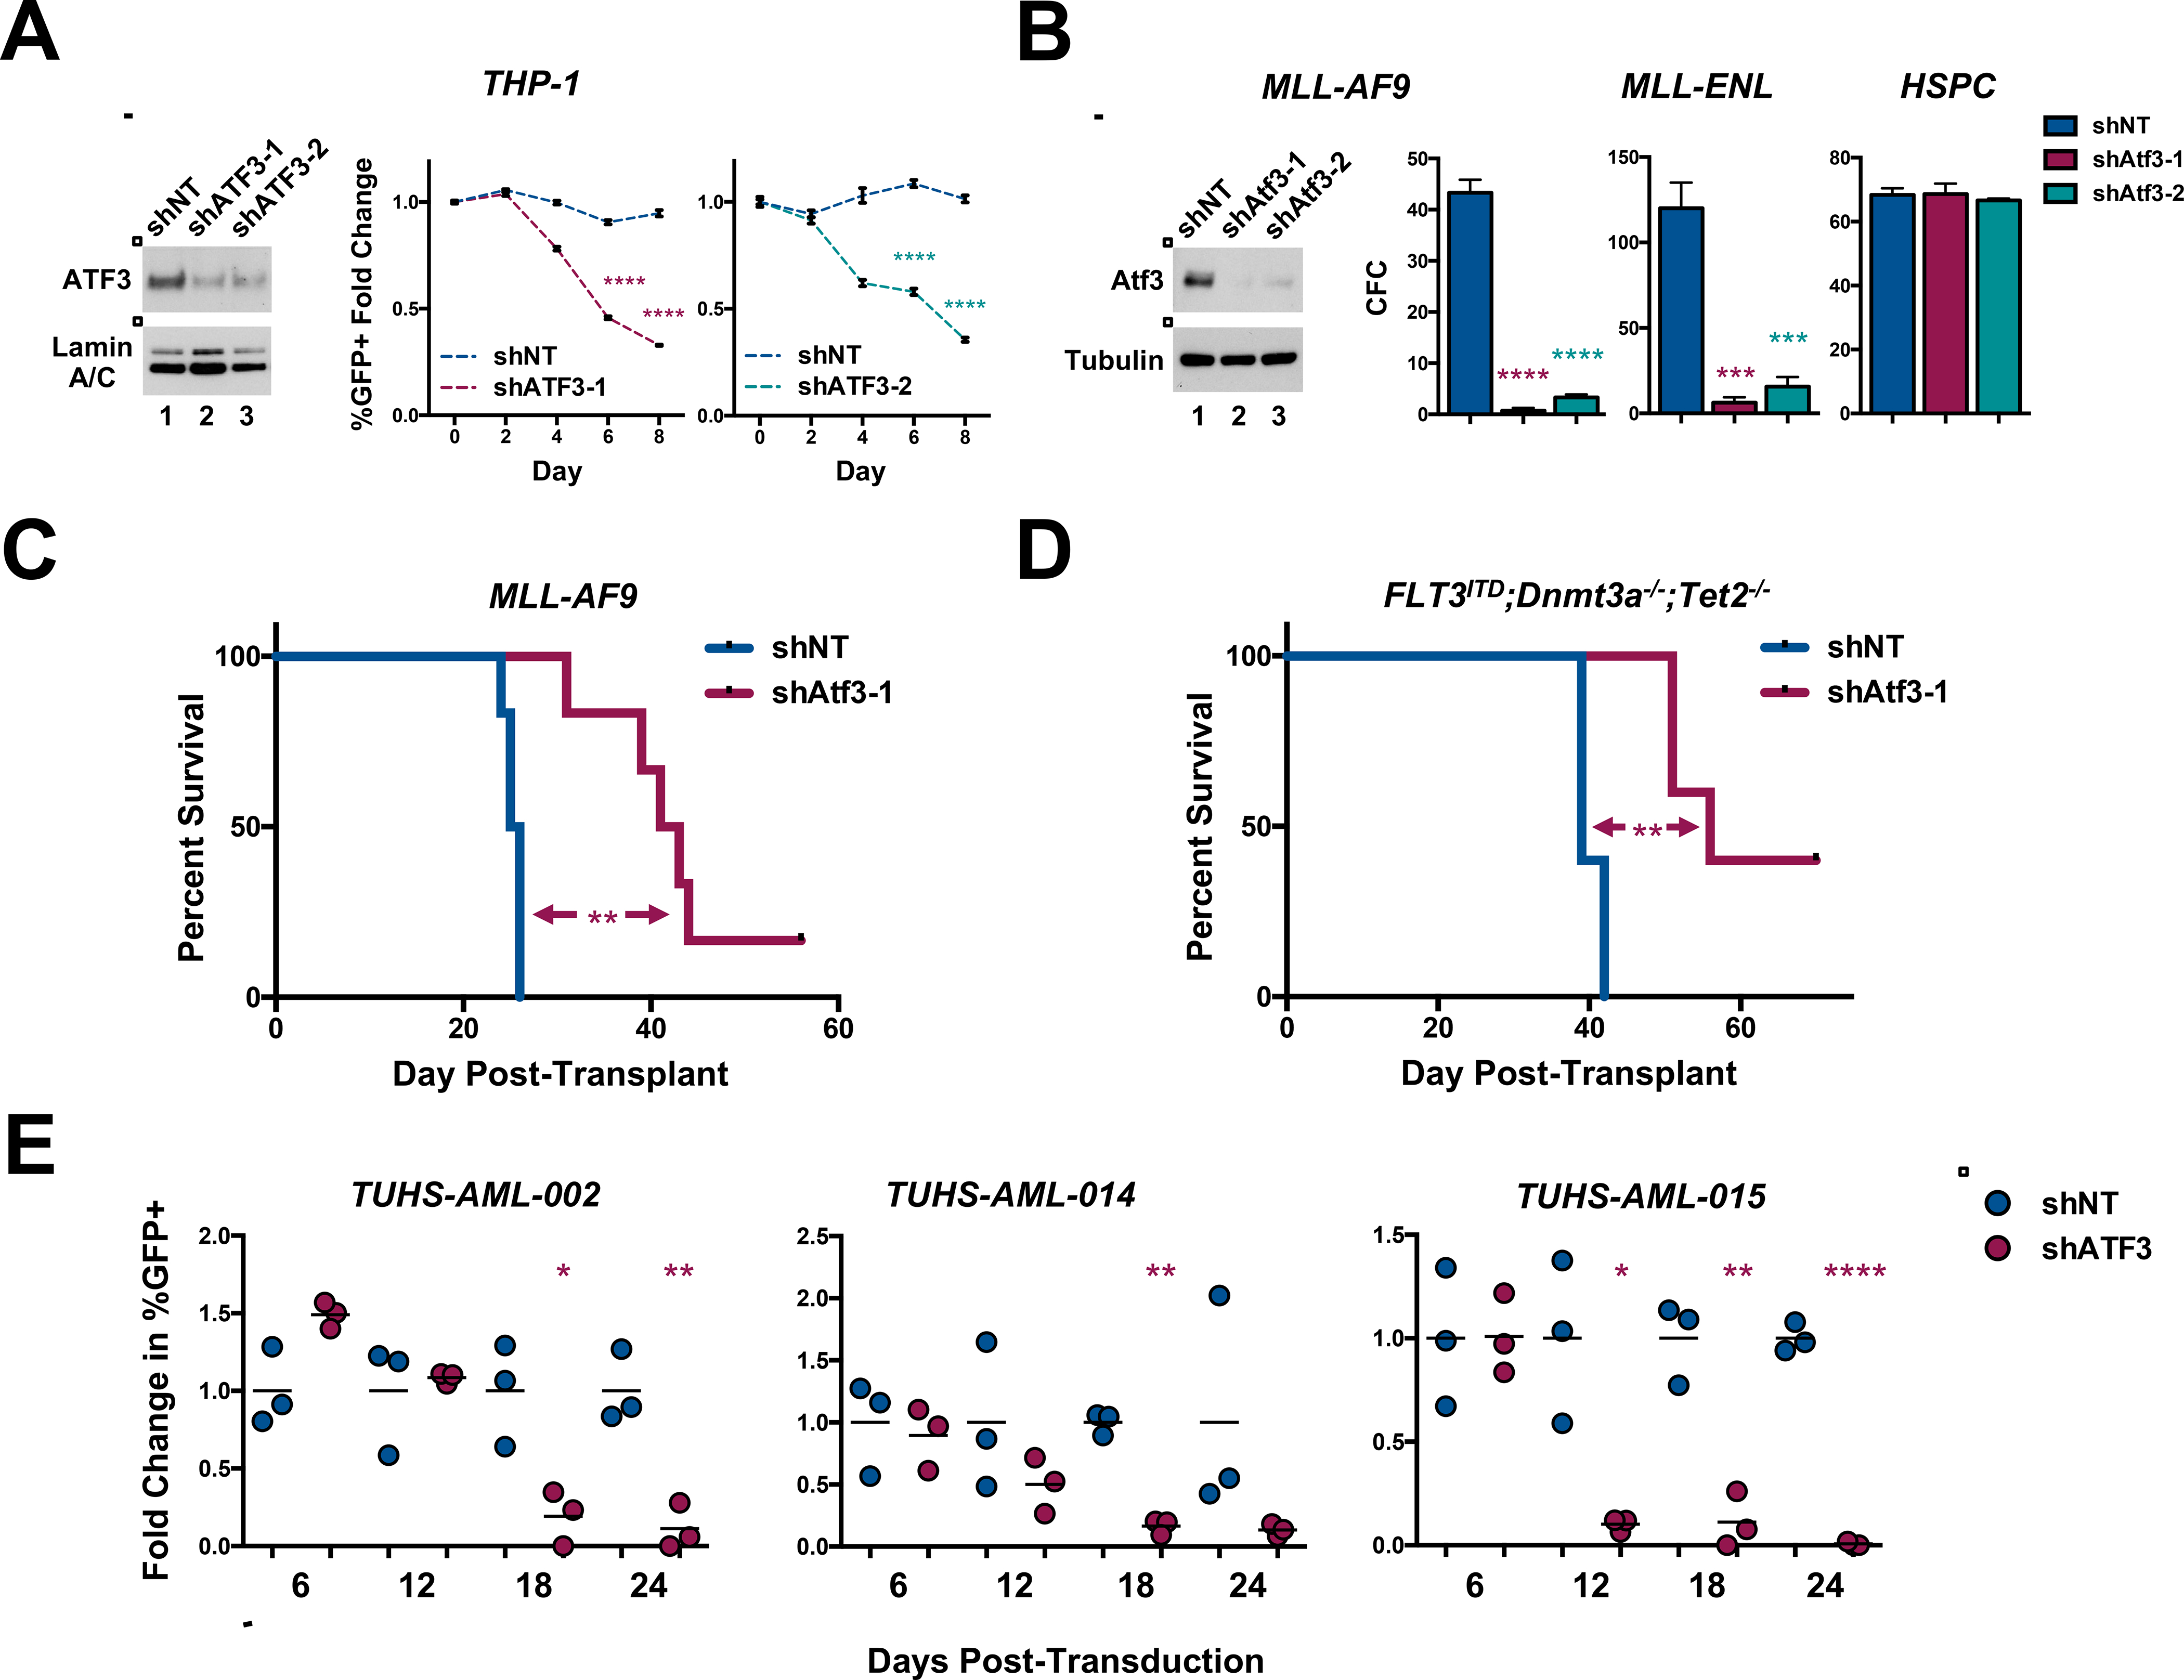
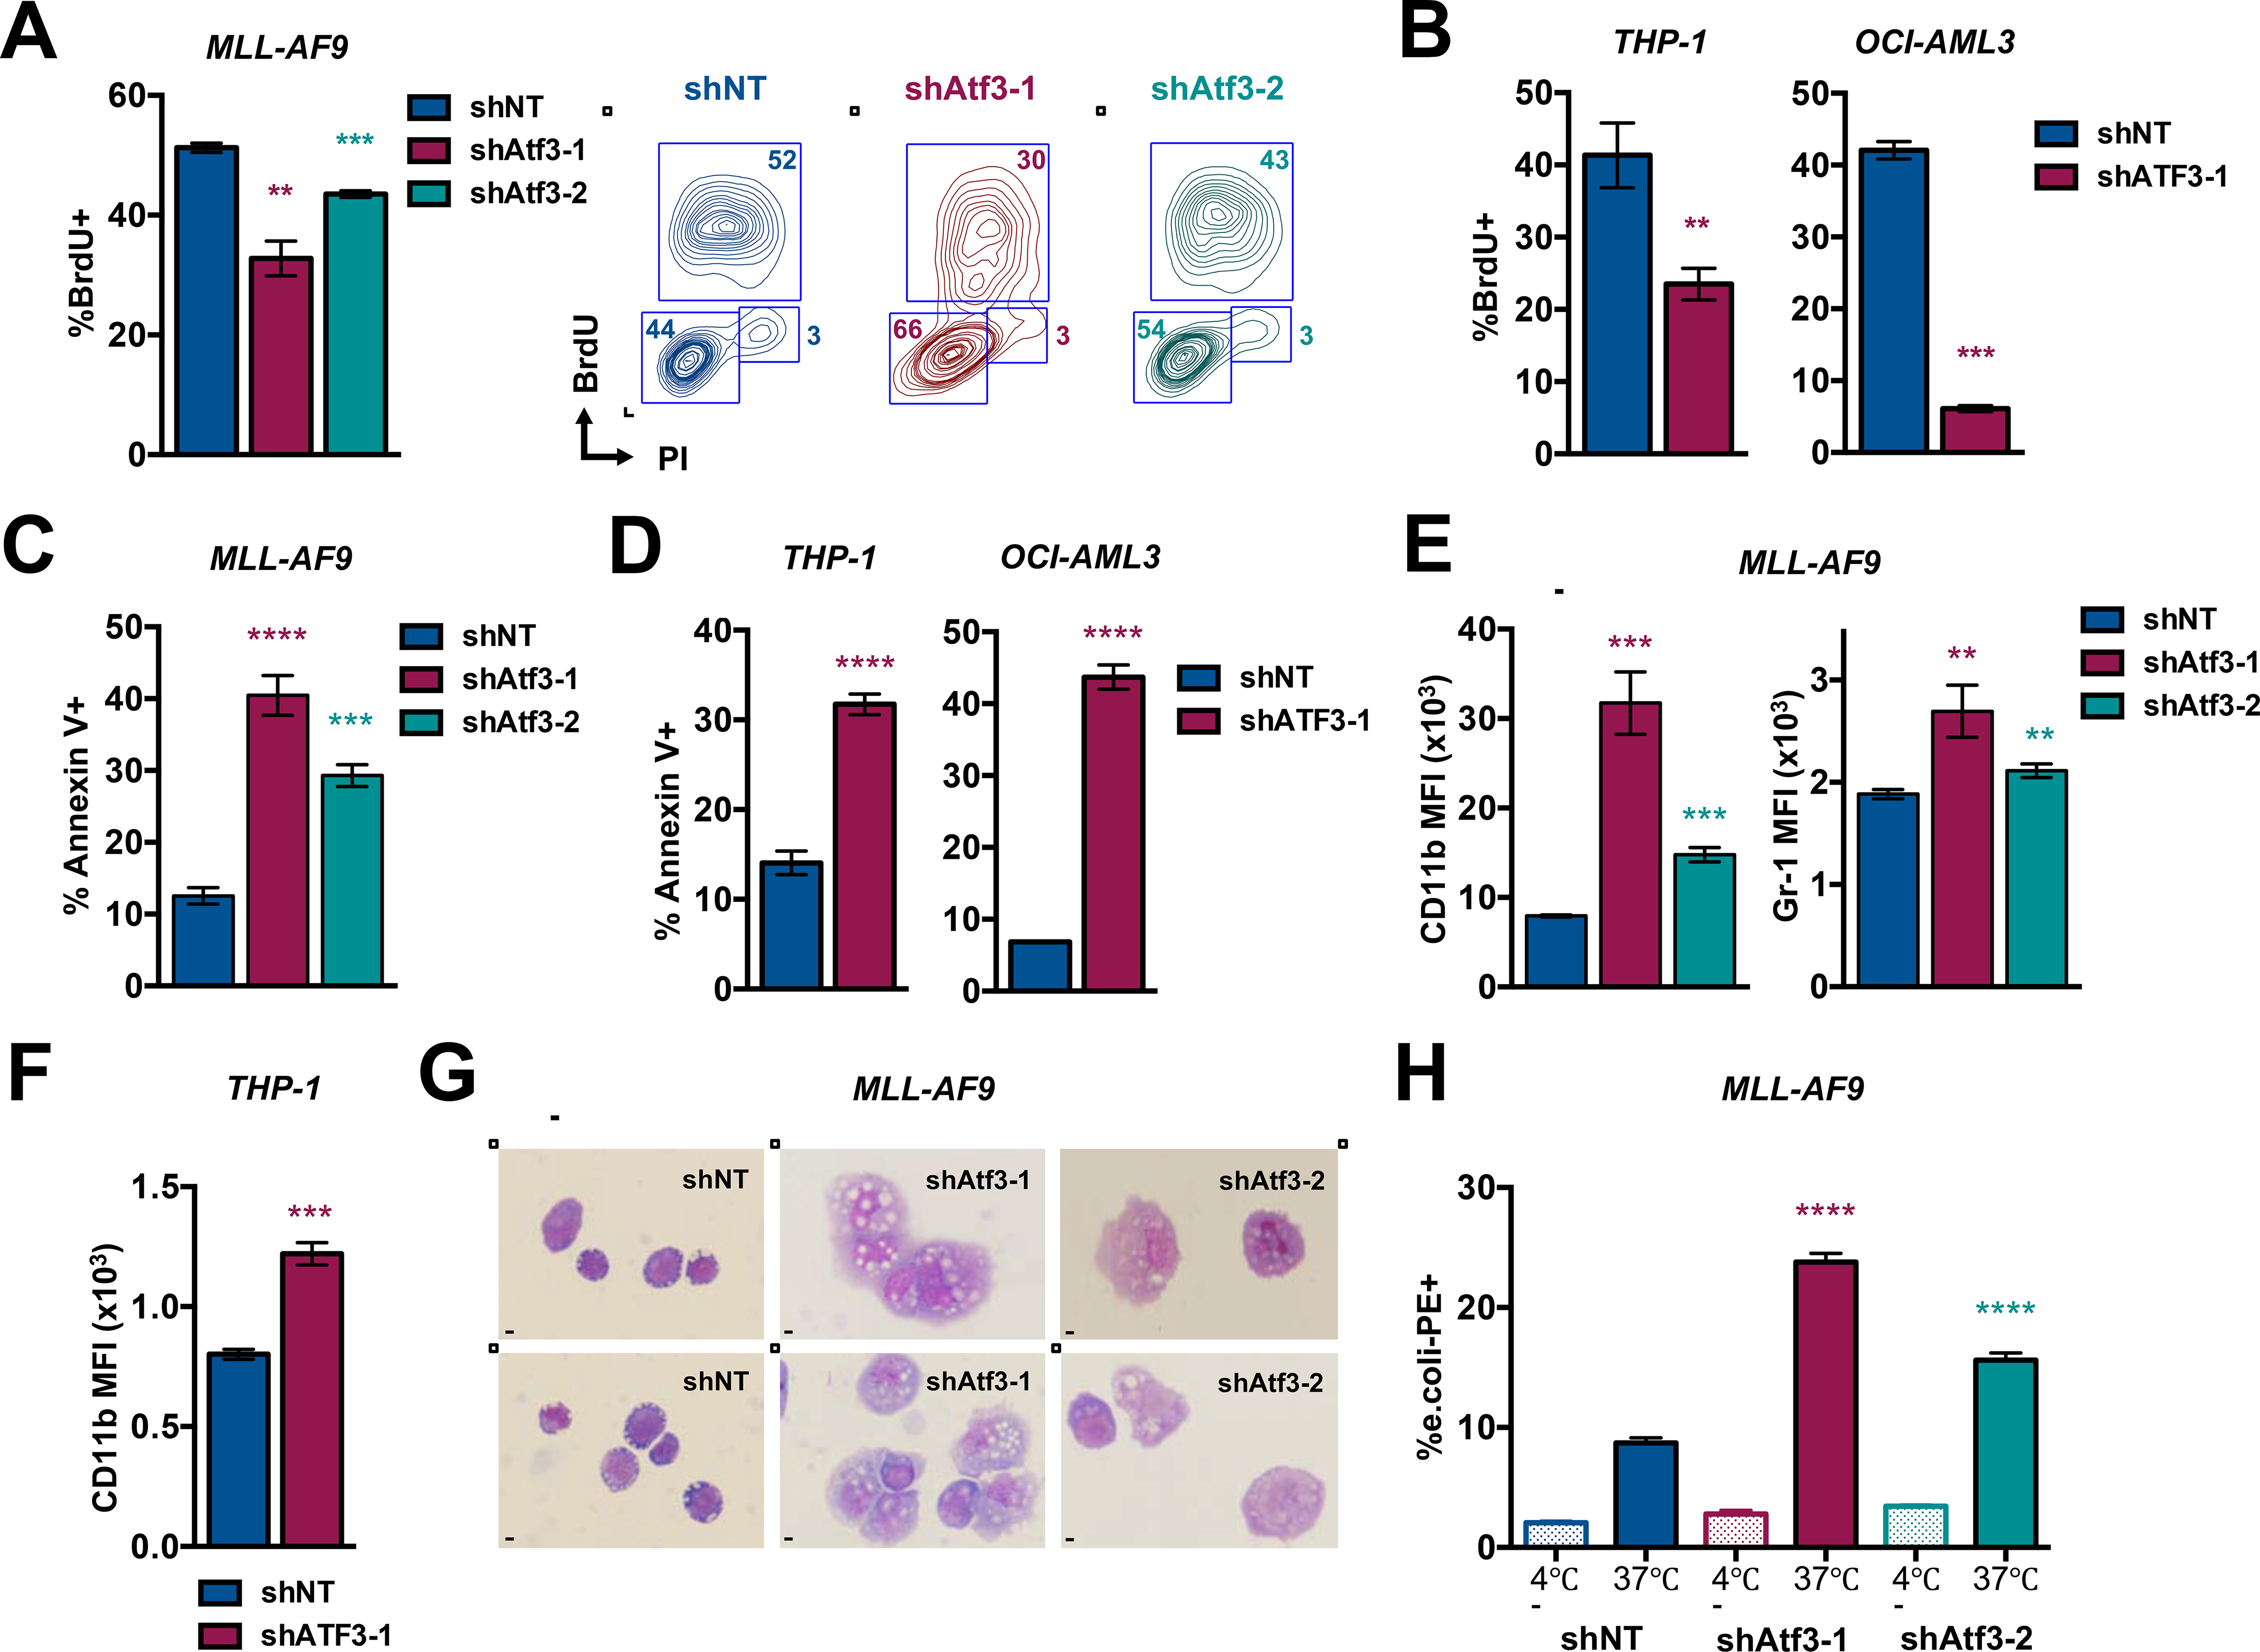
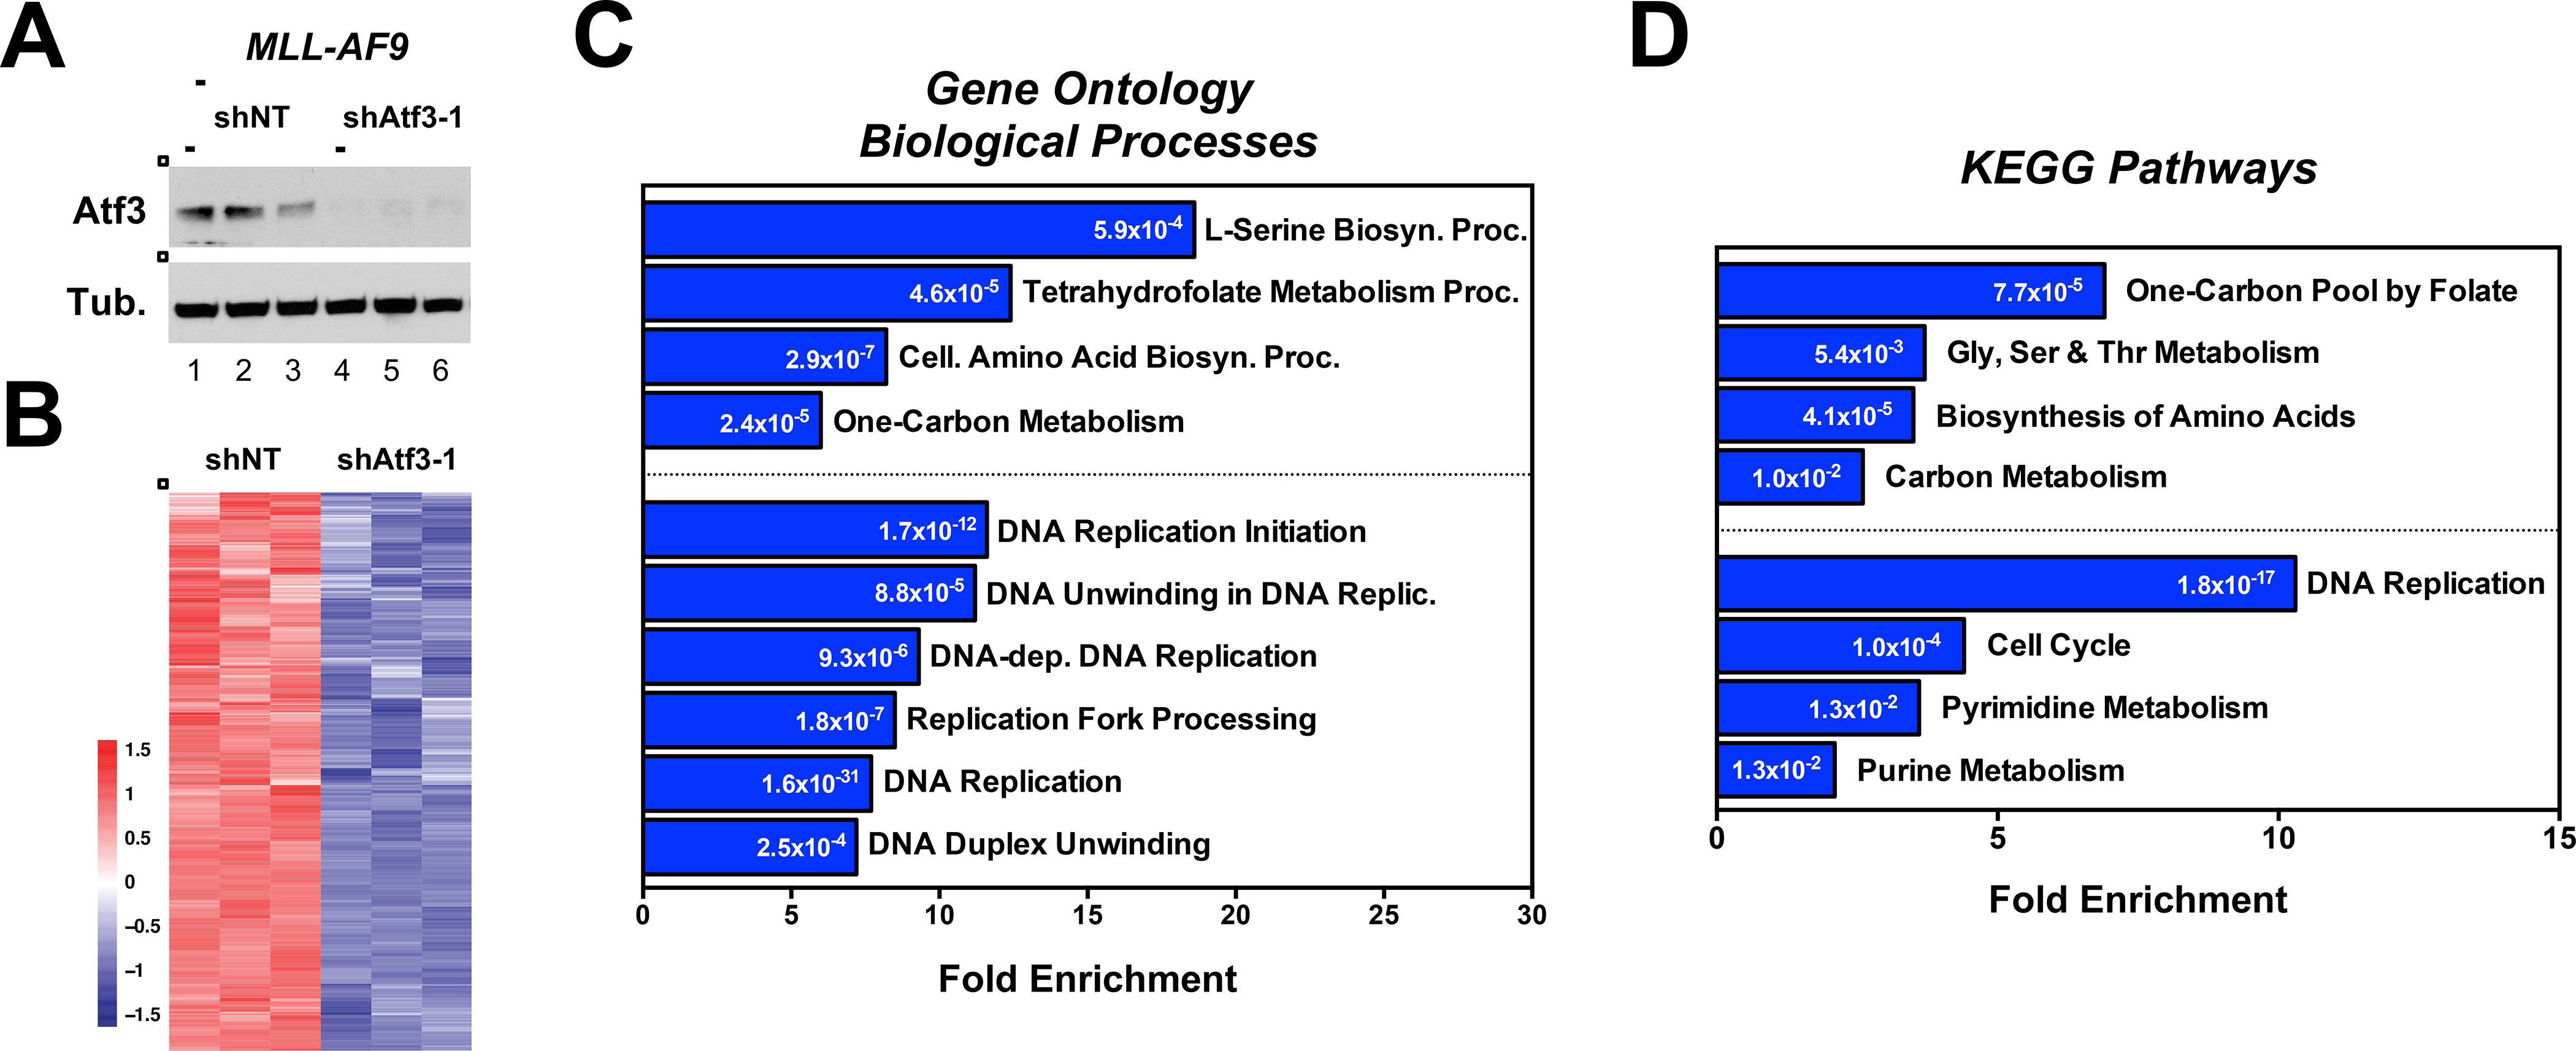
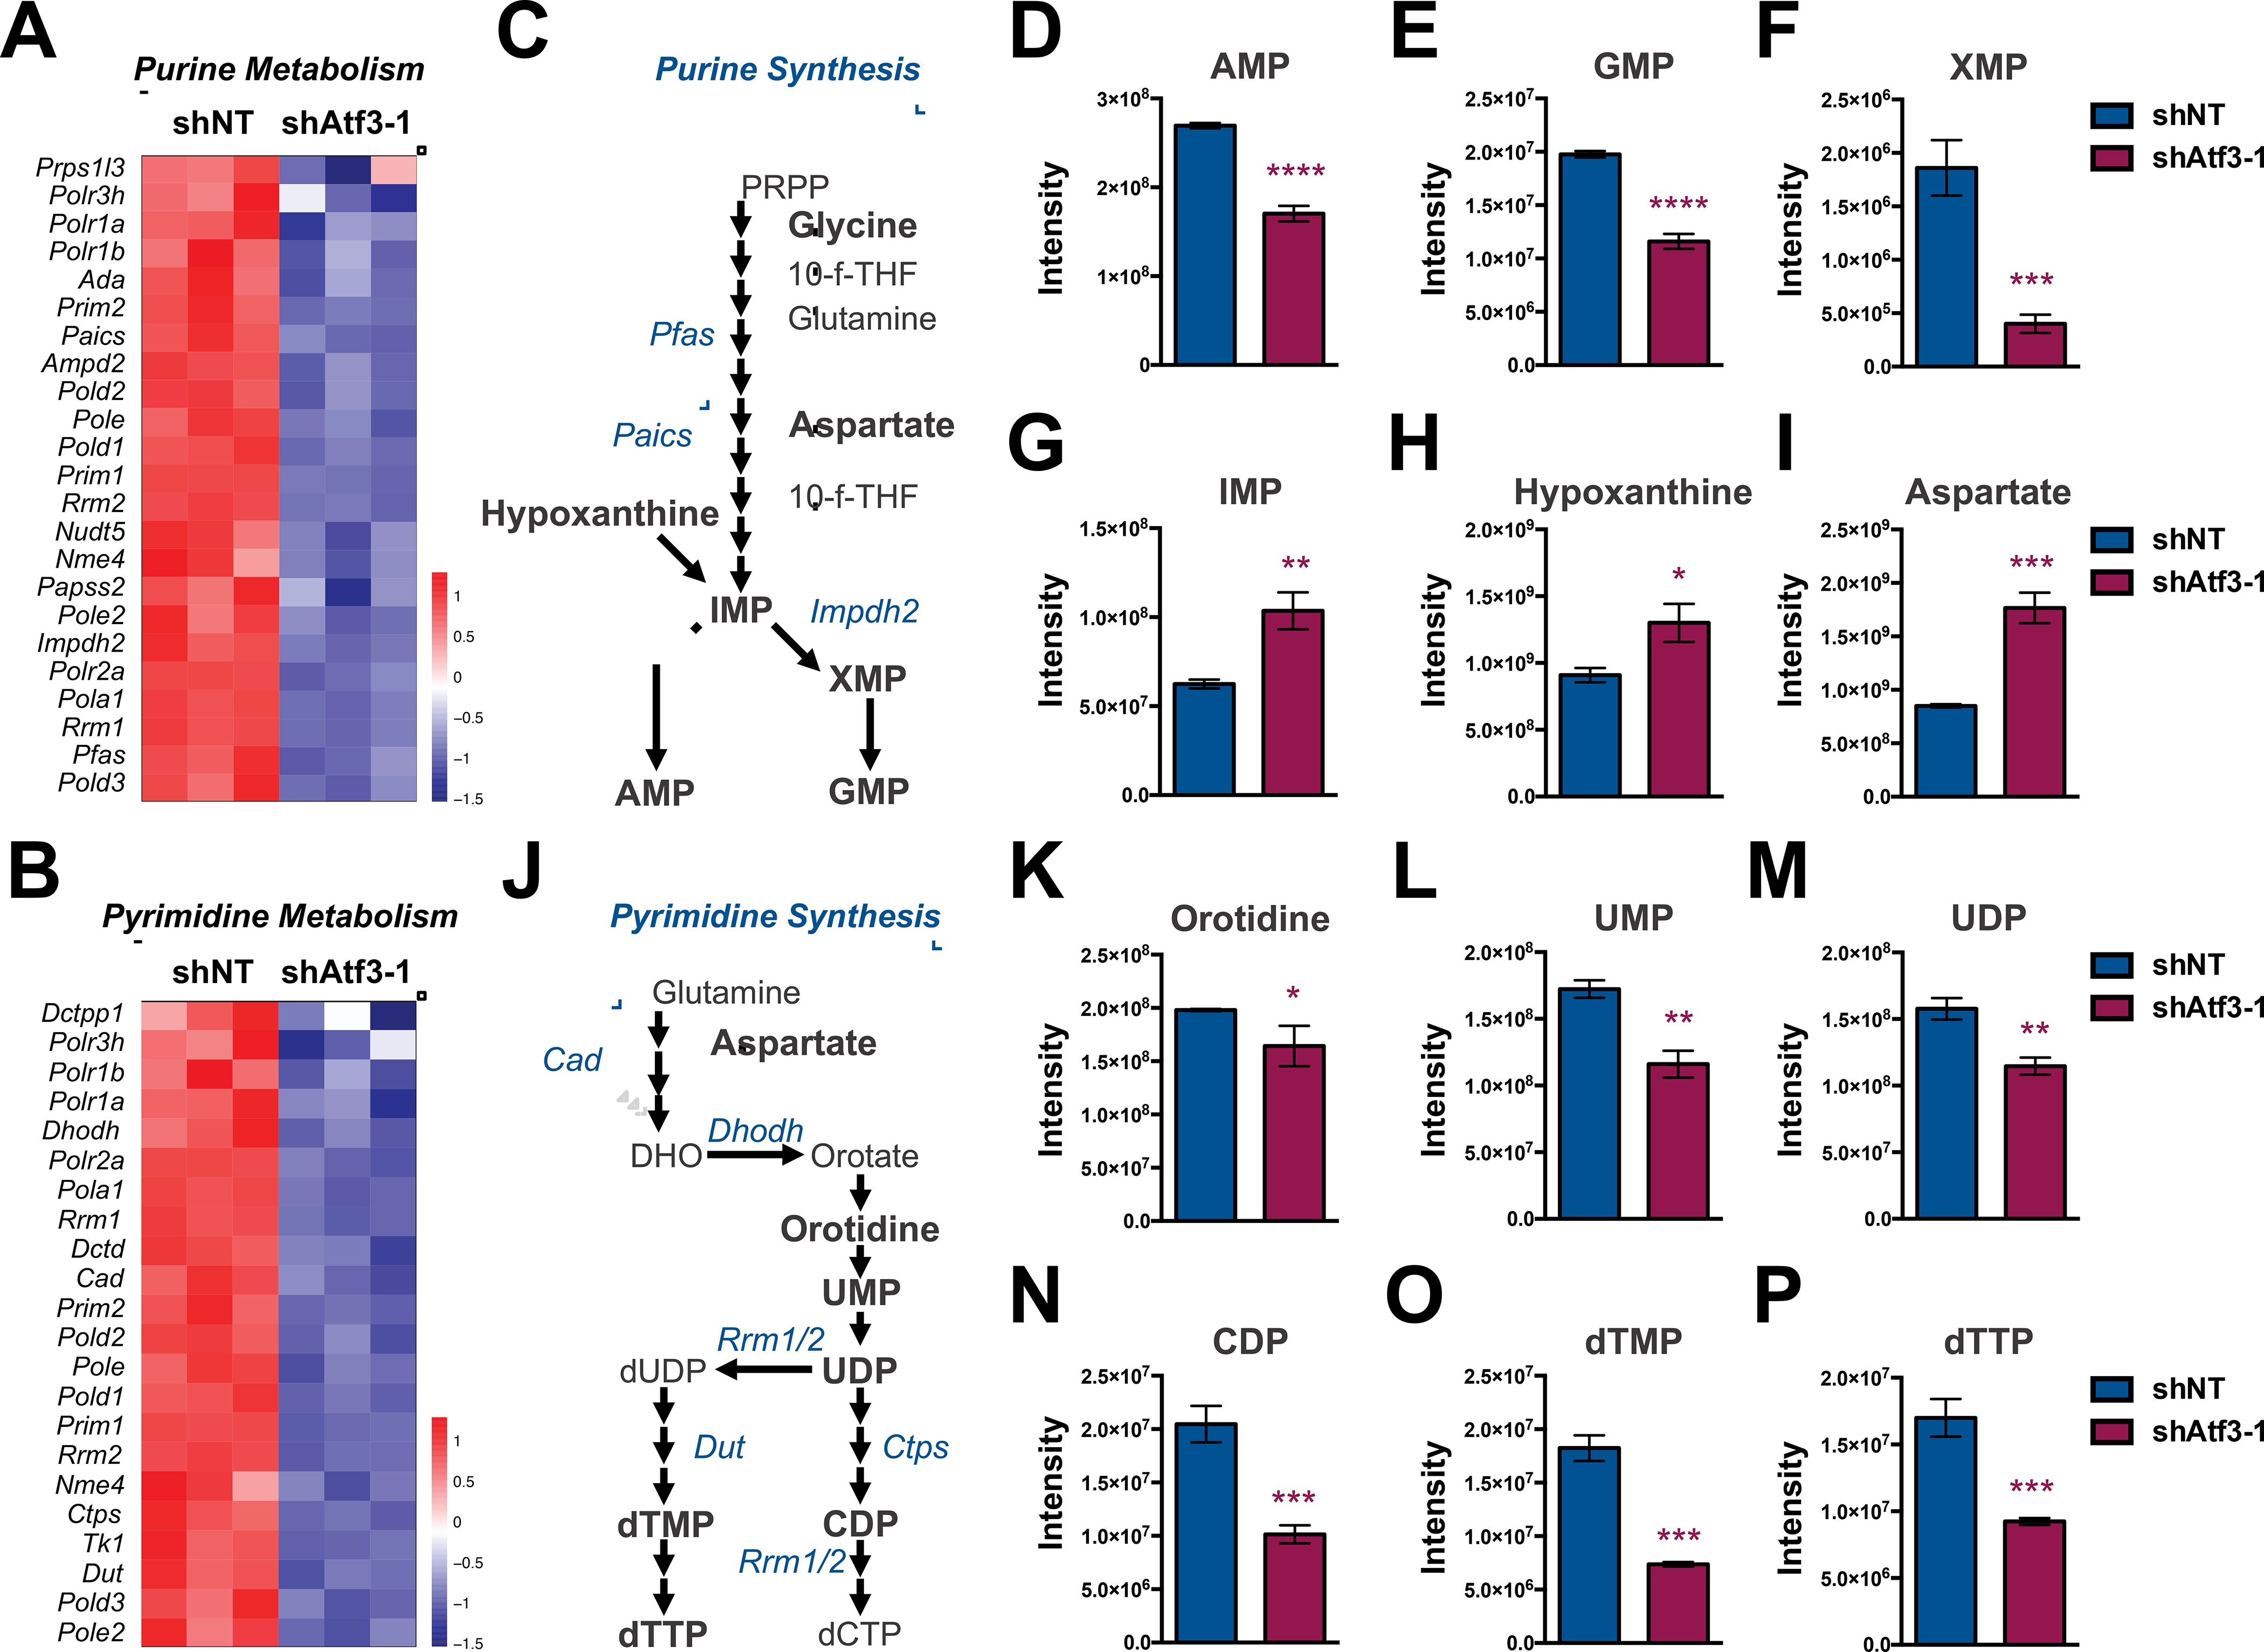
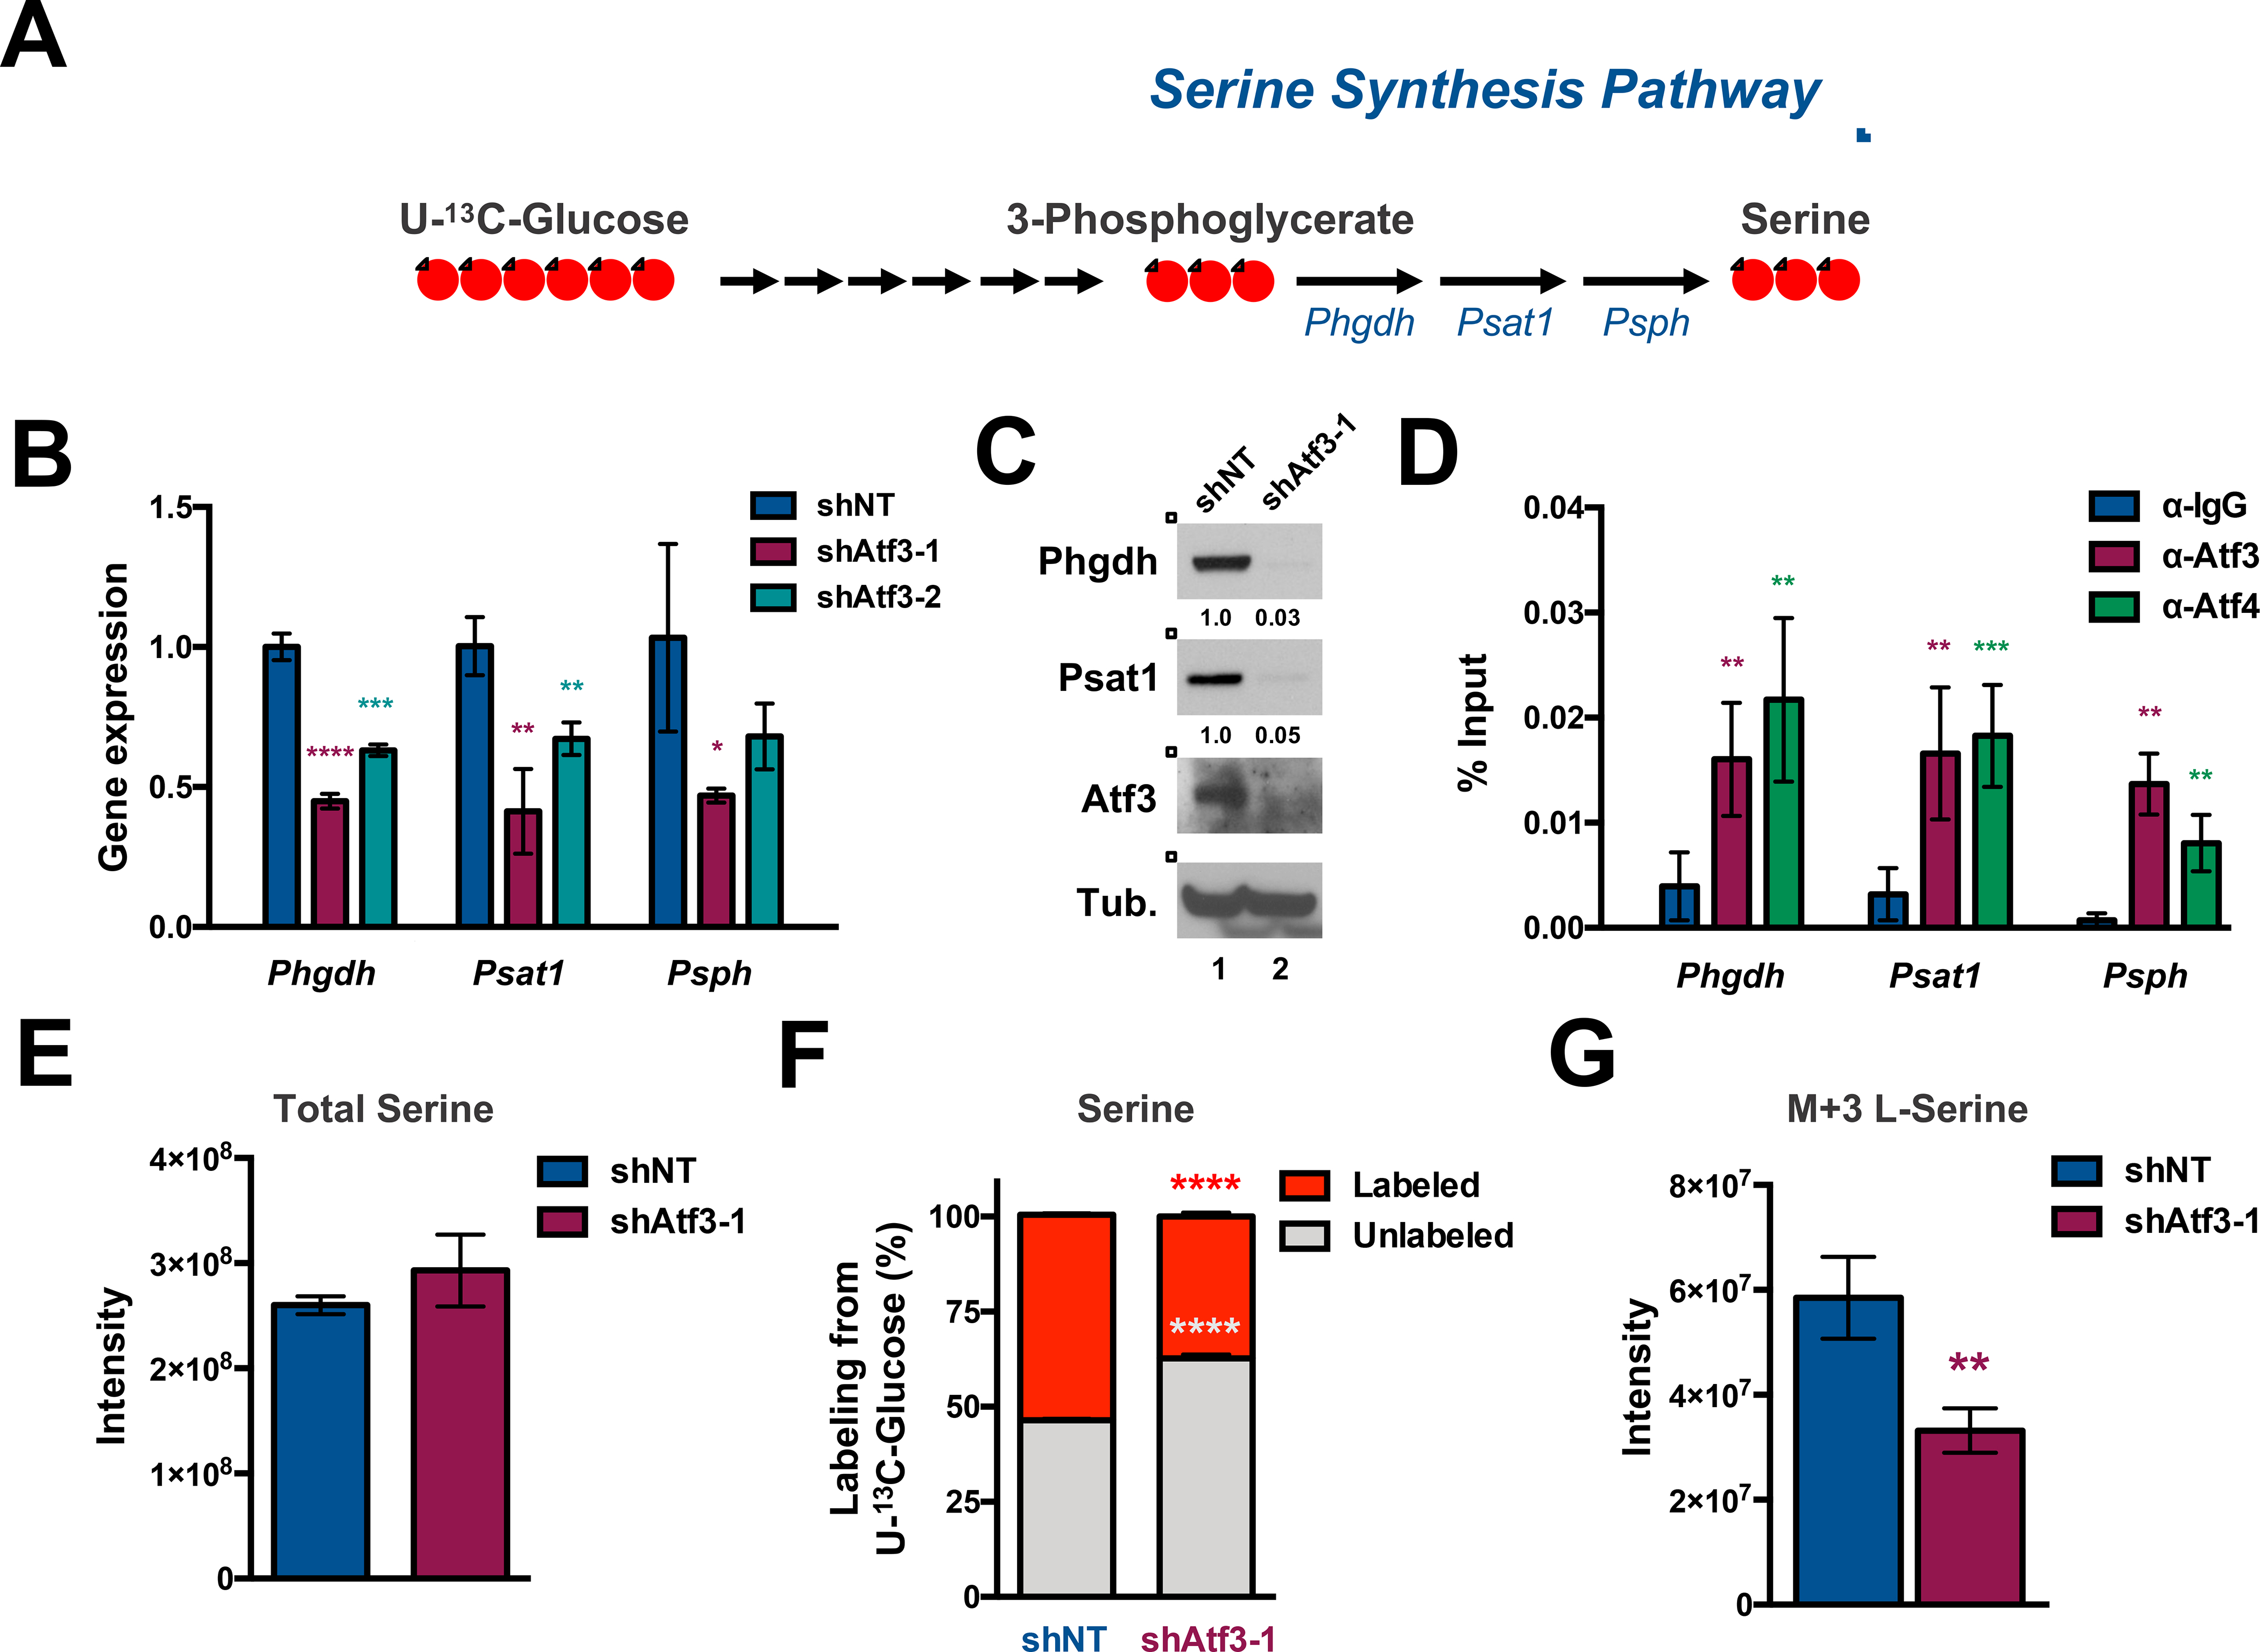
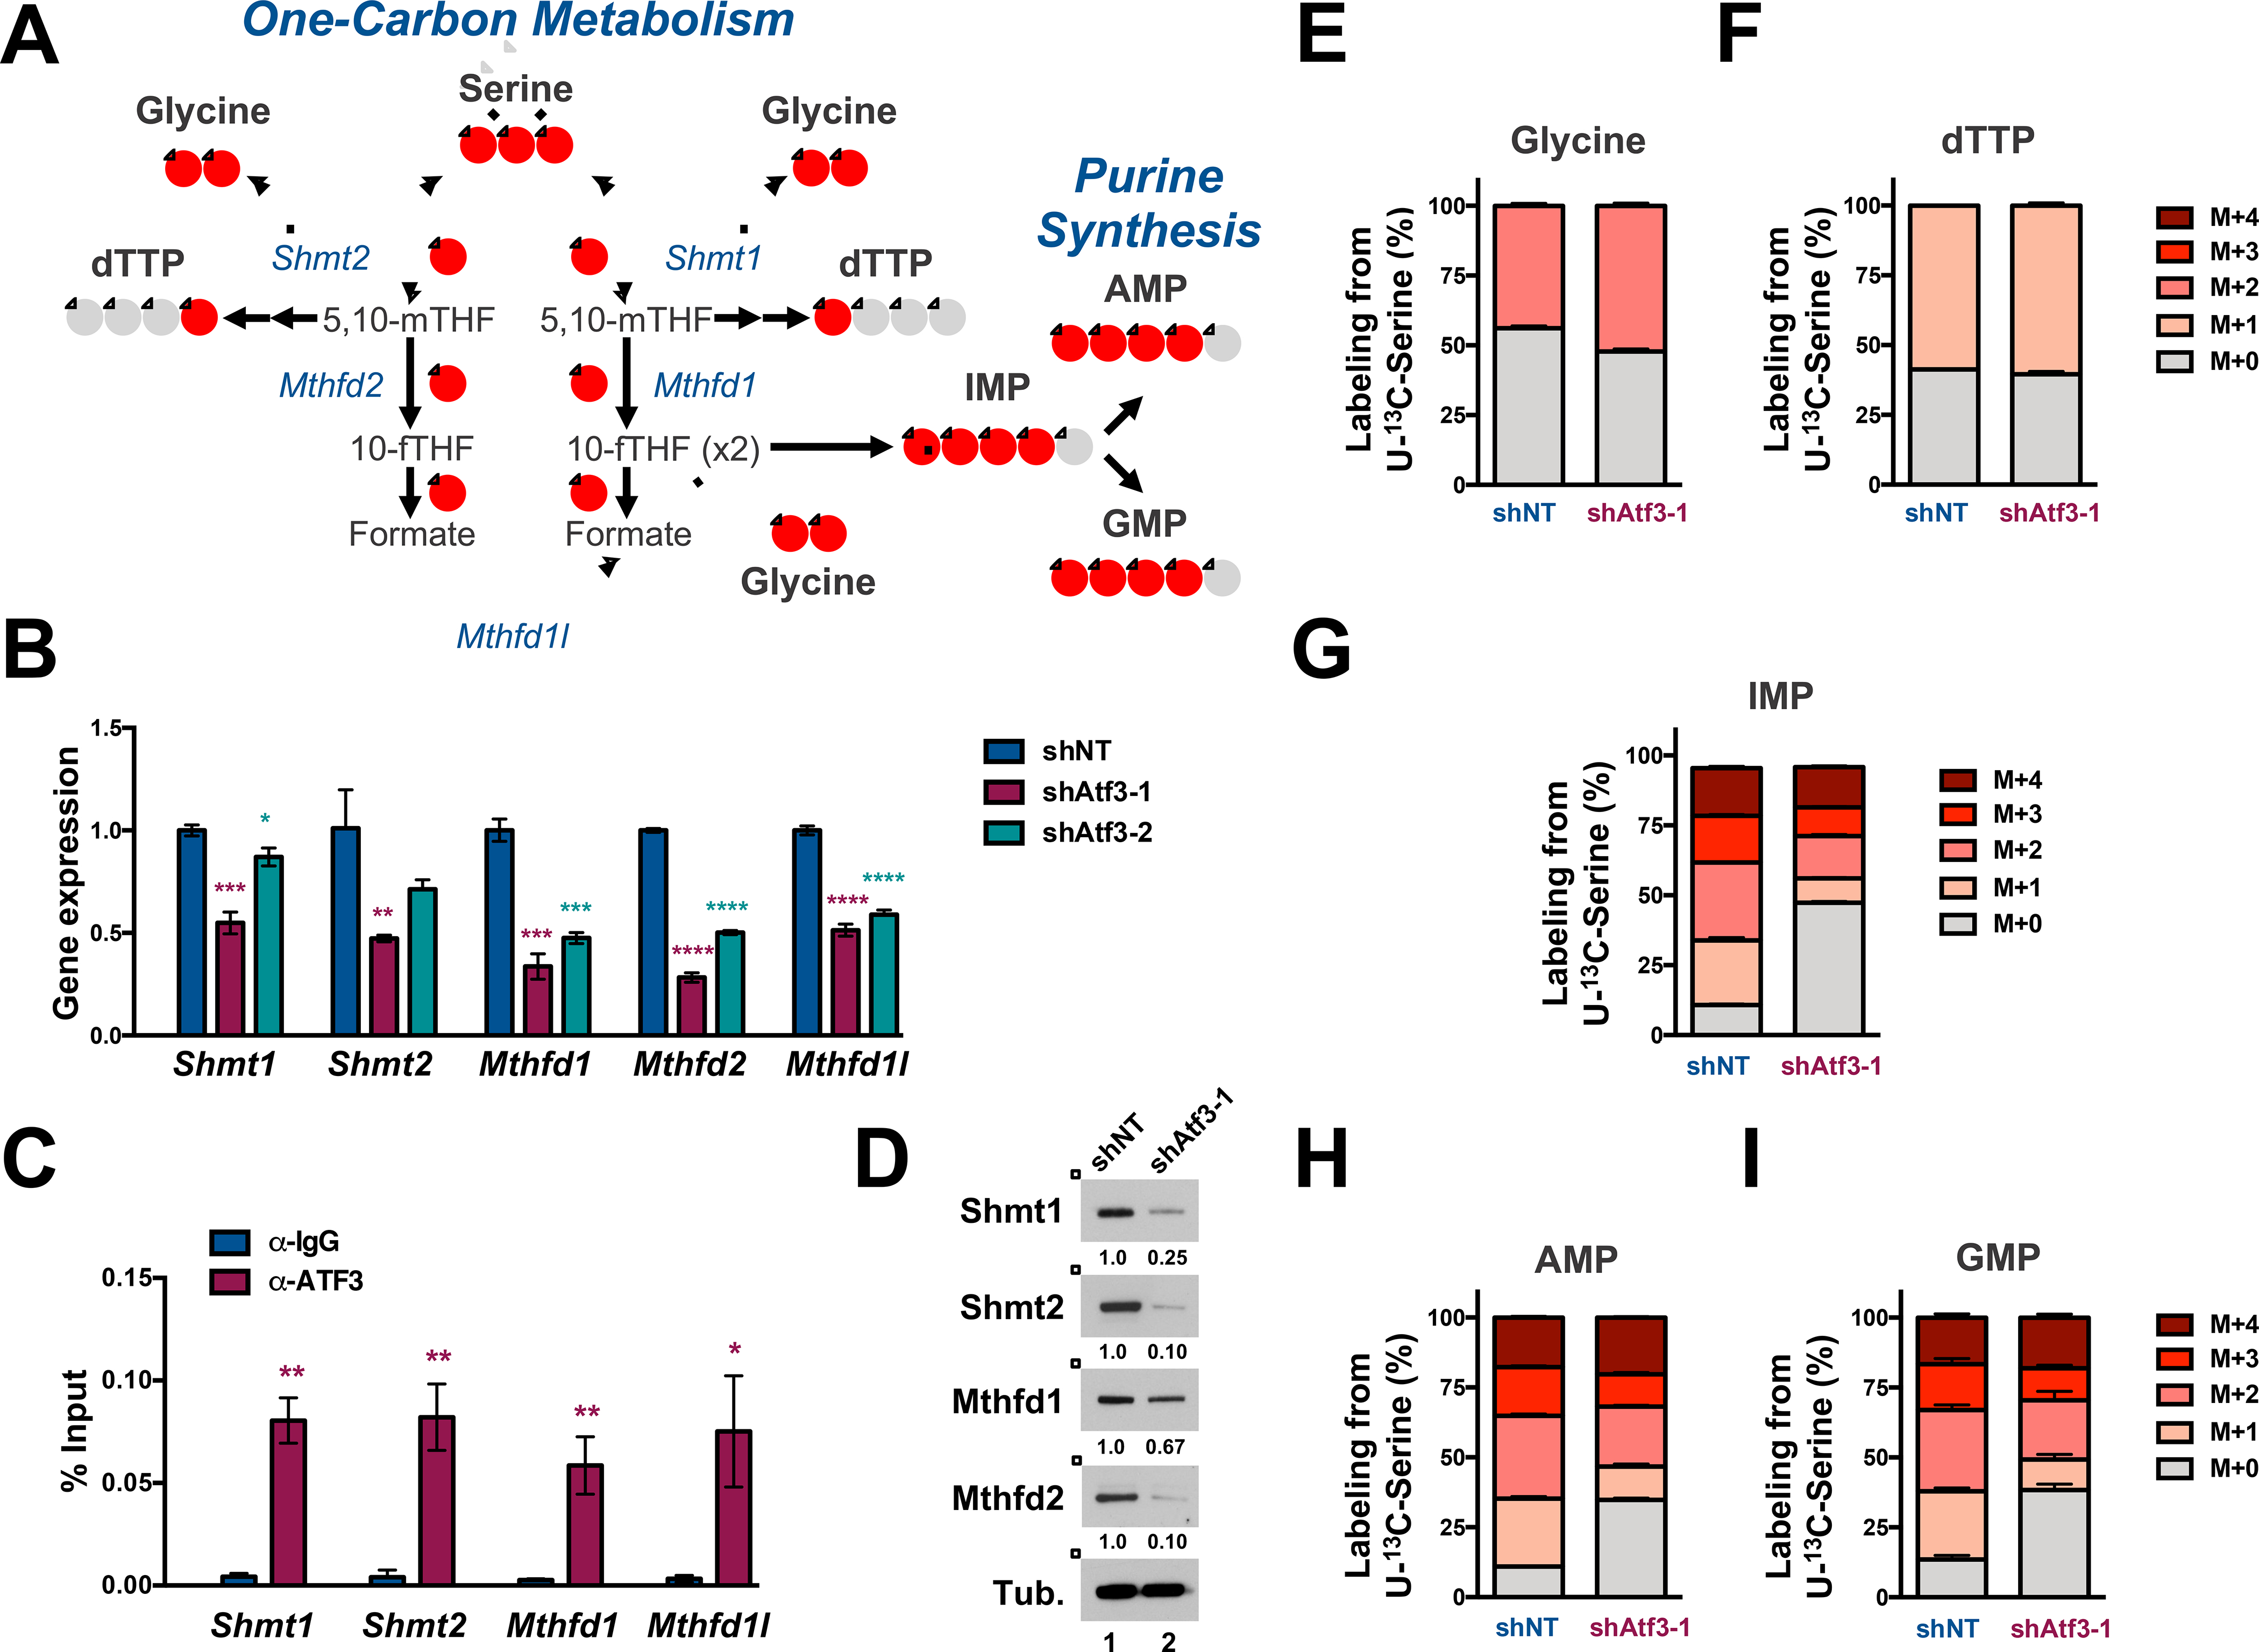
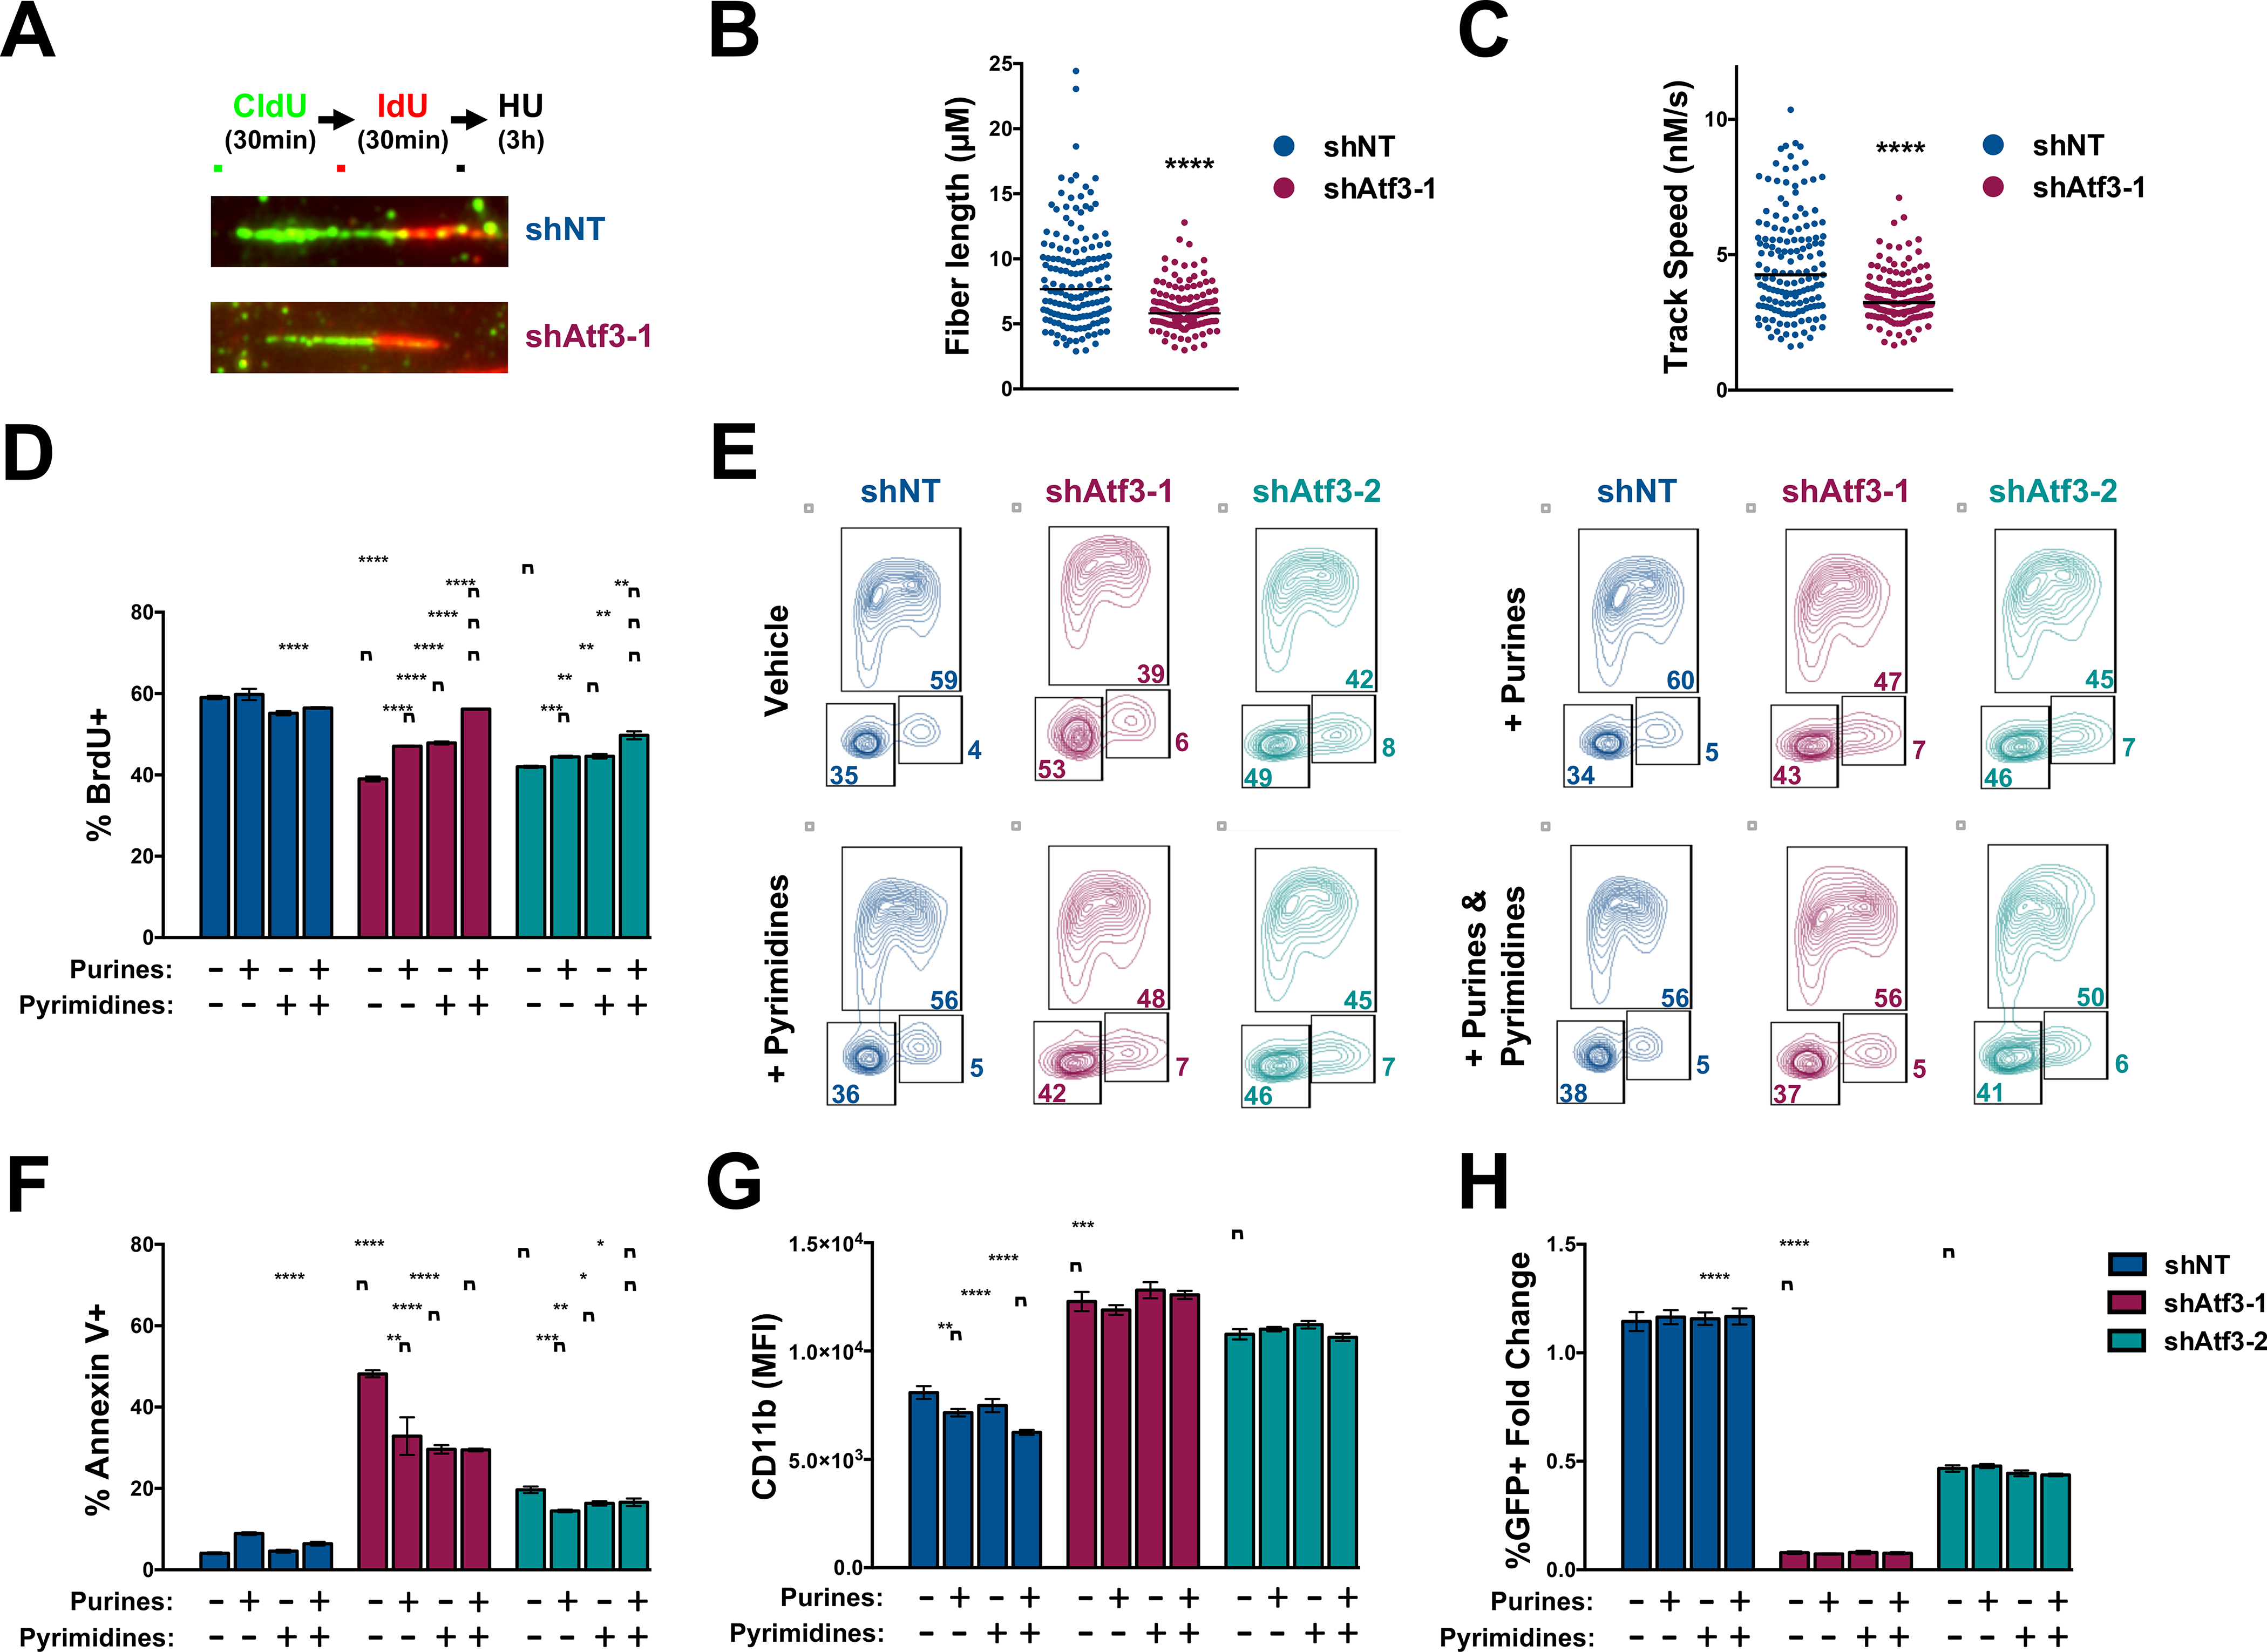
Metabolic reprogramming is a common feature of many human cancers, including acute myeloid leukemia (AML). However, the upstream regulators that promote AML metabolic reprogramming and the benefits conferred to leukemia cells by these metabolic changes remain largely unknown. We report that the transcription factor ATF3 coordinates serine and nucleotide metabolism to maintain cell cycling, survival, and the differentiation blockade in AML. Analysis of mouse and human AML models demonstrate that ATF3 directly activates the transcription of genes encoding key enzymatic regulators of serine synthesis, one-carbon metabolism, and de novo purine and pyrimidine synthesis. Total steady-state polar metabolite and heavy isotope tracing analyses show that ATF3 inhibition reduces de novo serine synthesis, impedes the incorporation of serine-derived carbons into newly synthesized purines, and disrupts pyrimidine metabolism. Importantly, exogenous nucleotide supplementation mitigates the anti-leukemia effects of ATF3 inhibition. Together, these findings reveal the dependence of AML on ATF3-regulated serine and nucleotide metabolism.

Keywords: AML; ATF3; ATF4; cell cycle; differentiation; leukemia; metabolism; purines; pyrimidines; serine.


Conflict of interest statement

Declaration of interests S.P. is currently an employee of Merck Research Laboratories and R. Gabbasov is currently an employee of Carisma Therapeutics. All other authors declare no competing interests.

Figures

Figure 1.
Figure 1.. ATF3 inhibition supports AML in vitro and in vivo.
(A)Left, western blot analysis of the nuclear fraction of THP-1 cells expressing control shRNA (shNT) or human ATF3 targeting (shATF3–1 and −2) shRNAs. Middle and right panels, in vitro growth curve of THP-1 cells co-expressing GFP and shNT or shATF3–1 (middle) or shATF3–2 (right). %GFP+ cells were evaluated every 2 days by flow cytometry and plotted as the fold change in %GFP+ compared to that at day 2 post-transduction (day 0). Data represent the mean ± SD of three technical replicates. (B) Left, western blot analysis of fluorescence-activated cell-sorting (FACS)-purified GFP+ mouse MLL-AF9 cells expressing shNT, Atf3–1 or Atf3–2 shRNAs. 200 GFP+ MLL-AF9 cells (left, middle), 500 GFP+ MLL-ENL cells (right, middle) or 1,000 GFP+ lineage low healthy HSPCs from each shRNA condition were cultured in cytokine-enriched methylcellulose for 5 days. Data represent the mean ± SD of three replicates. (C & D) Kaplan–Meier survival curve of mice transplanted with shNT- or Atf3–1-expressing: (C) mouse MLL-AF9 cells (Log-rank (mantel-cox) test; n=6) or (D) or FLT3ITD;Dnmt3a−/−; Tet2−/− cells (Log-rank (mantel-cox) test (n=5). (E) Patient samples co-expressing GFP and shNT or Atf3–1 shRNAs were co-cultured with irradiated HS-27 fibroblasts and analyzed by flow cytometry for the expression of GFP and human CD45. Cells were analyzed 27 days post-transduction and plotted as fold change in %GFP+. Data represent the mean ± SD of three wells from a single experiment. Asterisk key = *P ≤ 0.05; **P ≤ 0.01; ***P ≤ 0.001; ****P ≤ 0.0001. See also Figure S1 and T1.
Figure 2.
Figure 2.. ATF3 inhibition promotes AML cell cycle arrest, death and differentiation.
(A) Sorted GFP+ MLL-AF9 expressing shNT, shAtf3–1 or shAtf3–2 were treated with 10uM of BrdU, stained with anti-BrdU and PI and assessed by flow cytometry (left). Contour plot analysis depicts gate definition for G0-G1, S and G2-M phases of the cell cycle (right). (B) BrdU analysis of human THP-1 and OCI-AML3 cell lines as described in 2A. (C) MLL-AF9 cells expressing shNT, shAtf3–1 or shAtf3–2 were analyzed by flow cytometry for the %Annexin-V+ cells at 5 days post-transduction. (D) THP-1 (left) and OCI-AML3 (right) cells expressing shNT or shATF3–1 were analyzed by flow cytometry for the %Annexin-V+ cells at 8 days post-transduction. (E) MLL-AF9 cells expressing shNT, shAtf3–1 or shAtf3–2 were analyzed by flow cytometry for CD11b and Gr1 expression (MFI = median fluorescence intensity). (F) THP-1 cells expressing shNT or shATF3–1 were analyzed by flow cytometry for CD11b MFI and %Annexin-V+ at 6 days post-transduction. (G) Wright-Giemsa staining of MLL-AF9 expressing shNT, shAtf3–1 or shAtf3–2 shRNAs at 5 days post-transduction (40X magnification - bar = 20μm). (H) Internalization of fluorescently labeled (PE) E. coli peptides by MLL-AF9 cells expressing shNT, shAtf3–1or shAtf3–2 was assessed by flow cytometry at day 5 post-transduction. All graphed data represents the mean ± SD of three technical replicates. Asterisk key = *P ≤ 0.05; **P ≤ 0.01; ***P ≤ 0.001; ****P ≤ 0.0001. See also Figure S2.
Figure 3.
Figure 3.. ATF3 regulates transcriptional programs associated with serine and nucleotide metabolism.
(A) Western blot analysis of MLL-AF9 cells expressing shNT or shAtf3–1 used for RNA-seq analysis. (B) Heatmap of genes that are downregulated in Atf3-shRNA expressing MLL-AF9 cells compared with shNT controls. (C & D) Pathway enrichment analysis using the DAVID bioinformatic resource v6.8. The analysis was performed using: (C) GO_BP and (D) KEGG. Numbers within the bars represent p-values. See also File S1.
Figure 4.
Figure 4.. ATF3 maintains pools of purine and pyrimidine metabolites.
(A & B) Heatmaps of genes associated with (A) purine and (B) pyrimidine metabolism that are down-regulated in Atf3–1 shRNA-expressing MLL-AF9 cells compared to controls. (C) Schematic of the purine synthesis pathway. (D-I) Steady-state levels of polar metabolites extracted from shNT- or shAtf3–1-expressing MLL-AF9 at 72-hours post-transduction: (D) AMP, (E) GMP, (F) XMP, (G) IMP, (H) Hypoxanthine, (I) Aspartate. (J) Schematic of the pyrimidine synthesis pathway. (K-P) Steady-state levels of polar metabolites extracted from shNT- or shAtf3–1-expressing MLL-AF9: (K) Oritidine, (L) UMP, (M) UDP, (N) CDP, (O) dTMP and (P) dTTP. Asterisk key = *P ≤ 0.05; **P ≤ 0.01; ***P ≤ 0.001; ****P ≤ 0.0001. See also Figure S3.
Figure 5.
Figure 5.. ATF3 inhibition disrupts de novo serine synthesis.
(A) Schematic of the SSP. Red circles represent 13C atoms derived from U-13C-Glucose. (B) qPCR analysis of Phgdh, Psat1 and Psph in shNT-, shAtf3–1- and shAtf3–2-expressing MLL-AF9 cells at 2 days post-transduction. (C) Western blot analysis of FACS-sorted GFP+ MLL-AF9 cells expressing shNT or shAtf3–1 at 3 days post-transduction with the indicated antibodies. Quantified proteins levels were normalized to tubulin. (D) qPCR quantification of anti-IgG, -ATF3 or -ATF4 ChIP samples with primers amplifying regions of the Phgdh, Psat1, and Psph genes. The approximate promoter regions are: Phgdh (0 - +1000); Psat1 (−500 - +500); Psph (+9000 - +10000). Data are presented as the % of input. (E) Quantification of steady-state levels of serine from shNT- or shAtf3–1-expressing MLL-AF9 at 3 days post-transduction. (F & G) shNT or shAtf3–1–expressing MLL-AF9 at 48 hours post-transduction were cultured in media supplemented with U-13C-Glucose for 24 hours after which metabolites were extracted and analyzed by HILIC-MS. (F) Percentage of unlabeled (M+0, grey) or labeled (the sum of M+1, M+2 and M+3, red) serine levels. (G) Quantification of the steady-state levels of M+3 isotopologue fraction of serine. All graphed data represents the mean ± SD of three technical replicates. Asterisk key = *P ≤ 0.05; **P ≤ 0.01; ***P ≤ 0.001; ****P ≤ 0.0001. See also Figure S4.
Figure 6.
Figure 6.. ATF3 inhibition abrogates serine-derived purine synthesis.
(A) Schematic of one-carbon (1C) metabolism that feed into purine synthesis. Red circles represent 13C atoms derived from U-13C-Serine. (B) qPCR analysis of indicated 1C metabolism mRNAs in shNT-, shAtf3–1- and shAtf3–2-expressing MLL-AF9 cells. (C) qPCR quantification of Atf3 binding at the indicated promoters by anti-IgG and -ATF3 ChIP analysis in MLL-AF9. The approximate promoter regions are: Shmt1 (+500 – 1500); Shmt2 (0 - +1000); Mthfd1 (−500 - +500); Mthfd1l (0 - +1000). Data are presented as the % of input. (D) Western blot analysis of GFP+ MLL-AF9 cells expressing shNT or shAtf3–1 at 3 days post-transduction with the indicated antibodies. Quantified proteins levels were normalized to tubulin. (E-I) shNT or shAtf3–1-expressing MLL-AF9 at 48 hours post-transduction were cultured for 24 hours with U-13C-serine and metabolites were subsequently extracted and analyzed by HILIC-MS. Isotopologue distribution (%) of the total steady-state levels of: (E) Glycine, (F) dTTP, (G) IMP and (H) AMP and (I) GMP. All graphed data represents the mean ± SD of three technical replicates. Asterisk key = *P ≤ 0.05; **P ≤ 0.01; ***P ≤ 0.001; ****P ≤ 0.0001. See also Figure S5.
Figure 7.
Figure 7.. Nucleotide supplementation mitigates the anti-leukemia effects of ATF3 inhibition.
(A-C) DNA fiber analysis of shNT- or shAtf3–1-expressing MLL-AF9 cells at 96-hours post-transduction. DNA fibers were visualized by IF with fluorescently-labeled CldU- and IdU- antibodies. (A) Representative fibers for each condition and schematic of the experimental design. (B) Quantification of fiber length for the CldU portions. (C) Calculated track speeds for individual replications forks. (D-H) MLL-AF9 cells expressing control or Atf3-targeting shRNAs were cultured with vehicle, 12.5 μM purines (2’-deoxyadenosine and 2’-deoxyguanosine), 12.5 μM pyrimidines (2’-deoxycytosine and 2’-deoxyuridine 5’-monophosphate) or 12.5 μM purines and pyrimidines and then assessed by flow cytometry for: (D) %BrdU based on (E) anti-BrdU versus PI; (F) %Annexin V+; (G) CD11b MFI; and (H) changes in %GFP+ cells. Data represent the mean ± SD of three technical replicates. Asterisk key = *P ≤ 0.05; **P ≤ 0.01; ***P ≤ 0.001; ****P ≤ 0.0001. See also Figure S6.

References

    1. Adams CM. (2007) Role of the transcription factor ATF4 in the anabolic actions of insulin and the anti-anabolic actions of glucocorticoids. J Biol Chem. 282(23):16744–16753. doi:10.1074/jbc.M610510200 - DOI - PubMed
    1. Bagger FO, Sasivarevic D, Sohi SH, Laursen LG, Pundhir S, Sønderby CK, Winther O, Rapin N, Porse BT. (2016) BloodSpot: a database of gene expression profiles and transcriptional programs for healthy and malignant haematopoiesis. Nucleic Acids Res.January4;44(D1):D917–24. doi: 10.1093/nar/gkv1101. - DOI - PMC - PubMed
    1. Ben-Sahra I, Hoxhaj G, Ricoult SJH, Asara JM, Manning BD. (2016) mTORC1 induces purine synthesis through control of the mitochondrial tetrahydrofolate cycle. Science.351(6274):728–733. doi:10.1126/science.aad0489 - DOI - PMC - PubMed
    1. Bjelosevic S, Gruber E, Newbold A, Shembrey C, Devlin JR, Hogg SJ, Kats L, Todorovski I, Fan Z, Abrehart TC, et al. (2021) Serine biosynthesis is a metabolic vulnerability in FLT3-ITD-driven acute myeloid leukaemia. Cancer Discov. 2021 January 12:candisc.0738.2020. doi: 10.1158/2159-8290.CD-20-0738. - DOI - PubMed
    1. Brown SL, Sekhar KR, Rachakonda G, Sasi S, Freeman ML. (2008) Activating transcription factor 3 is a novel repressor of the nuclear factor erythroid-derived 2-related factor 2 (Nrf2)-regulated stress pathway. Cancer Res. 68(2):364–368. doi:10.1158/0008-5472.CAN-07-2170 - DOI - PubMed

Publication types

MeSH terms