. 2021 Jun 21;56(12):1700-1711.e8.
doi: 10.1016/j.devcel.2021.05.006. Epub 2021 Jun 2.

Robustness of epithelial sealing is an emerging property of local ERK feedback driven by cell elimination

Affiliations

Robustness of epithelial sealing is an emerging property of local ERK feedback driven by cell elimination

Léo Valon et al. Dev Cell. .

Abstract

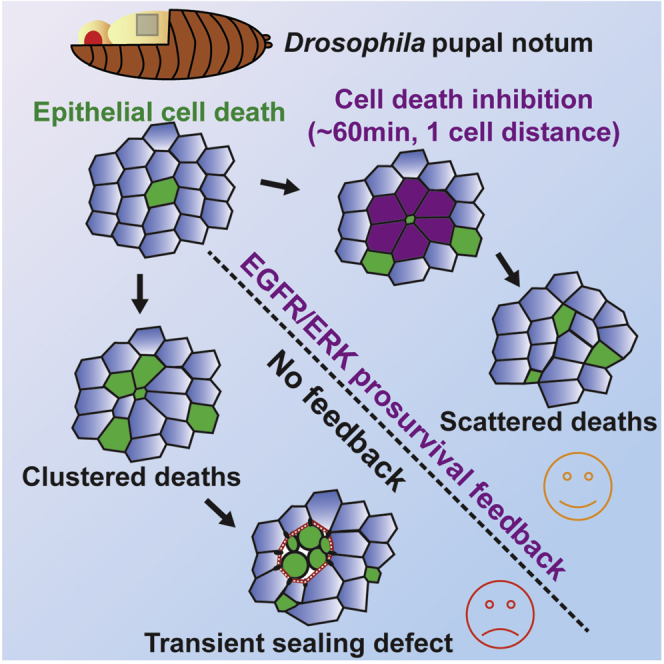
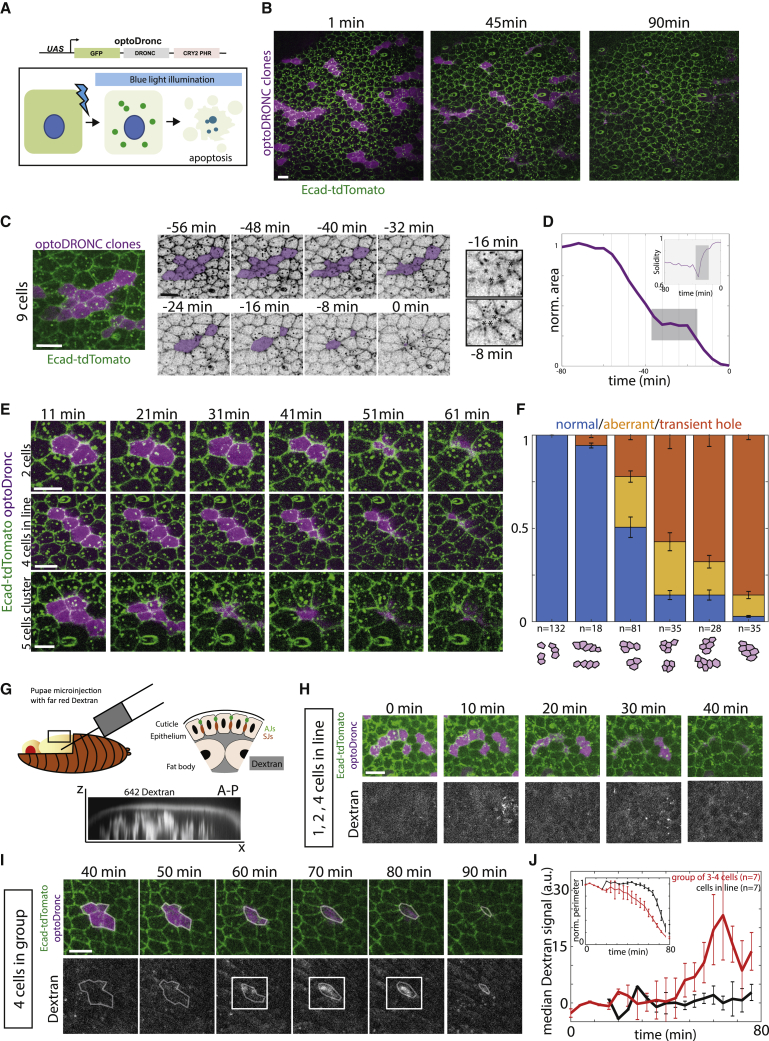
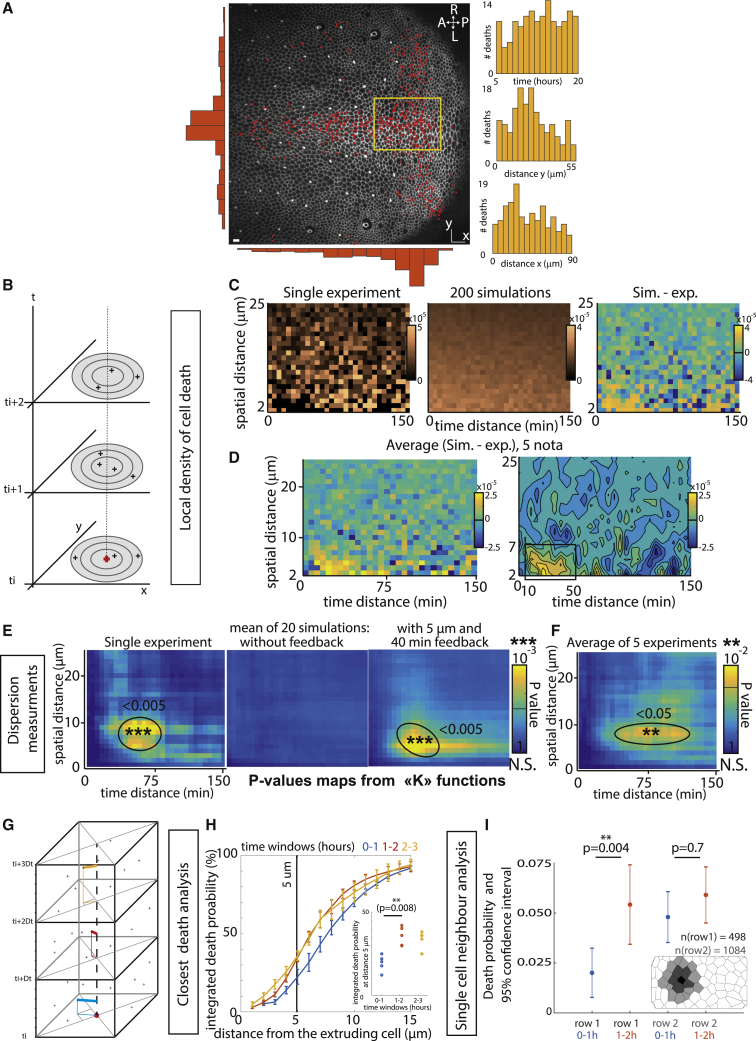
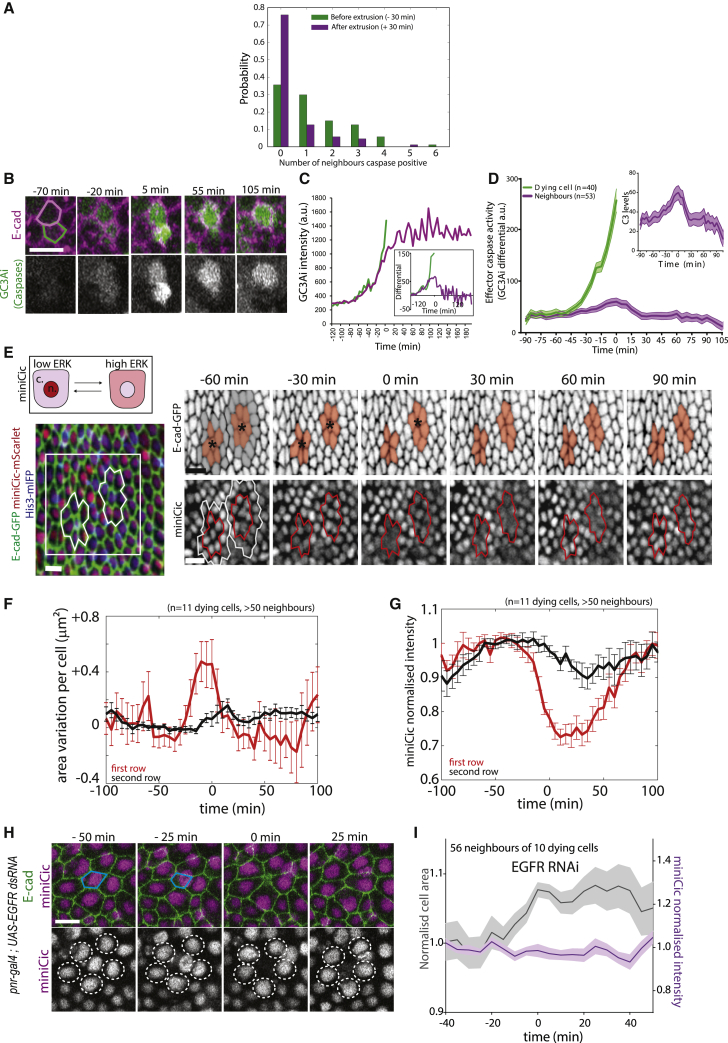
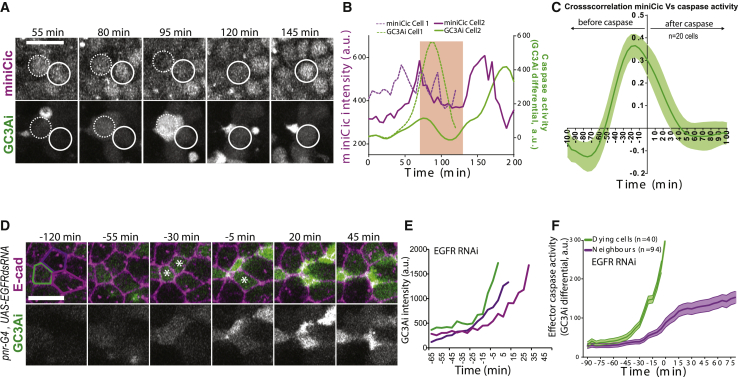
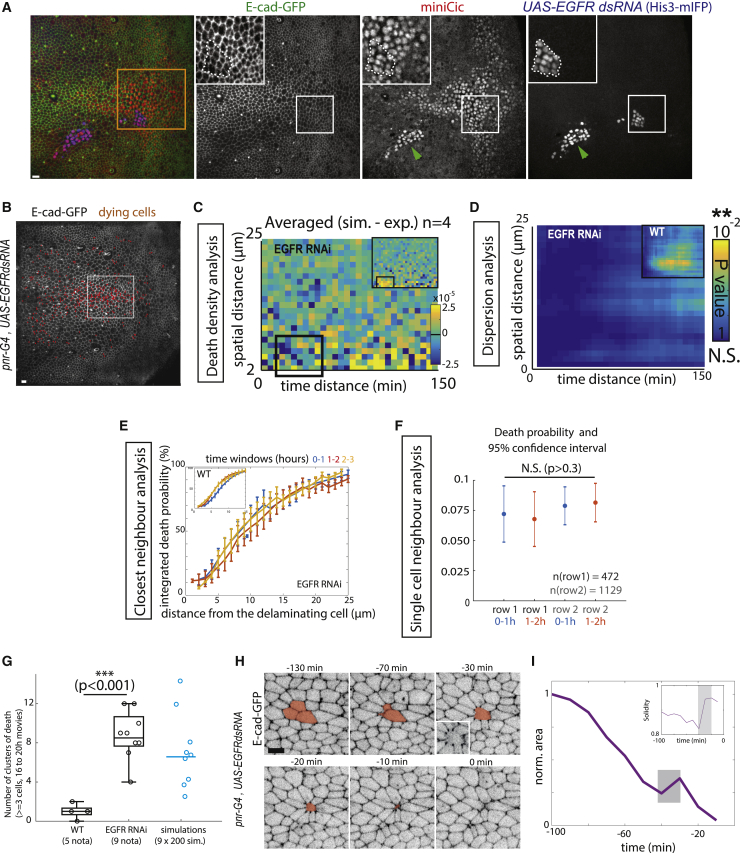
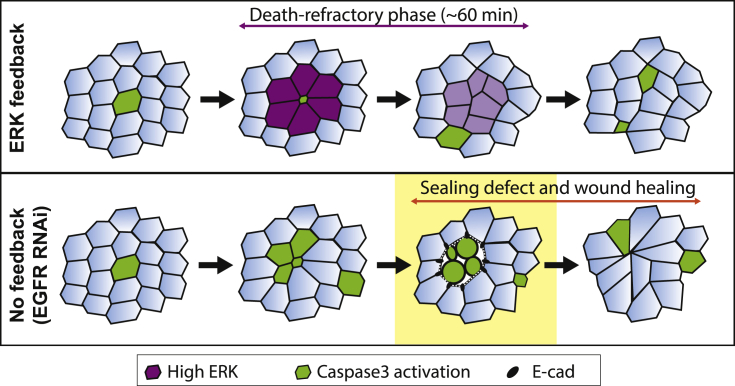
What regulates the spatiotemporal distribution of cell elimination in tissues remains largely unknown. This is particularly relevant for epithelia with high rates of cell elimination where simultaneous death of neighboring cells could impair epithelial sealing. Here, using the Drosophila pupal notum (a single-layer epithelium) and a new optogenetic tool to trigger caspase activation and cell extrusion, we first showed that death of clusters of at least three cells impaired epithelial sealing; yet, such clusters were almost never observed in vivo. Accordingly, statistical analysis and simulations of cell death distribution highlighted a transient and local protective phase occurring near every cell death. This protection is driven by a transient activation of ERK in cells neighboring extruding cells, which inhibits caspase activation and prevents elimination of cells in clusters. This suggests that the robustness of epithelia with high rates of cell elimination is an emerging property of local ERK feedback.

Keywords: Drosophila; ERK; apoptosis; caspase dynamics; cell extrusion; epithelium; optogenetics; self-organization; single-cell live imaging.


Conflict of interest statement

Declaration of interests The authors declare no competing interests.

Figures

None
Graphical abstract
Figure 1
Figure 1
Extrusion of a cluster of three cells or more is sufficient to impair epithelial sealing (A) Schematic of the UAS-optoDronc construct. The cDNA of Dronc (Drosophila caspase-9) is fused to eGFP in N-ter and the blue-light-sensitive protein, CRY2-PHR, in C-ter. Upon blue-light exposure, CRY2 clusters and forms clusters of optoDronc (green dots), which triggers caspase activation and apoptosis. (B) Snapshots of a live pupal notum expressing optoDronc in clones (magenta, local z-projection) and E-cad-tdTomato. Most of the clones disappear after 60 min of blue-light exposure. Scale bar, 10 μm. (C) Elimination of an optoDronc clone of nine cells. Snapshots of inverted E-cad-tdTomato signal. Time “0” is the termination of clone elimination. Clone contour rounds up and relaxes at −32 min and is followed by wound healing. Inset on the right shows E-cad accumulation at tricellular junctions during wound healing. Scale bar, 10 μm. (D) Evolution of the clone area shown in (C). The gray zone corresponds to the relaxation phase and is followed by wound healing. The lines correspond to the timing of the images shown in (C). Inset shows increase in clone solidity (area/convex area) during the relaxation and wound healing phases (gray zone). See Figure S1G for details. (E) Snapshots of clones of different sizes expressing optoDronc upon blue-light exposure. Note the transient relaxation at 41 min for 5-cell clusters. Time “0” is the onset of blue-light exposure. Scale bars, 10 μm. (F) Quantification of the proportion of normal and aberrant extrusions (extrusions followed by transient relaxation or E-cad accumulation at vertices, see Figure S1G) and transient holes (large relaxation and E-cad accumulation at vertices, see Figure S1G) observed for clones of different sizes and topologies (see schematic below). n, number of clones, obtained from 21 pupae. Error bars indicate 95% confidence interval. (G) Injection of far-red dextran 10,000 MW into pupal notum. Bottom shows a transverse view of the dextran signal in the pupae (x, antero-posterior; z, apical-basal). Schematic showing the localization of dextran according to the epithelium (AJs, adherens junctions; SJs, septate junctions). Note that septate junctions are located basally to adherens junctions. (H) Local projections of optoDronc clones composed of one to several cells in lines after dextran injection (bottom). No dextran appears at the level of adherens junctions during clone elimination. Scale bar, 10 μm. (I) Local projections of an optoDronc clone composed of four cells in a cluster after dextran injection (bottom). During the relaxation phase (60–80 min) dextran appears at the level of adherens junctions (white squares). See Figures S2D–S2F for details. Scale bar, 10 μm. (J) Quantification of the far-red dextran signal during optoDronc clone elimination (in rows, black; in clusters of 3–4 cells, red). The curves are the median ± SEM and were aligned on the termination of clone elimination. Top inset shows the average clone area during their elimination (note that the elimination is overall slower for clusters, red curve). See also Figures S1, S2, and Video S1.
Figure 2
Figure 2
There is a transient and local refractory phase for cell elimination following each cell death (A) Snapshot of a local projection of a pupal notum expressing E-cad-GFP. Red dots show every cell extrusion occurring over 21 h. A, anterior; P, posterior; L, left; R, right. Scale bar, 10 μm. Orange histograms show the spatial distribution of cell death over left-right axis (left) or along AP axis (bottom). The histograms on the right show the temporal distribution of cell death (top) and its spatial distribution (middle and bottom) in the region indicated by a yellow rectangle (used for further analysis). (B) Scheme explaining the measurement of spatial and temporal distance between death events. For each death event, the density of cell death in a disk (number of death events divided by disk surface) at a given spatial distance is calculated for each time point. (C) Local cell death density at different spatial (y axis) and temporal distances (x axis) from a dying cell for one movie. The middle map shows the average map obtained for 200 simulations of a Poisson process with the same cell death intensity distributed over the same area and for the same duration. Note that the apparent global proximo-distal gradient is driven by boundary effects (see STAR methods). The map on the right shows the difference between the simulated and the experimental distributions (the “yellow island” shows that death at short distances are under-represented in the experiment compared to the simulations). (D) Average of the difference between experimental maps and the corresponding simulated maps (simulation minus experimental distributions, see Figure S3 for details, 5 movies). The map on the right is obtained after median filtering. Note the bottom left yellow domain with a lower expected number of cell deaths compared to simulations (black square, 7 μm ~one cell diameter, and from ~10 to 60 min). (E) Analysis of dispersion in the death distribution using maps of dispersion p value calculated with K-functions (see STAR methods). y axis: spatial distance between death events, x axis: time delay between death events. Pseudo-color is the p value (yellow, significant dispersion; blue, no significant dispersion). The map on the left corresponds to the experimental distribution used in (C), the middle map is the mean of the maps from 20 simulations of a Poisson process with the same death intensity; the map on the right is the mean of the maps of 20 simulations of a random process including a cell death refractory phase following each cell death starting with a delay of 10 min and lasting 40 min at a distance of 5 μm (see STAR methods). (F) Averaged p value map for 5 WT movies (see Figures S3B and S3G for details). (G) Analysis of cell death distribution through a closest-neighbor approach. Time is subdivided in arbitrary windows (here, 1 h, starting from t = 20 min) and for each time window the spatially closest cell death is found. (H) Cumulative plots of the probability to find the closest death at a given distance for different time windows (20 min to 1 h 20 min, 1 h 20 min to 2 h 20 min, 2 h 20 min to 3 h 20 min). The curves are averages of 5 movies; error bars are SEM. Note that only the blue curve detaches from the others, representing what happens 20 to 80 min after cell death. (H inset) Details of the values obtained at a distance of 5 μm (~1 cell distance) for each time window (one dot = one movie). There is a 2-fold reduction in the probability to have cell death occurring during the first hour after cell elimination for distances from 0 to 5 μm from the dying cell. (I) Plots of the single-cell probability of death for the first row and the second row of neighboring cells around a death event, for the time period 0 h 20 min to 1 h 20 min and 1 h 20 min to 2 h 20 min after death obtained by cell segmentation and tracking. Error bars are 95% confidence intervals. (I inset) is a schematic of the distribution of cells around a dying cell 20 min before it dies. Black cell is a dying cell, dark gray and light gray cells are first row and second row cells, respectively. Statistical tests performed in (H and I) are Wilcoxon-Mann-Whitney test. See also Figure S3 and Video S2.
Figure 3
Figure 3
Transient ERK activation in cells neighboring an extruding cell (A) Distribution of the number of cells positive for caspase activity (see STAR methods) and neighboring an extruding cell prior (green, −30 min) or after extrusion (purple, +30 min). n = 87 extrusions and 359 neighboring cells. Note the strong increase at “0” equals an absence of caspase activity in the neighboring cells. (B) Snapshots of local projections of a pair of cells in the pupal notum tagged with E-cad-tdTomato and expressing the effector caspase sensor, GC3Ai (green). Time “0” is the termination of extrusion of the bottom cell (green contour). Scale bar, 10 μm. (C) Intensity of GC3Ai in the eliminated cell (green) and its neighboring cells (purple). Note that GC3Ai signal plateaus in the neighboring cell after the green cell is eliminated. The inset shows the corresponding differential signal (used as an indicator of caspase activity, see STAR methods) (D) Averaged GC3Ai differential for dying cells (green, 40 cells) and its neighboring cells (purple, 53 cells). Neighboring cells undergo transient caspase activation followed by a reduction in caspase activity. Time “0” is the termination of the first cell extrusion. Light-colored areas show SEM. The inset shows the purple curve at a closest scale. (E) Top: schematic showing the localization of miniCic (n, nucleus; c, cytoplasm) upon modulation of ERK activity. Bottom: snapshot of the posterior region of the pupal notum with two dying cells (red, miniCic-mScarlet; green, E-cad-GFP; blue, His3-mIFP). Right: snapshots of two dying cells (black stars) showing E-cad signal (inverted grayscale, top) and miniCic (bottom). Orange zones (red line for miniCic) are the first row of neighboring cells; gray zones (white line for miniCic) mark the second row. Scale bars, 10 μm. (F) Averaged cell apical area variation in the first row (red) and second row (black) of cells neighboring an extruding cell. Time “0” is the termination of extrusion. Error bars are SEM. (G) Averaged nuclear miniCic normalized intensity in the first row (red) and second row of cells (black). Error bars are SEM. (H) Snapshots of a pnr-gal4; UAS-EGFRdsRNA pupae (local projections) expressing E-cad-GFP and miniCic-mScarlet. The blue line shows a dying cell. The white doted circles show miniCic signal in the nuclei of the neighboring cells. Scale bar, 10 μm. (I) Averaged nuclear miniCic normalized intensity (purple) and normalized cell apical area (black) in EGFR-depleted nota in the cells neighboring an extruding cell (Time “0” is the termination of extrusion). Light-colored areas are SEM. See also Figures S4, S5, Videos S3, and S4.
Figure 4
Figure 4
ERK pulses are required for caspase inhibition (A) Snapshots of local projections of a pupal notum expressing miniCic and GC3Ai. Blue dotted circles show the first dying cell, blue circles show a neighboring cell dying more than 1 h 30 min later. Time is in agreement with the curves shown in (B). (B) Nuclear miniCic signal (magenta) and GC3Ai differential (green, caspase activity) in the first dying cell (dotted lines) and its neighbors (plain lines) shown in (A). The red region highlights the pulse of ERK (decrease of miniCic) in the neighboring cells and the subsequent transient reduction of caspase activity (decrease of GC3Ai differential). (C) Averaged normalized cross-correlation between miniCic nuclear signal and caspase activity (GC3Ai differential). Peak at −15 min indicates a 15 min delay between ERK activation and caspase inhibition. (D) Snapshots of a local projection of a pnr-gal4, UAS-EGFRdsRNA pupal notum expressing E-cad-tdTomato and GC3Ai. The white stars show three neighboring cells dying. Green, light-, and dark-purple cell contours correspond to the curves shown in (E). Scale bar, 10 μm. (E) GC3Ai intensity in the three cells marked in (D). Time “0” is the termination of extrusion of the first dying cell (green contour). Note that there is no reduction in the rate of GC3Ai signal accumulation in the neighboring cells. (F) Averaged GC3Ai differential signal (caspase activity) in the dying cell (green) and its neighboring cells (purple) upon depletion of EGFR in the notum. Light-colored areas are SEM. Time “0” is the termination of extrusion of the first dying cell. On average, caspase activity is maintained in the neighboring cells (differential >0, compare with Figures 3C and 3D).
Figure 5
Figure 5
ERK pulses are required to disperse cell death and prevent clusters of elimination (A) Local projection of pupal notum expressing E-cad-GFP (green), miniCic-mScarlett (red), and His3-mIFP in clones (UAS-EGFR dsRNA). Orange square shows the region of interest used for most of the analysis of death distribution. While EGFR depletion significantly reduces ERK activity in regions of high activation (green arrowhead), it does not affect the basal levels of ERK activity in the posterior region (white square and insets, white doted-lines show clone contour, compare miniCic signal with neighboring cells). Representative of 8 nota. Scale bar, 10 μm. (B) Local projection of an E-cad-GFP pupae depleted of EGFR (pnr-gal4, UAS-EGFR dsRNA). Red dots show all the dying cells over the course of the movie (21 h). Scale bar, 10 μm. The white rectangle shows the analysis region (similar to the region used for the WT conditions). (C) Averaged differences between the experimental distributions of cell death density in four EGFR-depleted pupae and the corresponding simulated distributions (assuming independent events and the same death intensity). The inset shows the same analysis for WT pupae (from Figure 2D). Note the absence of yellow in the bottom-left corner compared to the WT (no reduction of cell death density in EGFR-depleted pupae for 10–60 min, <7 μm, see Figure S3F). (D) Averaged map of dispersion p value from the K-functions for 4 pnr-gal4 EGFR RNAi movies (pseudo-color: p value, blue, no significant dispersion). The top-right inset shows the averaged map of dispersion p value for control movies (see Figures 2F and S3G). (E) Closest-neighbor analysis of cell death distribution in EGFR-depleted pupae. Integrated death probability for different time windows after cell elimination (0 h 20 min to 1 h 20 min, 1 h 20 min to 2 h 20 min, 2 h 20 min to 3 h 20 min) at different distances from the dying cells. While the first hour distribution was different in the WT (see top-left inset, blue curve, from Figure 2H), there are no more differences between curves upon EGFR depletion. (F) Plots of the single-cell probability of death upon EGFR depletion for the first row and the second row of neighboring cells around a death event, for time period 0 h 20 min to 1 h 20 min and 1 h 20 min to 2 h 20 min after death (see Figure 2I for WT comparison). Values are mean values; error bars are 95% confidence intervals. Statistical Wilcoxon-Mann-Whitney tests indicate no statistical difference between populations (p > 0.3). (G) Number of occurrences of clustered elimination (≥ 3 neighboring cells dying in less than 30 min) per movie (16 to 20 h) in the WT pupae (5 nota) and upon depletion of EGFR (pnr-gal4, UAS-EGFR dsRNA, 9 nota). Blue, plot of expected number of clusters obtained by simulations of Poisson process with simulation parameters obtained from WT and EGFR experiments (see STAR methods for details). Horizontal line is the mean value. One dot: 200 simulations with a given parameter. (H) Snapshots of E-cad-GFP local projection in a EGFR-depleted pupae showing concomitant elimination of three cells (orange area) and an aberrant extrusion (relaxation at −30 and wound healing figure with E-cad accumulation at vertices, bottom-left inset, compare with Figures 1C and 1D). Time “0” is the termination of cell elimination. (I) Evolution of the clone area shown in (H). The gray zone corresponds to the relaxation phase and is followed by wound healing. Inset shows increase of clone solidity (area/convex area) during the relaxation and wound healing phases. See also Figures S2 and S6 and Video S5.
Figure 6
Figure 6
Schematic of the impact of ERK pulses on cell death distribution Schematic of the local ERK feedback (magenta) and its impact on the distribution of cell eliminations (green cells, caspase activation). Upon EGFR depletion, simultaneous caspase activations and cell eliminations can occur, which lead to aberrant extrusions and transient loss of sealing (phase outlined in yellow, white area between green aggregates) followed by wound healing.

References

    1. Aigouy B., Farhadifar R., Staple D.B., Sagner A., Röper J.C., Jülicher F., Eaton S. Cell flow reorients the axis of planar polarity in the wing epithelium of Drosophila. Cell. 2010;142:773–786. - PubMed
    1. Aigouy B., Cortes C., Liu S., Prud’Homme B. EPySeg: a coding-free solution for automated segmentation of epithelia using deep learning. Development. 2020;147:dev194589. - PMC - PubMed
    1. Aikin T.J., Peterson A.F., Pokrass M.J., Clark H.R., Regot S. MAPK activity dynamics regulate non-cell autonomous effects of oncogene expression. eLife. 2020;9 - PMC - PubMed
    1. Aoki K., Kondo Y., Naoki H., Hiratsuka T., Itoh R.E., Matsuda M. Propagating wave of ERK activation orients collective cell migration. Dev. Cell. 2017;43:305–317.e5. - PubMed
    1. Aoki K., Kumagai Y., Sakurai A., Komatsu N., Fujita Y., Shionyu C., Matsuda M. Stochastic ERK activation induced by noise and cell-to-cell propagation regulates cell density-dependent proliferation. Mol. Cell. 2013;52:529–540. - PubMed

Publication types

MeSH terms

LinkOut - more resources