. 2021 Aug 3;33(8):1577-1591.e7.
doi: 10.1016/j.cmet.2021.05.015. Epub 2021 May 19.

SARS-CoV-2 infection induces beta cell transdifferentiation

Affiliations

SARS-CoV-2 infection induces beta cell transdifferentiation

Xuming Tang et al. Cell Metab. .

Abstract

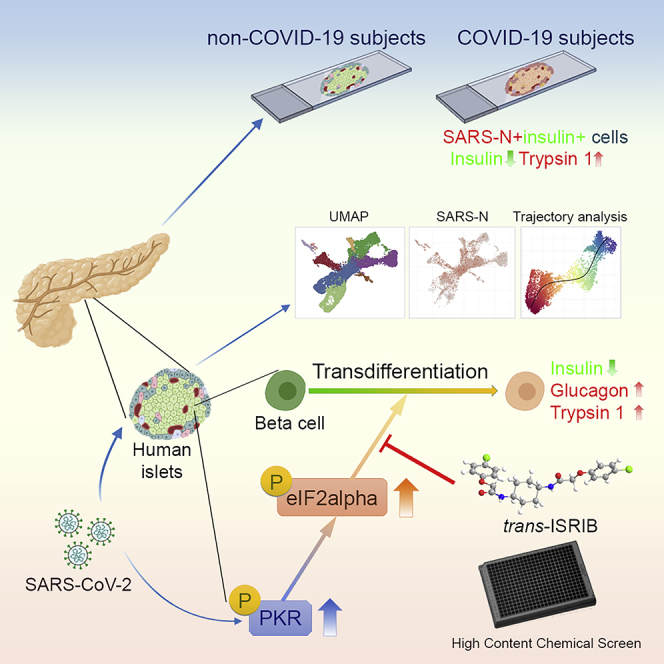
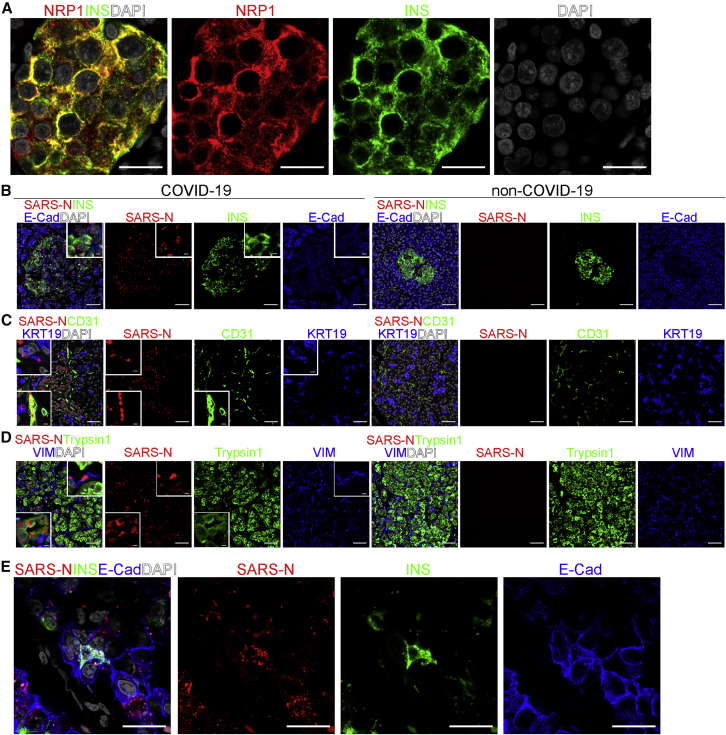
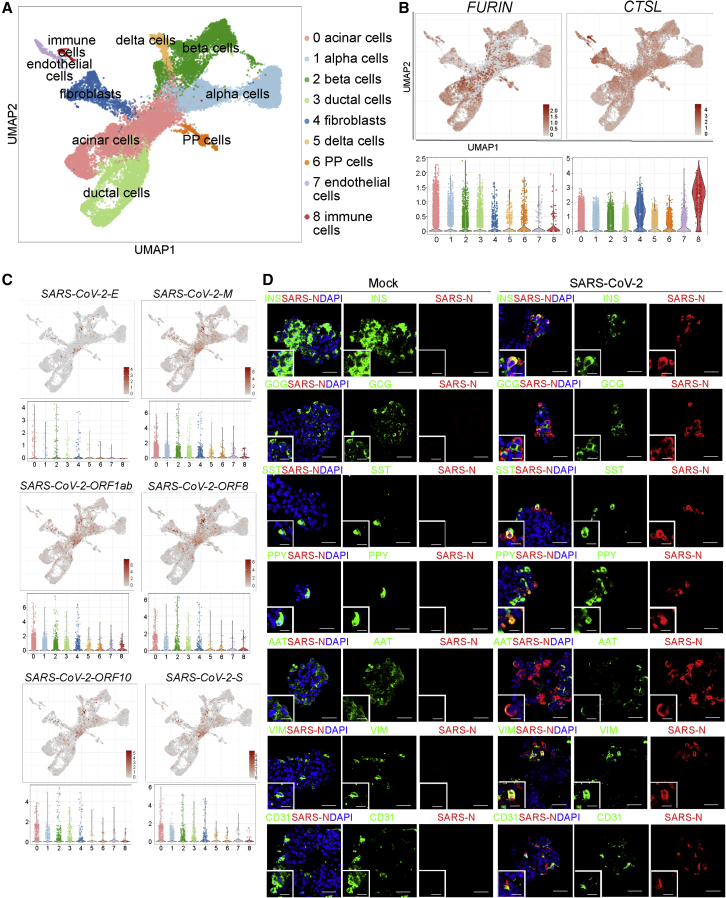
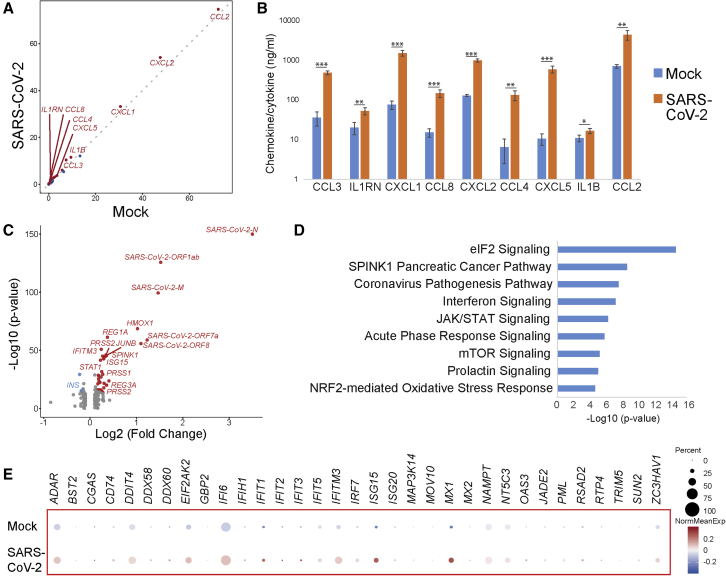
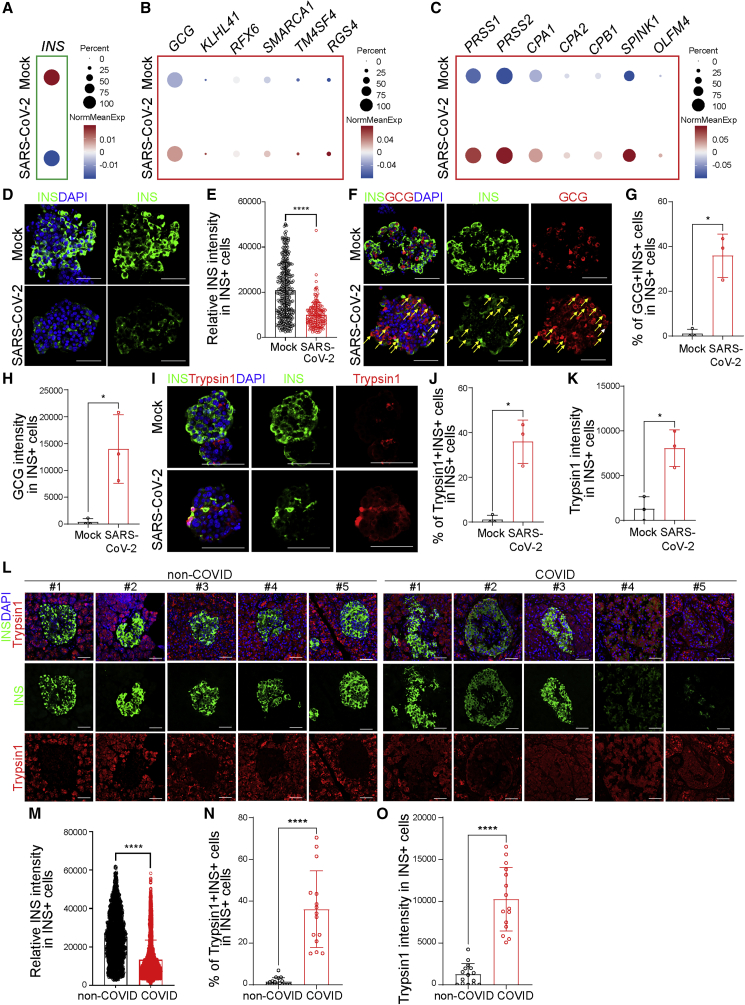
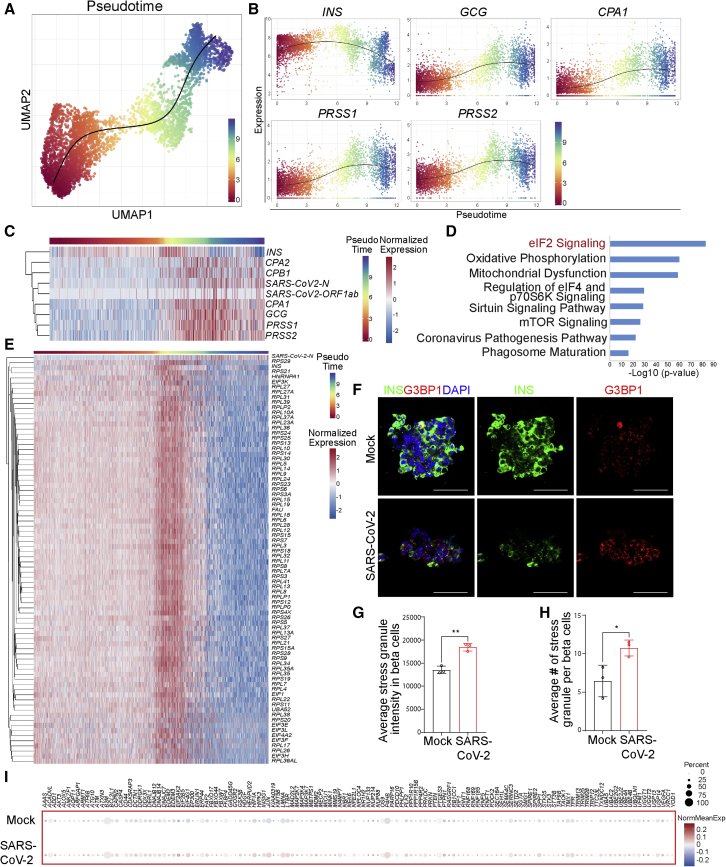
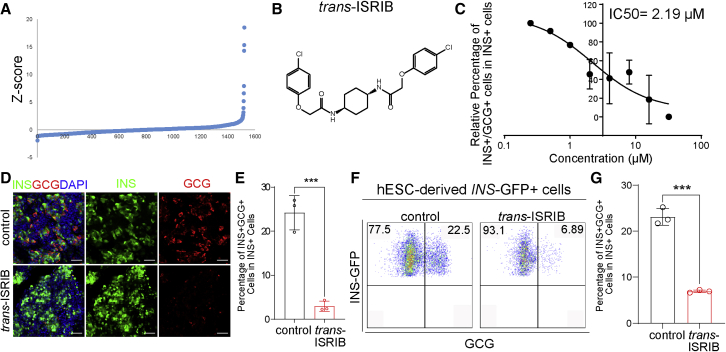
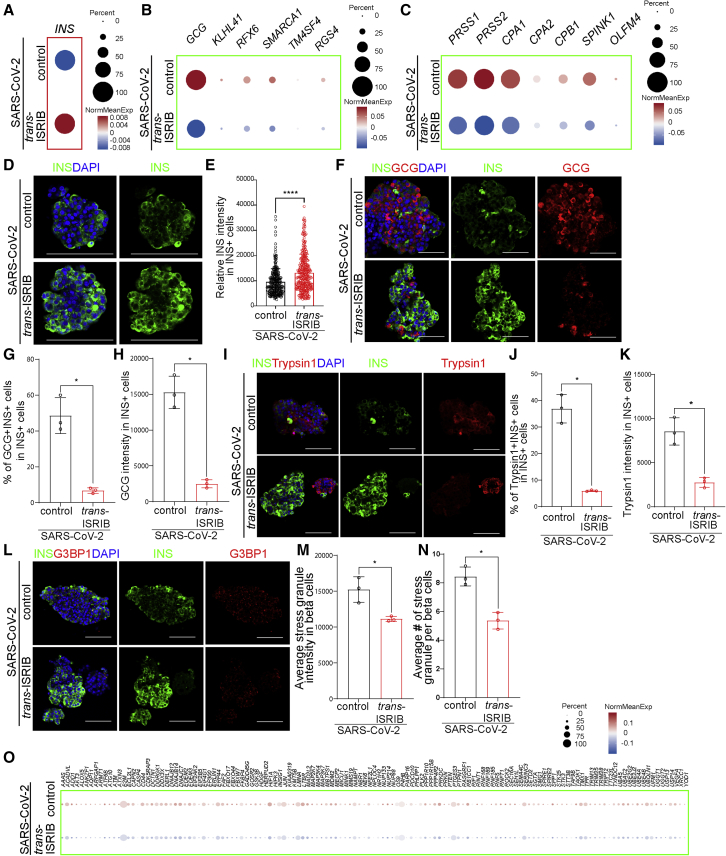
Recent clinical data have suggested a correlation between coronavirus disease 2019 (COVID-19) and diabetes. Here, we describe the detection of SARS-CoV-2 viral antigen in pancreatic beta cells in autopsy samples from individuals with COVID-19. Single-cell RNA sequencing and immunostaining from ex vivo infections confirmed that multiple types of pancreatic islet cells were susceptible to SARS-CoV-2, eliciting a cellular stress response and the induction of chemokines. Upon SARS-CoV-2 infection, beta cells showed a lower expression of insulin and a higher expression of alpha and acinar cell markers, including glucagon and trypsin1, respectively, suggesting cellular transdifferentiation. Trajectory analysis indicated that SARS-CoV-2 induced eIF2-pathway-mediated beta cell transdifferentiation, a phenotype that could be reversed with trans-integrated stress response inhibitor (trans-ISRIB). Altogether, this study demonstrates an example of SARS-CoV-2 infection causing cell fate change, which provides further insight into the pathomechanisms of COVID-19.

Keywords: COVID-19; EgIF2; PRSS1; diabetes; human islets; insulin; trypsin 1.


Conflict of interest statement

Declaration of interests R.E.S. is on the scientific advisory board of Miromatrix Inc. and is a paid consultant and speaker for Alnylam Inc. The other authors declare no competing interests.

Figures

None
Graphical abstract
Figure 1
Figure 1
SARS-CoV-2 viral antigen is detected in beta cells and other pancreatic cells of COVID-19 subjects (A) A representative 63× confocal image of NRP1 (Abcam) in the autopsy pancreas sample of a non-COVID-19 subject (n = 2 images examined in total). Scale bar, 20 μm. Red, NRP1; green, INS; gray, DAPI. (B) Representative confocal images of INS, E-Cad, and SARS-N in the autopsy pancreas sample of non-COVID-19 and COVID-19 subjects (n = 2 images examined in non-COVID-19, n = 5 images examined in COVID-19). The inserts represent high-resolution images from the larger field. Scale bar, 50 μm. Scale bar of insert, 12 μm. Red, SARS-N; green, INS; blue, E-Cad; gray, DAPI. (C) Representative confocal images of CD31, KRT19, and SARS-N in the autopsy pancreas samples of non-COVID-19 and COVID-19 subjects (n = 2 images examined in non-COVID-19, n = 5 images examined in COVID-19). The inserts represent high-resolution images from the larger field. Scale bar, 50 μm. Scale bar of insert, 12 μm. Red, SARS-N; green, CD31; blue, KRT19; gray, DAPI. (D) Representative confocal images of trypsin1, VIM, and SARS-N in the autopsy pancreas samples of non-COVID-19 and COVID-19 subjects (n = 2 images examined in non-COVID-19, n = 5 images examined in COVID-19). The inserts represent high-resolution images from the larger field. Scale bar, 50 μm. Scale bar of insert, 12 μm. Red, SARS-N; green, trypsin1; blue, VIM; gray, DAPI. (E) A representative 63× confocal image of INS, E-Cad, and SARS-N in autopsy pancreas sample of a COVID-19 subject (n = 5 images examined in total). Scale bar, 20 μm. Red, SARS-N; green, INS; blue, E-Cad; gray, DAPI. INS, insulin; NRP1, neuropilin 1; E-Cad, E-cadherin; KRT19, keratin 19; VIM, vimentin; SARS-N, SARS-CoV-2 nucleocapsid.
Figure 2
Figure 2
scRNA-seq analysis of mock- and SARS-CoV-2-infected human islets (A) UMAP of human islets (n = 2 individual islet donors). (B) UMAP and violin plots showing the expression levels of SARS-CoV-2 entry factors, including FURIN and CTSL (n = 2 individual islet donors). (C) UMAP and violin plots showing the expression levels of SARS-CoV-2 genes, including SARS-CoV-2-E, SARS-CoV-2-M, SARS-CoV-2-ORF1ab, SARS-CoV-2-ORF8, SARS-CoV-2-ORF10, and SARS-CoV-2-S (n = 2 individual islet donors). (D) Representative confocal images of INS, GCG, SST, PPY, AAT, VIM, CD31, and SARS-N of mock- and SARS-CoV-2- (MOI = 1) infected human islets at 48 hpi. The insert represents a high-resolution image from the larger field. Scale bar, 50 μm. Scale bar of insert, 25 μm. Red, SARS-N; green, INS, GCG, SST, PPY, AAT, VIM, and CD31; blue, DAPI (n = 3 individual islet donors).
Figure 3
Figure 3
Human islets show upregulated chemokine response, cell stress, and interferon signaling upon SARS-CoV-2 infection (A) Scoring the chemokine and cytokine expression levels in mock- versus SARS-CoV-2-infected human islets at 24 hpi. Higher score indicates higher expression level and more cells expressing a gene. The red dots indicate the genes encoding upregulated chemokines and cytokines. The blue dots indicate the genes encoding downregulated chemokines and cytokines (n = 2 individual islet donors). (B) ELISA analysis of chemokine and cytokine expression in mock- versus SARS-CoV-2-infected human islets at 24 hpi (n = 3 replicates). Data are presented as mean ± SD. p values were calculated by paired two-tailed Student’s t test. p < 0.05, ∗∗p < 0.01, and ∗∗∗p < 0.001. (C) Volcano plot highlighting genes differentially expressed in mock- versus SARS-CoV-2-infected whole human islets at 24 hpi (n = 2 individual islet donors). (D) Ingenuity pathway analysis of genes differentially expressed in mock- versus SARS-CoV-2-infected human islets at 24 hpi (n = 2 individual islet donors). (E) Dot blot illustrating gene expression levels involved in interferon signaling pathway in mock- versus SARS-CoV-2-infected human islets at 24 hpi. Dot size shows the fraction of cells with non-zero expression; dot color indicates the relative expression level in the two conditions (n = 2 individual islet donors).
Figure 4
Figure 4
Human beta cells undergo transdifferentiation upon SARS-CoV-2 infection (A–C) Dot blot illustrating expression level of INS (A); alpha cell markers, including GCG, KLHL41, RFX6, SMARCA1, TM4SF4, and RGS4 (B); and acinar cell markers, including PRSS1, PRSS2, CPA1, CPA2, CPB1, SPINK1, and OLFM4 (C), in mock- versus SARS-CoV-2-infected human islets at 24 hpi (MOI = 1). Dot size shows the fraction of cells with non-zero expression; dot color indicates the relative expression level in the two conditions (n = 2 individual islet donors). (D and E) Representative confocal images (D) and quantification of relative INS intensity in INS+ cells (E) of mock- versus SARS-CoV-2-infected human islets at 48 hpi. Three images of each sample were used for quantification for each donor (n = 3 individual islet donors, MOI = 1). Scale bar, 50 μm. Green, INS; blue, DAPI. (F–H) Representative confocal images (F) and quantification of the percentage of GCG+INS+ cells in INS+ cells (G) and the average GCG intensity in INS+ cells (H) of mock- versus SARS-CoV-2-infected human islets at 48 hpi (n = 3 individual islet donors, MOI = 1). Scale bar, 50 μm. Red, GCG; green, INS; blue: DAPI. Yellow arrows highlight GCG+INS+ cells. (I–K) Representative confocal images (I) and quantification of the percentage of Typsin1+INS+ cells in INS+ cells (J) and the average Typsin1 intensity in INS+ cells (K) of mock- versus SARS-CoV-2-infected human islets at 48 hpi (n = 3 individual islet donors, MOI = 1). Scale bar, 50 μm. Red, trypsin1; green, INS; blue, DAPI. (L and M) Representative confocal images (L) and quantification of the relative INS intensity in INS+ cells (M) of autopsy samples of non-COVID-19 and COVID-19 subjects. Three images of each sample were used for quantification for each subject. (M) n = 5 non-COVID-19 subjects; n = 5 COVID-19 subjects; scale bar, 50 μm. Red, trypsin1; green, INS; blue, DAPI. (N and O) Quantification of the percentage of Typsin1+INS+ cells in INS+ cells (N) and the average Typsin1 intensity in INS+ cells (O) of autopsy samples of non-COVID-19 or COVID-19 subjects. Three images of each subject were used for quantification (n = 5 COVID-19 subjects; n = 5 non-COVID-19 subjects). Data are presented as mean ± SD. p values were calculated by paired or unpaired two-tailed Student’s t test. p < 0.05 and ∗∗∗∗p < 0.0001.
Figure 5
Figure 5
Trajectory analysis identifies a change of eIF2 signaling during beta cell transdifferentiation (A) Ordering beta cells along a transdifferentiation transition in mock- and SARS-CoV-2-infected islets; each cell was assigned a “pseudotime” indicating its relative position in the transition (n = 2 individual islet donors). (B) Changes in expression of INS, GCG, CPA1, PRSS1, and PRSS2 during beta cell transdifferentiation (n = 2 individual islet donors). (C) Heatmap showing expression changes in INS, GCG, CPA1, CPA2, CPB1, PRSS1, PRSS2, SARS-CoV-2-N, and SARS-CoV-2-ORF1ab during beta cell transdifferentiation. Cells were ordered in pseudotime (n = 2 individual islet donors). (D) Ingenuity pathway analysis on genes changed during beta cell transdifferentiation (n = 2 individual islet donors). (E) Heatmap showing expression changes in eIF2-pathway-associated genes during beta cell transdifferentiation. Cells were ordered in pseudotime (n = 2 individual islet donors). (F–H) Representative confocal images (F) and quantification of the average stress granule intensity in INS+ cells (G) and the average stress granule number in INS+ cells (H) of mock- versus SARS-CoV-2-infected human islets at 48 hpi (n = 3 individual islet donors, MOI = 1). Scale bar, 50 μm. Data are presented as mean ± SD. p values were calculated by paired or unpaired two-tailed Student’s t test. p < 0.05 and ∗∗p < 0.01. Red, G3BP1; green, INS; blue, DAPI. (I) Dot blot illustrating expression of cell-stress-associated genes in mock- versus SARS-CoV-2-infected human islets at 24 hpi (MOI = 1). Dot size shows the fraction of cells with non-zero expression; dot color indicates the relative expression level in the two conditions (n = 2 individual islet donors).
Figure 6
Figure 6
A high-throughput screen to identify a compound rescuing beta cell transdifferentiation (A) Primary screen data. hESC-derived pancreatic endocrine cells were treated at 10 μM with compounds from an in-house library containing US FDA-approved drugs and signaling pathway regulators. DMSO treatment was used as a negative control. After 4 days of culture, cells were fixed and stained with antibodies against INS and GCG. (B) Chemical structure of trans-ISRIB. (C) Dose curve of trans-ISRIB on the relative polyhormonal rate (n = 3 biological replicates). (D and E) Representative images (D) and quantification of the polyhormonal rate (E) of hESC-derived INS-GFP+ cells after 4 days treatment of 4 μM trans-ISRIB (n = 3 biological replicates). Scale bar, 50 μm. Red, GCG; green, INS; blue, DAPI. (F and G) Flow cytometry analysis (F) and quantification of polyhormonal rate (G) of hESC-derived INS-GFP+ cells after 4 days of treatment of 4 μM trans-ISRIB (n = 3 biological replicates). Data are presented as mean ± SD. p values were calculated by unpaired two-tailed Student’s t test. ∗∗∗p < 0.001.
Figure 7
Figure 7
Trans-ISRIB blocks human beta cell transdifferentiation upon SARS-CoV-2 infection (A–C) Dot blot illustrating expression level of INS (A); alpha cell markers, including GCG, KLHL41, RFX6, SMARCA1, TM4SF4, and RGS4 (B); and acinar cell markers, including PRSS1, PRSS2, CPA1, CPA2, CPB1, SPINK1, and OLFM4 (C), in beta cells of control or 10 μM trans-ISRIB-treated human islets at 24 hpi (MOI = 1). Dot size shows the fraction of cells with non-zero expression; dot color indicates the relative expression level in the two conditions (n = 1 islet donor). (D and E) Representative confocal images (D) and quantification of relative INS intensity in INS+ cells (E) of control or 10 μM trans-ISRIB-treated human islets at 48 hpi (n = 3 individual islet donors, MOI = 1). Scale bar, 50 μm. Green, INS; blue, DAPI. (F–H) Representative confocal images (F) and quantification of the percentage of GCG+INS+ cells in INS+ cells (G) and the average GCG intensity in INS+ cells (H) of control or 10 μM trans-ISRIB-treated human islets at 48 hpi (n = 3 individual islet donors, MOI = 1). Scale bar, 50 μm. Red, GCG; green, INS; blue, DAPI. (I–K) Representative confocal images (I) and quantification of the percentage of Typsin1+INS+ cells in INS+ cells (J) and the average Typsin1 intensity in INS+ cells (K) of control or 10 μM trans-ISRIB-treated human islets at 48 hpi (n = 3 individual islet donors, MOI = 1). Scale bar, 50 μm. Red, trypsin1; green, INS; blue, DAPI. (L–N) Representative confocal images (L) and quantification of the average stress granule intensity in INS+ cells (M) and the average stress granule number in INS+ cells (N) of control or 10 μM trans-ISRIB-treated human islets at 48 hpi (n = 3 individual islet donors, MOI = 1). Scale bar, 50 μm. Red, G3BP1; green, INS; blue, DAPI. (O) Dot blot illustrating expression levels of cell-stress-associated genes of control or 10 μM trans-ISRIB-treated human islets at 24 hpi (MOI = 1). Dot size shows the fraction of cells with non-zero expression; dot color indicates the relative expression level in the two conditions (n = 1 islet donor). Data are presented as mean ± SD. p values were calculated by unpaired two-tailed Student’s t test. p < 0.05.

Comment in

References

    1. Adomavicius T., Guaita M., Zhou Y., Jennings M.D., Latif Z., Roseman A.M., Pavitt G.D. The structural basis of translational control by eIF2 phosphorylation. Nat. Commun. 2019;10:2136. - PMC - PubMed
    1. Amin S., Cook B., Zhou T., Ghazizadeh Z., Lis R., Zhang T., Khalaj M., Crespo M., Perera M., Xiang J.Z. Discovery of a drug candidate for GLIS3-associated diabetes. Nat. Commun. 2018;9:2681. - PMC - PubMed
    1. Ashary N., Bhide A., Chakraborty P., Colaco S., Mishra A., Chhabria K., Jolly M.K., Modi D. Single-cell RNA-seq identifies cell subsets in human placenta that highly expresses factors driving pathogenesis of SARS-CoV-2. Front. Cell Dev. Biol. 2020;8:783. - PMC - PubMed
    1. Baron M., Veres A., Wolock S.L., Faust A.L., Gaujoux R., Vetere A., Ryu J.H., Wagner B.K., Shen-Orr S.S., Klein A.M. A single-cell transcriptomic map of the human and mouse pancreas reveals inter- and intra-cell population structure. Cell Syst. 2016;3:346–360.e4. - PMC - PubMed
    1. Blanco-Melo D., Nilsson-Payant B.E., Liu W.C., Uhl S., Hoagland D., Møller R., Jordan T.X., Oishi K., Panis M., Sachs D. Imbalanced host response to SARS-CoV-2 drives development of COVID-19. Cell. 2020;181:1036–1045.e9. - PMC - PubMed

Publication types

MeSH terms