. 2021 Jul 22;184(15):4016-4031.e22.
doi: 10.1016/j.cell.2021.05.021. Epub 2021 Jun 2.

Secreted gelsolin inhibits DNGR-1-dependent cross-presentation and cancer immunity

Affiliations

Secreted gelsolin inhibits DNGR-1-dependent cross-presentation and cancer immunity

Evangelos Giampazolias et al. Cell. .

Abstract

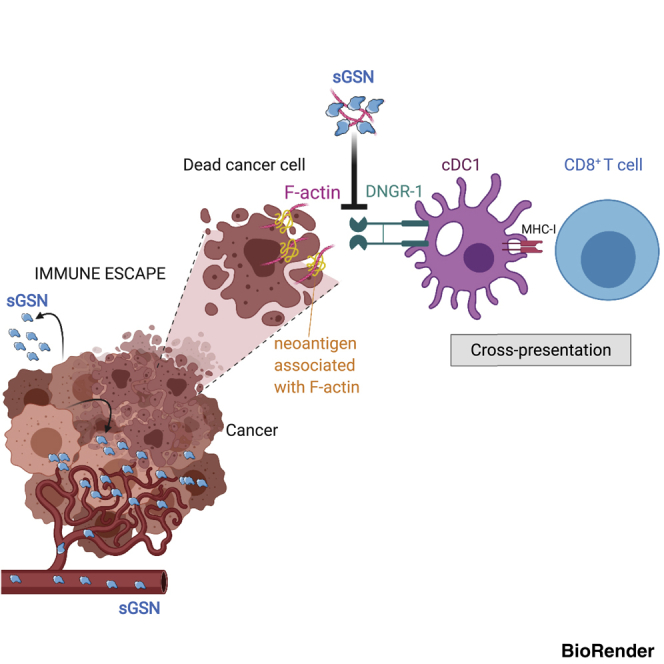
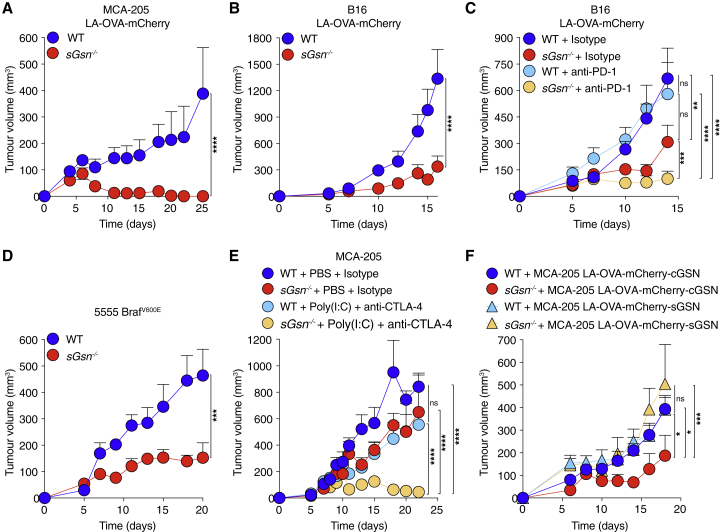
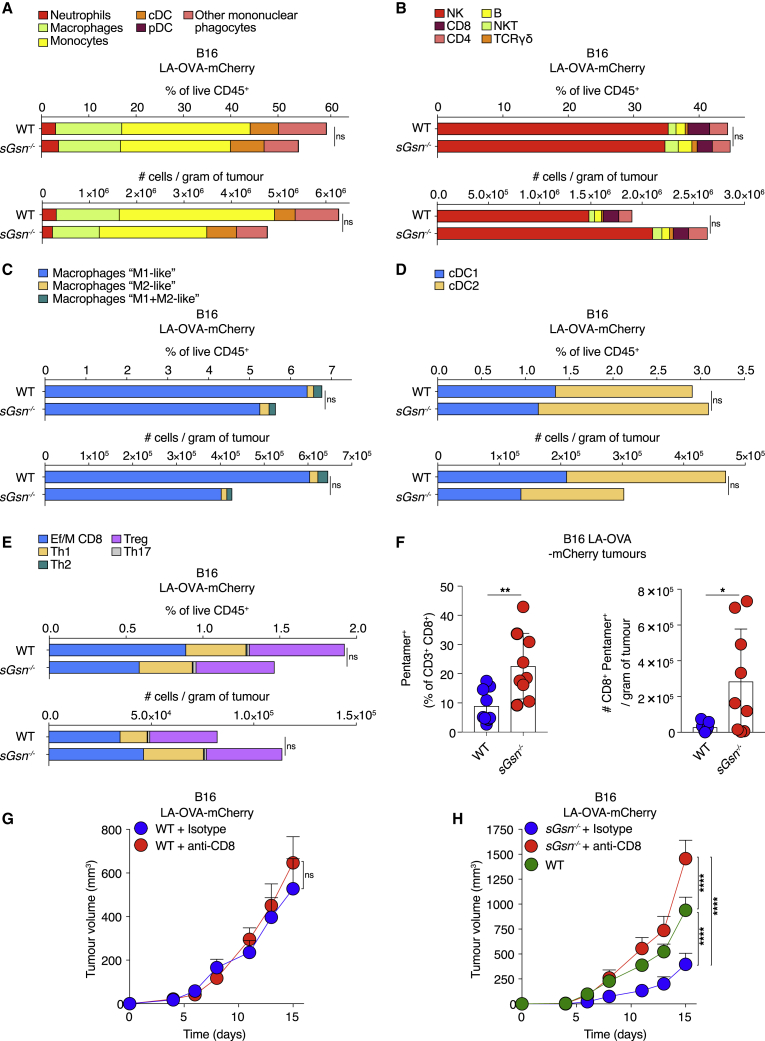
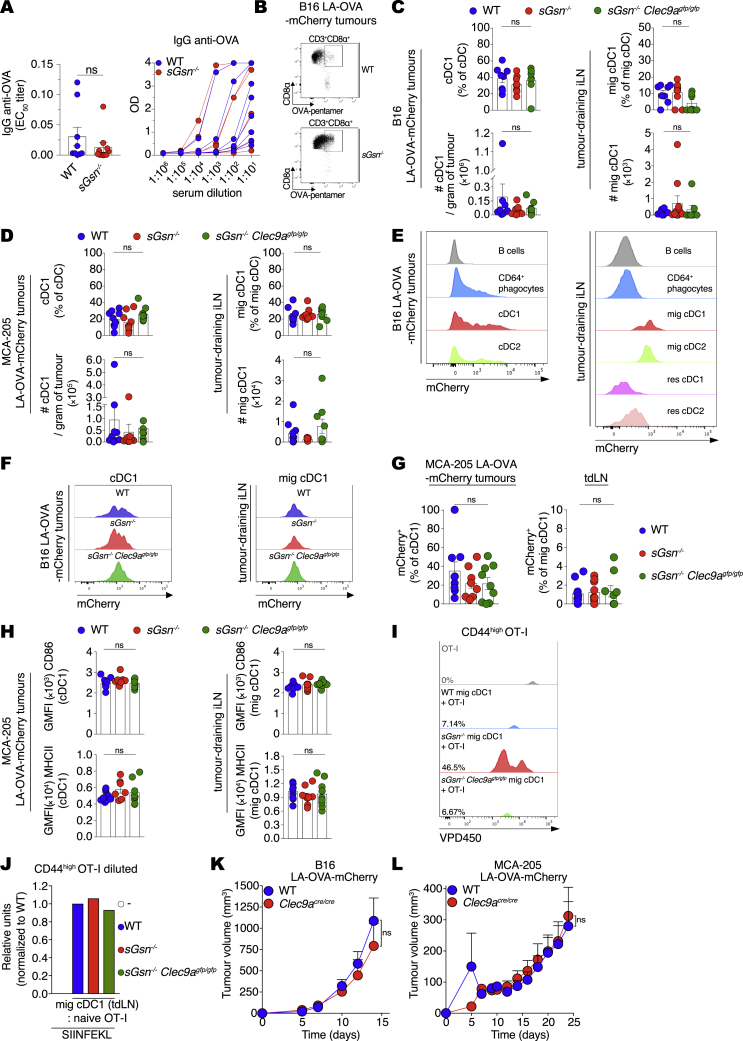
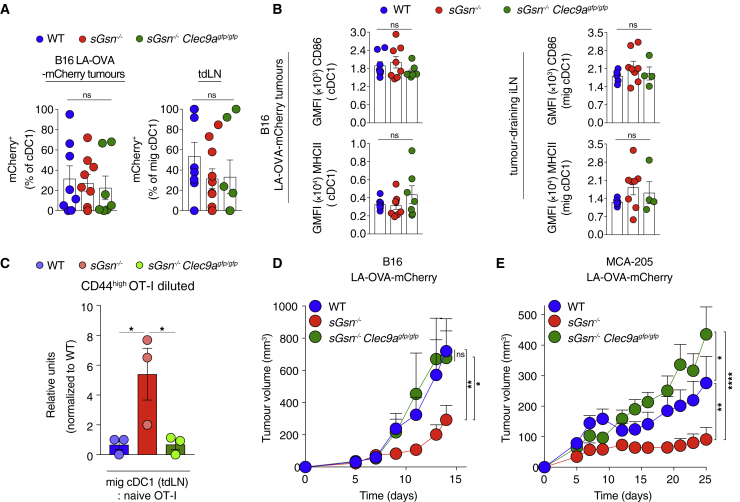
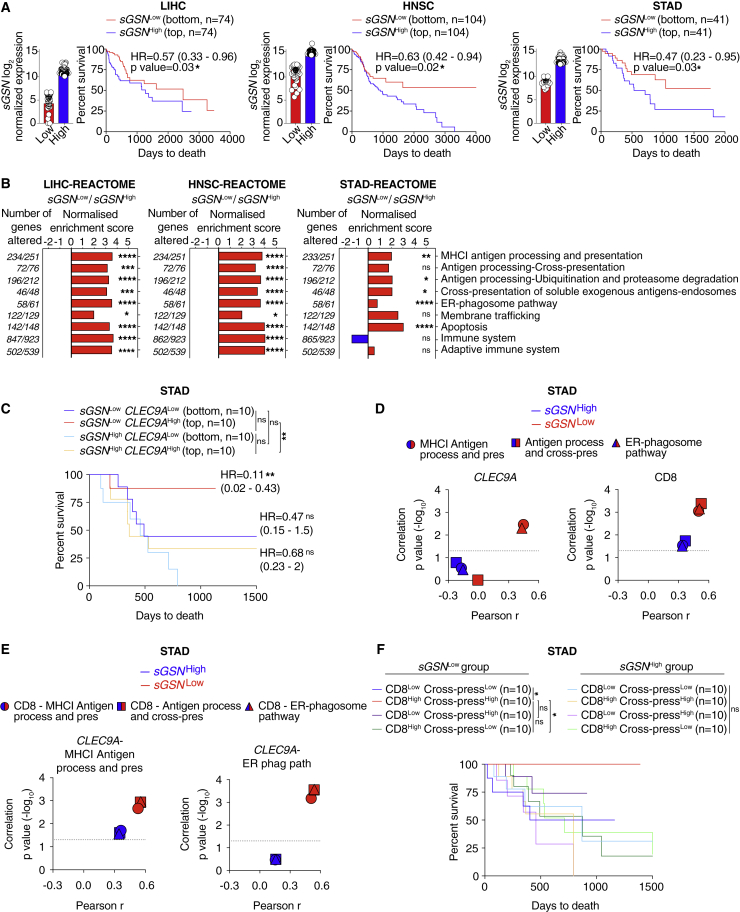
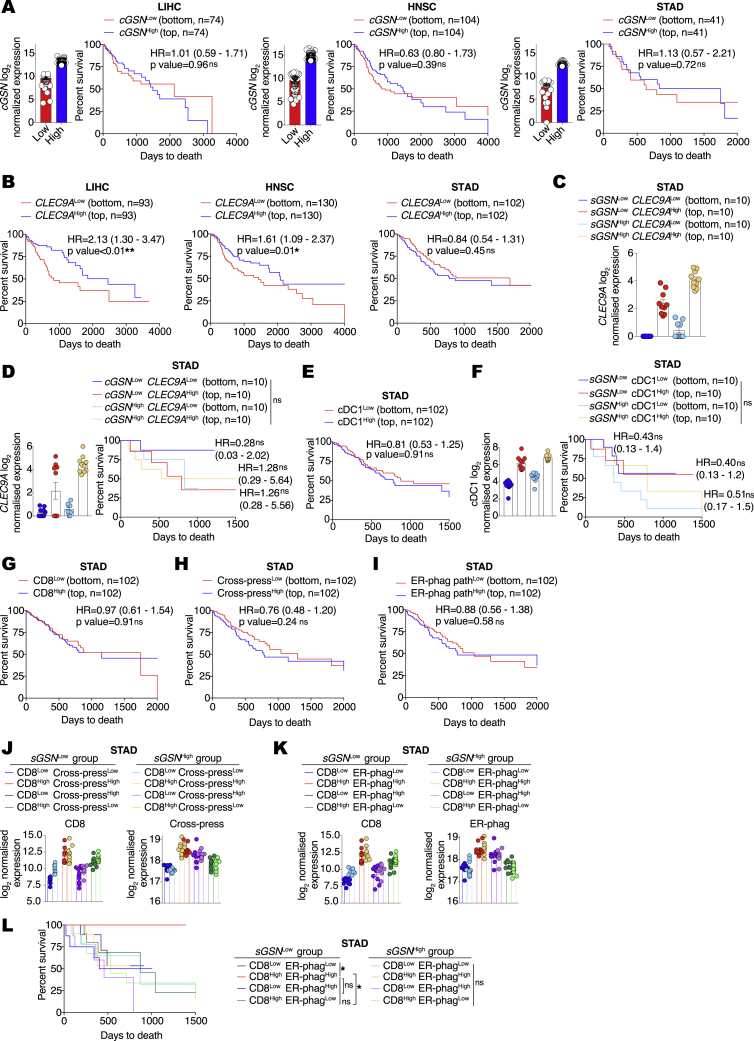
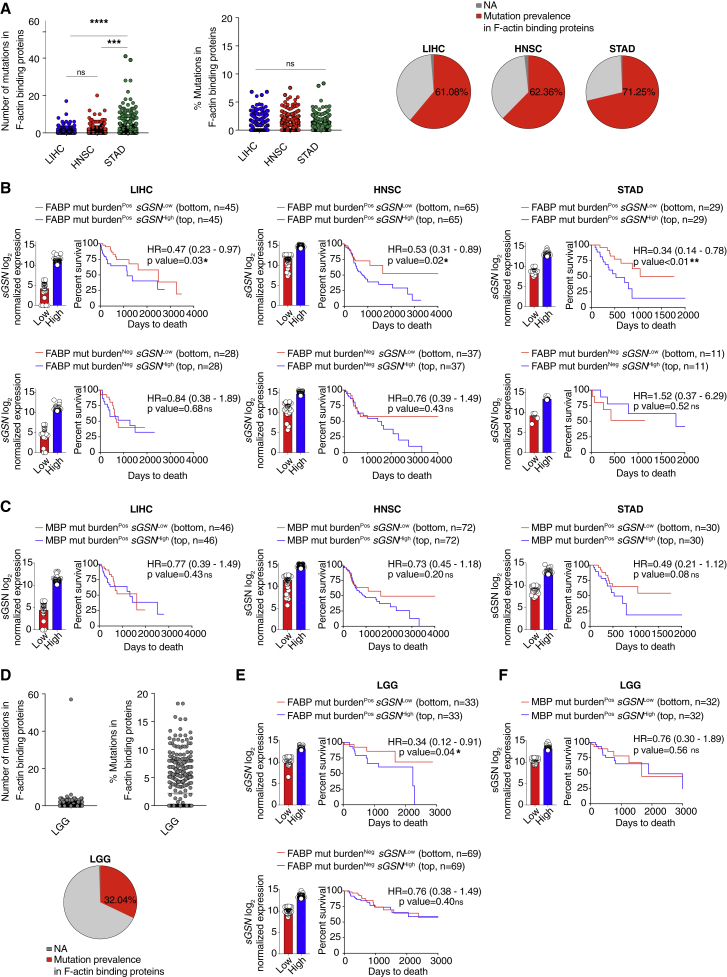
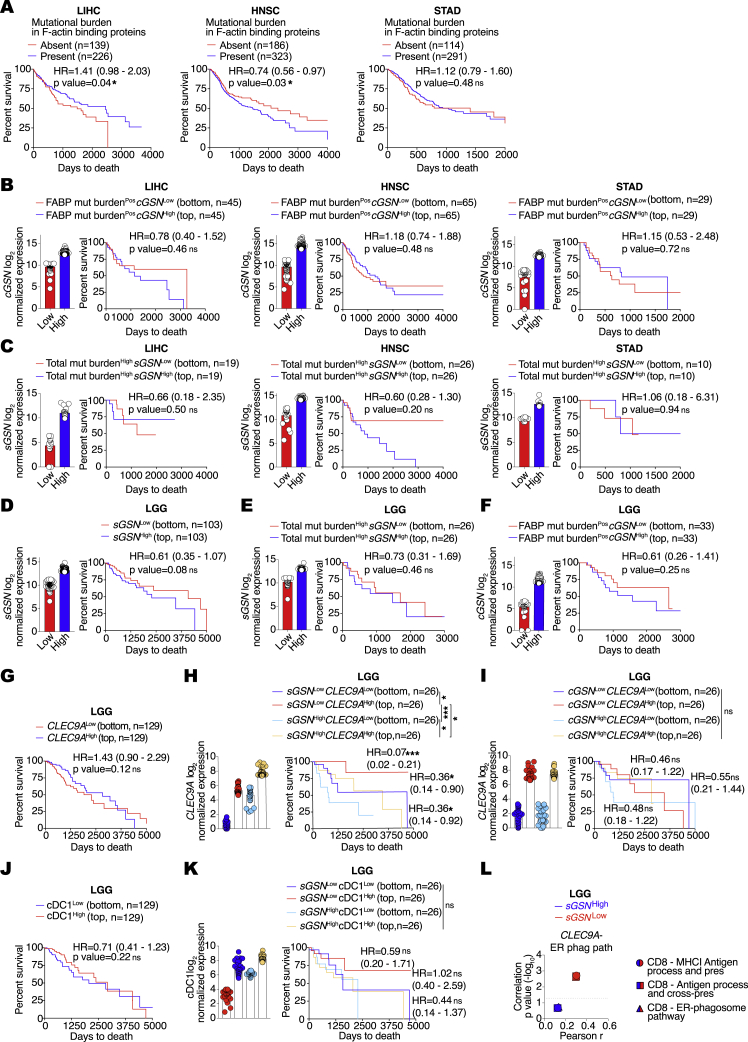
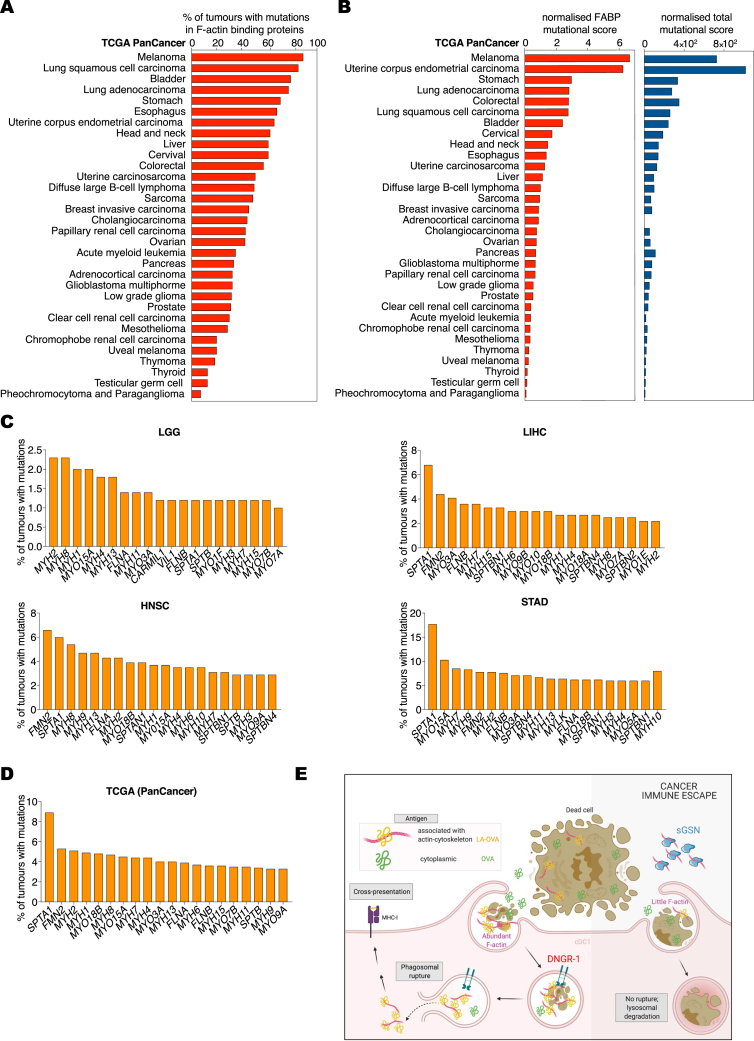
Cross-presentation of antigens from dead tumor cells by type 1 conventional dendritic cells (cDC1s) is thought to underlie priming of anti-cancer CD8+ T cells. cDC1 express high levels of DNGR-1 (a.k.a. CLEC9A), a receptor that binds to F-actin exposed by dead cell debris and promotes cross-presentation of associated antigens. Here, we show that secreted gelsolin (sGSN), an extracellular protein, decreases DNGR-1 binding to F-actin and cross-presentation of dead cell-associated antigens by cDC1s. Mice deficient in sGsn display increased DNGR-1-dependent resistance to transplantable tumors, especially ones expressing neoantigens associated with the actin cytoskeleton, and exhibit greater responsiveness to cancer immunotherapy. In human cancers, lower levels of intratumoral sGSN transcripts, as well as presence of mutations in proteins associated with the actin cytoskeleton, are associated with signatures of anti-cancer immunity and increased patient survival. Our results reveal a natural barrier to cross-presentation of cancer antigens that dampens anti-tumor CD8+ T cell responses.

Keywords: CLEC9A; DNGR-1; F-actin; cancer immunity; cross-presentation; dendritic cells; secreted gelsolin.


Conflict of interest statement

Declaration of interests E.G., O.S., K.H.J.L., N.S., O.G., S.Z., S.S., P.C., and C.R.S. are named as inventors on a patent application on the use of sGSN for immunotherapies. C.R.S. owns stock options and/or is a paid consultant for Bicara Therapeutics, Montis Biosciences, Oncurious NV, Bicycle Therapeutics, and Sosei Heptares. C.R.S. holds a professorship at Imperial College London and honorary professorships at University College London and King’s College London. None of these activities are related to this work.

Figures

None
Graphical abstract
Figure 1
Figure 1
sGSN inhibits DNGR-1 binding to F-actin (A–C) Serial (2-fold) dilutions (wedge) of in vitro polymerized F-actin (top concentration 0.2 μM) or no F-actin (PBS; arrows) were spotted onto a membrane. DNGR-1 ECD (5 μg/mL) binding to the dots was detected following pre-treatment of the membrane with (A) the indicated doses of FCS, (B) ABP-depleted or mock-depleted FCS, and (C) sGSN or cofilin (both at 10 μg/mL). (D, and E) Flow cytometric analysis of bead-bound F-actin treated or not with (D) 10 μg/mL sGSN or (E) 10 μg/mL sGSN in the presence or absence of Ca2+ before staining with DNGR-1 ECD, anti-GSN, or anti-actin antibodies. Numbers above graphs represent mean fluorescence intensity for each of the three samples. (F) Generation of sGsn−/− mice using CRISPR/Cas9 technology and sgRNA pairs that target the signal peptide sequence. Table shows different enzymatically modified (em1–8) mutant alleles generated and their predicted protein sequence. (G) Serum (top panel) and spleen lysates (bottom panel) from intercrossed littermate mutant mice genotyped for the indicated alleles were immunoblotted for the indicated proteins. WT indicates mice that after genotyping were deemed sGsn+/+. Homozygous line em2 was selected for further characterization and is henceforth referred to as sGsn−/− mice. (H) Dot blot analysis of DNGR-1 ECD binding to immobilized F-actin, pre-treated or not with FCS or 10% mouse serum from WT or sGsn-deficient mice. #1 and #2 represent serum from individual mice. Data are representative of (E) two, (B, C, and H) three, and (A and D) six independent experiments. See also Figure S1.
Figure S1
Figure S1
sGsn−/− mice exhibit normal immune profiles, related to Figure 1 (A) Weight curves for WT (n = 5) and sGsn−/− (n = 5) mice over time. (B) Cells from thymus, spleen and inguinal lymph nodes (iLN) of WT (n = 5) and sGsn−/− (n = 4) mice were counted using the automated cell counter ViCell. Cell viability was measured using trypan blue exclusion. (C) The frequency of live CD45+ cells in thymus, spleen and iLN of WT (n = 5) and sGsn−/− (n = 4) mice was measured using flow cytometry. (D–I) Flow cytometric analysis of the indicated immune cell populations in thymus, spleen and iLN of WT (n = 5) and sGsn−/− (n = 4) mice. (J) WT (n = 4) or sGsn−/− (n = 4) mice were infected subcutaneously with N. brasiliensis. Lungs were harvested day 3 post-infection and parasite actin mRNA levels were determined by qRT-PCR in bronchoalveolar lavage fluid (BALF) samples as a measure of infectious burden. (K) WT (n = 5) or sGsn−/− (n = 5) mice were infected subcutaneously with N. brasiliensis. Flow cytometric analysis of the indicated immune cell populations in BALF samples on day 3 post-infection. Percentage of live CD45+ cells (left) and total numbers of indicated immune populations (right) are shown. (L and M) WT (n = 4) or sGsn−/− (n = 4) mice were infected subcutaneously with N. brasiliensis. (L) Transcripts encoding of markers of type 2 immunity or (M) the indicated cytokines were measured in BALF samples. (N) Quantitation of effector memory CD8+ T cells in WT (n = 5) or sGsn−/− (n = 6) mice after intranasal challenge with influenza A virus X31. Graphs show frequency (left) and numbers (right) of effector memory CD8+ T cells (Db-NP366-374 pentamer+ CD103- cells) in the lungs of infected mice. (O) IgG and IgM auto-antibodies were measured in serum of aged WT (n = 5) and sGsn−/− (n = 5) co-housed mice. Antibody score is shown as mean ± SEM. Data (A-O) are plotted as mean ± SEM and are representative of one experiment (A, L-O) and two experiments (B-K). Weight curves (A) were analyzed using Bonferroni-corrected two-way ANOVA. Number of cells, frequency of immune subsets, transcript expression and cytokine concetration (B-N) were compared using two-tailed unpaired t test with Welch’s correction. Auto-antibody scores (O) were compared using two-tailed Wilcoxon matched-pairs signed rank test p ≤ 0.05, ∗∗∗∗p < 0.0001. ns, not significant.
Figure 2
Figure 2
sGSN reduces DNGR-1 triggering and cross-presentation of cell-associated antigen by cDC1s (A–D) (A) Titration of F-actin or (B–D) dead cells on BWZ-mDNGR-1 reporter cells. Graphs show reporter activity measured by absorbance after addition of β-galactosidase substrate to lysed cells. Plotted data represent mean ± SD of duplicate wells. (A) F-actin in the absence or presence of added sGSN. (B) UV-treated bm1OVAMEF and tumor cell lines (5555 BrafV600E, B16-LAOVA-mCherry, MCA205-LAOVA-mCherry) in the absence or presence of sGSN. (C) 5555 BrafV600E-induced BWZ stimulation using serum from mice deficient in sGSN or doubly deficient in sGSN and Gc globulin in the absence or presence of added sGSN. (D) Comparison of UV-treated parental (expressing GSN; blue circles) and GSN knockdown 5555 BrafV600E cells (lacking GSN; red circles). (E) UV-treated 5555 BrafV600E (left panel) cells pulsed with OVA or bm1OVAMEF (right panel) cells were added at various doses to Mutu DC in the absence or presence of sGSN and co-cultured with pre-activated OT-I cells. Graphs show concentration of IFN-γ in the supernatant after overnight culture. Plotted data represent mean ± SD of duplicate wells. Data are representative of two (C and D) and three (A, B, and E) independent experiments. All data were analyzed using Bonferroni-corrected two-way ANOVA. ∗∗∗∗p < 0.0001; ns, not significant. See also Figure S2.
Figure S2
Figure S2
sGSN specifically inhibits DNGR-1-mediated responses to cell-associated F-actin ligand, related to Figure 2 (A and C) Stimulation of BWZ-mDNGR-1 reporter cells by plate-bound anti-DNGR-1 antibody in the absence or presence of sGSN (A) and titration of UV-treated 5555 BrafV600E on BWZ-mDNGR-1 reporter cells in the presence of the indicated sGSN concentrations (C). Graphs show absorbance after addition of β-galactosidase substrate to lysed cells. Plotted data represent mean absorbance ± SD of duplicate wells. (B) Recombinant gelsolin (sGSN), Gsn WT (expressing PLKO.1 empty vector) or Gsn KD (expressing PLKO.1-GsnshRNA) 5555 BrafV600E and bm1OVAMEF cells were immunoblotted for gelsolin and β–actin. (D) Presentation of low dose (10 pM) SIINFEKL peptide (left panel) or the indicated concentrations of soluble OVA (right panel) in the absence or presence of sGSN in Mutu DC/OT-I T co-cultures. Graphs show concentration of IFN-γ in the supernatant of overnight cultures as mean ± SD of duplicate wells. Data (A-D) are representative of at least two independent experiments. Data in (A) were analyzed using two-tailed unpaired t test with Welch’s correction. Data in (D, left panel) were analyzed using Bonferroni-corrected one-way ANOVA. Data in (C and D, right panel) were analyzed using Bonferroni-corrected two-way ANOVA. ∗∗∗∗ (p < 0.0001), ns (not significant).
Figure S3
Figure S3
sGSN expression and impact on tumor growth, related to Figure 3 (A) Growth profile of tumors following subcutaneous inoculation of 1 × 106 EG-7 cancer cells in WT (n = 8) or sGsn−/− (n = 8) co-housed mice. (B) Intensity of mCherry fluorescence (geometric mean; GMFI) in MCA-205 parental cells or cells expressing either OVA-mCherry or LA-OVA-mCherry. (C and D) Growth profile of tumors following subcutaneous inoculation of (C) 0.5 × 106 MCA-205 cancer cells expressing OVA-mCherry into WT (n = 9) or sGsn−/− (n = 9) mice or (D) 0.3 × 106 B16.F10 cancer cells expressing OVA-GFP into WT (n = 9) or sGsn−/− (n = 6) mice. (E) Lysates from B16F10 parental cells or cells expressing either OVA-GFP or LA-OVA-mCherry were separated by SDS-PAGE and immunoblotted for OVA and β–Actin. ns, non-specific band. (F and G) Human tissue expression of (F) sGSN and (G) cGSN from the Genotype-Tissue Expression (GTEx) database. (H) sGSN isoform as a percentage of total gelsolin transcript expression in human tissues. (I) Recombinant gelsolin (sGSN) or supernatants from cultures of the indicated tumor cell lines were separated by SDS-PAGE and immunoblotted for gelsolin. (J) Cell lysates and supernatant of MCA-205 LA-OVA-mCherry tumors expressing cGSN or sGSN were separated by SDS-PAGE and immunoblotted for gelsolin and β-Actin. (K) GFP fluorescence of MCA-205 LA-OVA-mCherry tumors as surrogate for cGSN and sGSN expression. Data in (A, C, D) are mean tumor volume ± SEM and are representative of two independent experiments for A, D and one experiment for C. Tumor growth profiles (A, C, D) were compared using Bonferroni-corrected two-way ANOVA. p ≤ 0.05, ns, not significant.
Figure 3
Figure 3
Loss of sGSN impairs tumor growth and augments response to immune checkpoint blockade (A–C) Growth profile following subcutaneous inoculation of cancer cell lines expressing LA-OVA-mCherry into WT (C57BL/6J) or sGsn−/− mice. (A) 0.5 × 106 MCA-205 LA-OVA-mCherry cancer cells implanted in WT (n = 10) or sGsn−/− (n = 10) mice. (B) 0.3 × 106 B16F10 LA-OVA-mCherry cancer cells implanted in WT (n = 10) or sGsn−/− (n = 10) mice. (C) 0.3 × 106 B16F10 LA-OVA-mCherry cancer cells implanted in WT or sGsn−/− mice that received 200 μg of isotype control or anti-PD-1 monoclonal antibody intraperitoneally (i.p.) every 3 days from day 3 to day 14. WT + isotype (n = 10), sGsn−/− + isotype (n = 9), WT + anti-PD-1 (n = 10), sGsn−/− + anti-PD-1 (n = 10). (D) Growth profile of 0.2 × 106 5555 BrafV600E cancer cells implanted in WT littermate control (sGsn+/+) mice (n = 5) and sGsn−/− mice (n = 5). (E) Growth profile of 0.5 × 106 MCA-205 cancer cells implanted in WT or sGsn−/− mice. Mice received 50 μg of Poly(I:C) or PBS (days 7 and 11) injected intratumorally in the presence of 50 μg of isotype control or anti-CTLA-4 (days 6 and 12) injected i.p. WT + PBS + isotype (n = 6 mice), sGsn−/− + PBS + isotype (n = 5 mice), WT + Poly(I:C) + anti-CTLA-4 (n = 8 mice), sGsn−/− + Poly(I:C) + anti-CTLA-4 (n = 8 mice). (F) Growth profile of 0.5 × 106 MCA-205 LA-OVA-mCherry cancer cells expressing either cGSN or sGSN, implanted in WT (n = 9, cGSN, n = 9, sGSN) or sGsn−/− mice (n = 7, cGSN, n = 8, sGSN). Data in (A–F) are presented as tumor volume (mm3) ± SEM and are representative of at least two independent experiments. Tumor growth profiles (A–F) were compared using Bonferroni-corrected two-way ANOVA. p ≤ 0.05, ∗∗p < 0.01, ∗∗∗p < 0.001, ∗∗∗∗p < 0.0001; ns, not significant. See also Figure S3.
Figure 4
Figure 4
Loss of sGSN permits tumor control dependent on CD8+ T cells (A–E) Quantification of the indicated immune cell populations in the TME of B16 LA-OVA tumors growing in WT (n = 9) or sGsn−/− (n = 10) mice at day 14 post-inoculation. Data are mean of frequency (%) of CD45+ cells (top) or the numbers of cells per gram of tumor (bottom) and are representative of two independent experiments. (F) Quantification of intra-tumoral CD8+ OVA-specific pentamer+ cells at day 16 following subcutaneous inoculation of 0.3 × 106 B16F10 cancer cells expressing LA-OVA-mCherry into WT (n = 9) or sGsn−/− (n = 9) co-housed mice. Data are mean ± SEM of frequency of OVA-specific pentamer+ (% of CD3+ CD8+) cells (left) or the number of CD8+ OVA-pentamer+ cells per gram of tumor (right) and are representative of two experiments. (G) Growth profile of 0.3 × 106 B16F10 cancer cells expressing LA-OVA-mCherry implanted in WT mice. Mice received 300 μg of isotype control or anti-CD8 i.p. (days −3, 1, 4, 7, 10, 13). WT + isotype (n = 10) and WT + anti-CD8 (n = 10). (H) As in (G) but using sGsn−/− mice and comparing to an untreated WT group. WT (n = 21), sGsn−/− + isotype (n = 10) and sGsn−/− + anti-CD8 (n = 10). Groups in (A–F) were compared using two-tailed unpaired t test with Welch’s correction. Tumor growth profiles (G and H) were compared using Bonferroni-corrected two-way ANOVA. p ≤ 0.05, ∗∗p < 0.01, ∗∗∗∗p < 0.0001; ns, not significant. See also Figure S4.
Figure S4
Figure S4
Loss of sGSN does not impact tumor antigen uptake and activation status of cDC1s, related to Figures 4 and 5 (A) OVA-specific IgG antibody response in WT and sGsn−/−mice injected with MCA-205 LA-OVA-mCherry cells expressing cGSN as in (Figure 3F) on day 30 post-tumor inoculation. EC50 titer (left) is shown as mean ± SEM from two experiments. Representative serum titrations from one experiment are shown on the right. (B) Representative dot plot and gating strategy for CD8+ OVA-specific pentamer+ cells in tumor samples at day 16 post-tumor inoculation as in Figure 4F. (C and D) Quantification of cDC1 in tumors (left) and migratory cDC1 in tdLNs (right) of WT (n = 8 or 10), sGsn−/− (n = 9 or 9) or sGsn−/−Clec9agfp/gfp (n = 7 or 9) mice injected with (C) B16F10 LA-OVA-mCherry at day 15 or (D) MCA-205 LA-OVA-mCherry tumor cells analyzed at day 26 post-inoculation. Data (C, D) are presented as mean frequency (top) or number of cDC1 cells per gram of tumor (bottom) ± SEM and are representative of two experiments (C) and one experiment (D). (E) Representative histogram of tumor-derived mCherry across the indicated immune populations in B16F10 LA-OVA-mCherry tumors (left) and tdLNs (right) at day 15 post-inoculation. (F) Representative histograms of mCherry fluorescence in WT, sGsn−/− or sGsn−/−Clec9agfp/gfp cDC1 or mig cDC1 intratumorally (left) and in the tdLN (right) of B16F10 LA-OVA-mCherry tumors at day 15 post-inoculation as in Figure 5A. (G) Quantification of mCherry+ cDC1 or mig cDC1 in WT (n = 10), sGsn−/− (n = 9) or sGsn−/−Clec9agfp/gfp (n = 9) intratumorally (left) and in the tdLN (right) of MCA-205 LA-OVA-mCherry tumors at day 26 post-inoculation. Data are mean ± SEM and are representative of one experiment.. (H) Quantification of geometric mean fluorescent intensity of CD86 and MHC class II staining of cDC1 or mig cDC1 intratumorally (left) and in the tdLN (right) at day 26 post-tumor inoculation with MCA-205 LA-OVA-mCherry into WT (n = 9 or n = 9), sGsn−/− (n = 7 or n = 9) or sGsn−/−Clec9agfp/gfp (n = 8 or n = 9). Data are mean ± SEM and are representative of one experiment. (I) Representative flow cytometric plot of naive OT-I proliferation as measured by dilution of VPD450 dye at 72 h following co-culture with the tdLN mig cDC1 derived from WT, sGsn−/− or sGsn−/−Clec9agfp/gfp at day 14 post-inoculation (B16F10 LA-OVA-mCherry) as in Figure 5C. (J) Quantification of naive OT-I proliferation following ex vivo co-culture with sorted mig cDC1 as in Figure 5C from WT (n = 13), sGsn−/− (n = 12) or sGsn−/−Clec9agfp/gfp (n = 10) in the presence of 10 pM SIINFEKL peptide. Data are mean of relative units (% OT-I proliferated cells normalized to WT) and are representative of one experiment. (K and L) Growth profile of tumors formed following subcutaneous inoculation of (K) 0.3 × 106 B16F10 cancer cells expressing LA-OVA-mCherry implanted in WT (n = 7) or Clec9acre/cre (n = 6) co-housed mice or (L) 0.5 × 106 MCA-205 cancer cells expressing LA-OVA-mCherry into WT (n = 10) or Clec9acre/cre (n = 10) co-housed mice. Groups in (C, D, G, H) were compared using Bonferroni-corrected one-way ANOVA. Tumor growth profiles (K, L) are presented as tumor volume (mm3) ± SEM, are representative of one experiment. and were compared using Bonferroni-corrected two-way ANOVA. ns, not significant.
Figure 5
Figure 5
Loss of sGSN increases DNGR-1-dependent CD8+ T cell cross-priming by migratory cDC1s (A and B) (A) mCherry+ cDC1 or (B) CD86 and MHCII expression by cDC1s (geometric mean fluorescent intensity (GMFI) from tumors (left) or tdLNs (right) at day 15 post inoculation with B16F10 LA-OVA-mCherry cancer cells into (A) WT (n = 8), sGsn−/− (n = 9) or sGsn−/−Clec9agfp/gfp (n = 7) or (B) WT (n = 8 or n = 6), sGsn−/− (n = 8 or n = 8), or sGsn−/−Clec9agfp/gfp (n = 7 or n = 4) mice. Data are mean ± SEM of frequency of (A) mCherry+ (% of migratory cDC1) cells or (B) GMFI and are representative of two experiments. (C) Quantification of naive OT-I proliferation following ex vivo co-culture with sorted migratory cDC1s from tdLN (inguinal and axillary) of WT (n = 44), sGsn−/− (n = 41), or sGsn−/−Clec9agfp/gfp (n = 29) mice at day 14 post-tumor (B16F10 LA-OVA-mCherry) inoculation. Data are mean of relative OT-I proliferation (normalized to proliferation with cDC1s from WT group) ± SEM and are pooled from three independent experiments. (D and E) Growth profile of (D) 0.3 × 106 B16F10 or (E) 0.5 × 106 MCA-205 cancer cells expressing LA-OVA-mCherry implanted in (D) WT (n = 9), sGsn−/− (n = 10), or sGsn−/−;Clec9agfp/gfp (n = 8) or (E) WT (n = 9), sGsn−/− (n = 10), or sGsn−/−; Clec9agfp/gfp (n = 8) mice. Data in (D and E) are presented as tumor volume (mm3) ± SEM and are representative of two independent experiments. Groups in (A–C) were compared using Bonferroni-corrected one-way ANOVA. Tumor growth profiles (D and E) were compared using Bonferroni-corrected two-way ANOVA. p ≤ 0.05, ∗∗p < 0.01, ∗∗∗∗p < 0.0001; ns, not significant. See also Figure S4.
Figure 6
Figure 6
Low sGSN levels in human cancer biopsies correlate with survival of patients with high CLEC9A expression (A) Prognostic value of sGSN transcript levels for overall survival comparing samples with lowest (sGSNLow) and highest (sGSNHigh) expression in the indicated TCGA datasets. Liver hepatocellular carcinoma (LIH), bottom (n = 74) and top (n = 74) 20% of patient cohort. Head and neck squamous cell carcinoma (HNSC), bottom (n = 104) and top (n = 104) 20% of patient cohort. Stomach adenocarcinoma (STAD), bottom (n = 41) and top (n = 41) 10% of patient cohort. (B) Gene set enrichment analysis in the lowest (sGSNLow) group compared to the highest (sGSNHigh) group of cancer patients in the indicated TCGA datasets using Reactome pathway database (positive values in red, negative values in blue). (C) Prognostic value of CLEC9A expression for cancer patient overall survival comparing top and bottom quartiles of sGSNLow and sGSNHigh subgroups in the indicated TCGA dataset. (D) Comparison between Pearson r correlation values, obtained from correlation of CLEC9A or CD8 gene signature with individual MHC class I (cross-)presentation related signature, between sGSNLow and sGSNHigh subgroups in the indicated TCGA dataset. (E) Comparison between Pearson r correlation values, obtained from correlation of CLEC9A-MHC I antigen processing and presentation signature or CLEC9A-ER phagosome pathway signature with individual CD8-MHC class I (cross-)presentation-related signature between sGSNLow and sGSNHigh subgroups in the indicated TCGA dataset. (F) Synergistic prognostic value of CD8 and antigen processing and cross-presentation gene signatures comparing quartiles within sGSNLow and sGSNHigh subgroups in the indicated TCGA dataset. In (A) data are presented as mean of log2 normalized expression ± SEM survival (Kaplan-Meier) curves in (A, C, and F) were compared using Log-rank (Mantel-Cox) test. Hazard ratios (HR) with 95% confidence interval showed in brackets have been calculated in (A) as a ratio of sGSNLow / sGSNHigh group and in (C) as a ratio of each group / sGSNHighCLEC9ALow. In (B), all the genes were ranked by the Wald’s test and false discovery rate (FDR)-adjusted p values (q values) were calculated. In (D and E) the dotted line indicates a p value of 0.05 obtained by Pearson’s r correlation. p ≤ 0.05, ∗∗p < 0.01, ∗∗∗p < 0.001, ∗∗∗∗p < 0.0001; ns, not significant. See also Figure S5 and Table S1.
Figure S5
Figure S5
Gene expression in human biopsies of LIHC, HNSC, and STAD tumors and association with patient survival, related to Figure 6 (A) Prognostic value of cytoplasmic gelslolin (cGSN) transcript levels for overall survival comparing samples with lowest (cGSNLow) and highest (cGSNHigh) expression in the indicated TCGA datasets. Liver hepatocellular carcinoma (LIH), bottom (n = 74) and top (n = 74) 20% of patient cohort. Head and neck squamous cell carcinoma (HNSC), bottom (n = 104) and top (n = 104) 20% of patient cohort. Stomach adenocarcinoma (STAD), bottom (n = 41) and top (n = 41) 10% of patient cohort. (B) Prognostic value of CLEC9A expression for cancer patient overall survival comparing top and bottom quartiles in the indicated TCGA datasets. (C) Transcript levels of CLEC9A expression comparing top and bottom quartiles of sGSNLow and sGSNHigh subgroups in the indicated TCGA datasets. (D) Prognostic value of CLEC9A transcript levels expression for cancer patient overall survival comparing top and bottom quartiles of cGSNLow and cGSNHigh subgroups in the indicated TCGA dataset. (E) Prognostic value of cDC1 gene signature expression for cancer patient overall survival comparing top and bottom quartiles in the indicated TCGA dataset. (F) Prognostic value of cDC1 gene signature expression for cancer patient overall survival comparing top and bottom quartiles of sGSNLow and sGSNHigh subgroups in the indicated TCGA dataset. (G–I) Prognostic value of (G) CD8 gene signature, (H) antigen processing and cross-presentation gene signature, (I) ER phagosome pathway gene signature expression for cancer patient overall survival comparing top and bottom quartiles in the indicated TCGA datasets. (J) Transcript levels of CD8 and antigen processing and cross-presentation gene signatures comparing quartiles within sGSNLow and sGSNHigh subgroups in the indicated TCGA dataset. (K and L) Transcript levels and synergistic prognostic value of CD8 and ER-phagosome pathway gene signatures comparing quartiles within sGSNLow and sGSN subgroups in the indicated TCGA dataset. In (C, D, F, J, K, L) for cGSN and sGSN segregation between the highest and lowest expressors the same cut-off was used as in (A) for the indicated TCGA dataset. In (A, C, D, F, J, K) data are presented as mean of log2 normalized expression ± SEM Survival (Kaplan-Meier) curves in (A, B, D-F, G-I, L) were compared using Log-rank (Mantel-Cox) test. Hazard ratios (HR) with 95% confidence interval showed in brackets have been calculated in (A, B, E and G-I) as a ratio of Low expressed transcript /High expressed transcript group, in (D) as a ratio of each group / cGSNHighCLEC9ALow and in (F) as a ratio of each group / sGSNHighcDC1Low. p ≤ 0.05, ∗∗p < 0.01, ns, not significant.
Figure 7
Figure 7
Low sGSN levels in human cancer biopsies correlate with patient survival on the basis of mutational prevalence in F-actin-binding proteins (A–F) (A and D) Number (left), frequency (percentage of total mutations, middle), and prevalence (percentage of tumors with ≥1 mutation in the indicated class of genes, right) of mutation in F-actin-binding proteins in the indicated TCGA datasets. (B and E) Prognostic value of sGSN transcript levels for overall survival comparing samples with lowest (sGSNLow) and highest (sGSNHigh) expression in the presence (Pos) or absence (Neg) of tumor mutational burden in F-actin-binding proteins (FABPs) in the indicated TCGA datasets. (C and F) Prognostic value of sGSN transcript levels for overall survival comparing samples with lowest (sGSNLow) and highest (sGSNHigh) expression in the presence (Pos) or absence (Neg) of mutational burden in microtubule-binding proteins (MBPs) for cancer patient overall survival in the indicated TCGA datasets. For sGSN segregation between the highest and lowest expressors the same cutoffs were used as in Figures 6A and S6D for the indicated TCGA datasets. In (A–F) data are presented as mean of counts, frequency or log2 normalized expression ± SEM. In (A and D), all data are presented as mean ± SEM and were analyzed using Dunn’s-corrected Kruskal-Wallis (one-way ANOVA). Survival (Kaplan-Meier) curves in (B, C, E, and F) were compared using Log-rank (Mantel-Cox) test. Hazard ratios (HR) with 95% confidence interval showed in brackets have been calculated in (B, C, E, and F) as a ratio of sGSNLow / sGSNHigh group. NA, not applicable. q ≤ 0.05, ∗∗p < 0.01, ∗∗∗p < 0.001, ∗∗∗∗p < 0.0001; ns, not significant. See also Figures S6 and S7 and Tables S2 and S3.
Figure S6
Figure S6
Total and cytoskeleton binding protein-specific tumor mutational burden in human biopsies and their association with patient survival, related to Figure 7 (A) Prognostic value of presence or absence of mutational burden in F-actin binding proteins for cancer patient overall survival in the indicated TCGA datasets. (B) Prognostic value of cGSN transcript levels for overall survival comparing samples with lowest (cGSNLow) and highest (cGSNHigh) expression in the presence (Pos) or absence (Neg) of tumor mutational burden in F-actin binding proteins (FABP) in the indicated TCGA datasets. (C) Prognostic value of sGSN transcript levels for overall survival comparing samples with lowest (sGSNLow) and highest (sGSNHigh) expression in the high tumor mutational burden (top quartile) patient subcohort of the indicated TCGA datasets. In (B and C) for cGSN and sGSN segregation between the highest and lowest expressors the same cut-off was used as in (Figure 6A) for the indicated TCGA datasets. (D) Prognostic value of sGSN transcript levels for overall survival comparing samples with lowest (sGSNLow) and highest (sGSNHigh) expression in the indicated TCGA dataset. Low grade glioma (LGG), bottom (n = 103) and top (n = 103) 20% of patient cohort. (E) Prognostic value of sGSN transcript levels for overall survival comparing samples with lowest (sGSNLow) and highest (sGSNHigh) expression in the high tumor mutational burden (top quartile) patient subcohort of the indicated TCGA dataset. (F) Prognostic value of cGSN transcript levels for overall survival comparing samples with lowest (sGSNLow) and highest (sGSNHigh) expression in the presence (Pos) of tumor mutational burden in F-actin binding proteins (FABP) in the indicated TCGA dataset. (G) Prognostic value of CLEC9A expression for cancer patient overall survival comparing top and bottom quartiles in the indicated TCGA dataset. (H) Prognostic value of CLEC9A expression for cancer patient overall survival comparing top and bottom quartiles of sGSNLow and sGSNHigh subgroups in the indicated TCGA dataset. (I) Prognostic value of CLEC9A transcript levels expression for cancer patient overall survival comparing top and bottom quartiles of cGSNLow and cGSNHigh subgroups in the indicated TCGA dataset. (J) Prognostic value of cDC1 gene signature expression for cancer patient overall survival comparing top and bottom quartiles in the indicated TCGA dataset. (K) Prognostic value of cDC1 gene signature expression for cancer patient overall survival comparing top and bottom quartiles of sGSNLow and sGSNHigh subgroups in the indicated TCGA dataset. In (E, F, H, I, K) for cGSN and sGSN segregation between the highest and lowest expressors the same cut-off was used as in (D) for the indicated TCGA dataset. (L) Comparison between Pearson r correlation values, obtained from correlation of CLEC9A – ER phagosome pathway signature with individual CD8 - MHC class I (cross)-presentation related signature between sGSNLow and sGSNHigh subgroups in the indicated TCGA dataset. In (B-F, H, I, K) all data are presented as mean of log2 normalized expression ± SEM Hazard ratios (HR) with 95% confidence interval showed in brackets have been calculated in (A-G, J) as a ratio of low expressed transcript or absent mutational burden / high expressed transcript or present mutational group, in (H) as a ratio of each group / sGSNHighCLEC9ALow, in (I) as a ratio of each group / cGSNHighCLEC9ALow and in (K) as a ratio of each group / sGSNHighcDC1Low. Survival (Kaplan-Meier) curves in (A-K) were compared using Log-rank (Mantel-Cox) test. In (L) the dotted line indicates a p value of 0.05 obtained by Pearson’s r correlation. p ≤ 0.05, ∗∗∗p < 0.001. ns, not significant.
Figure S7
Figure S7
Prevalence of mutations in F-actin-binding proteins in human cancers, related to Figure 7 (A) Mutational prevalence presented as percentage of tumors with ≥ 1 mutation in F-actin binding proteins in the indicated TCGA datasets. (B) Normalized F-actin binding proteins (FABP; left) or total (right) mutational scores are defined as number of mutations per number of tumors in the indicated TCGA datasets. (C and D) Top 20 frequently mutated F-actin binding proteins (C) as percentage of total mutation count of tumors in LGG, LIHC, HNSC, STAD datasets and (D) as percentage of total mutation counts of tumors among all the TCGA datasets listed in (A and B). (E) Schematic summary of the findings: sGSN in the TME promotes cancer immune evasion by inhibiting F-actin binding to DNGR-1, thus, leading to impairement of phagosomal rupture in cDC1 and subsequent cross-presentation preferentially of neoantigens associated with actin cytoskeleton. Image was generated with BioRender.

References

    1. Ahrens S., Zelenay S., Sancho D., Hanč P., Kjær S., Feest C., Fletcher G., Durkin C., Postigo A., Skehel M. F-actin is an evolutionarily conserved damage-associated molecular pattern recognized by DNGR-1, a receptor for dead cells. Immunity. 2012;36:635–645. - PubMed
    1. Alloatti A., Rookhuizen D.C., Joannas L., Carpier J.-M., Iborra S., Magalhaes J.G., Yatim N., Kozik P., Sancho D., Albert M.L., Amigorena S. Critical role for Sec22b-dependent antigen cross-presentation in antitumor immunity. J. Exp. Med. 2017;214:2231–2241. - PMC - PubMed
    1. Asano K., Nabeyama A., Miyake Y., Qiu C.-H., Kurita A., Tomura M., Kanagawa O., Fujii S., Tanaka M. CD169-positive macrophages dominate antitumor immunity by crosspresenting dead cell-associated antigens. Immunity. 2011;34:85–95. - PubMed
    1. Asare-Werehene M., Nakka K., Reunov A., Chiu C.-T., Lee W.-T., Abedini M.R., Wang P.-W., Shieh D.-B., Dilworth F.J., Carmona E. The exosome-mediated autocrine and paracrine actions of plasma gelsolin in ovarian cancer chemoresistance. Oncogene. 2020;39:1600–1616. - PMC - PubMed
    1. Balam S., Kesselring R., Elke E., Blaimer S., Evert K., Evert M., Schlitt H.J., Geissler E.K., van Blijswijk J., Lee S. Cross-presentation of dead-cell-associated antigens by DNGR-1+ dendritic cells contributes to chronic allograft rejection in mice. Eur. J. Immunol. 2020;50:2041–2054. - PubMed

Publication types

MeSH terms