. 2021 Sep:158:115-127.
doi: 10.1016/j.yjmcc.2021.05.016. Epub 2021 Jun 1.

Metabolic remodeling precedes mTORC1-mediated cardiac hypertrophy

Affiliations

Metabolic remodeling precedes mTORC1-mediated cardiac hypertrophy

Giovanni E Davogustto et al. J Mol Cell Cardiol. 2021 Sep.

Abstract

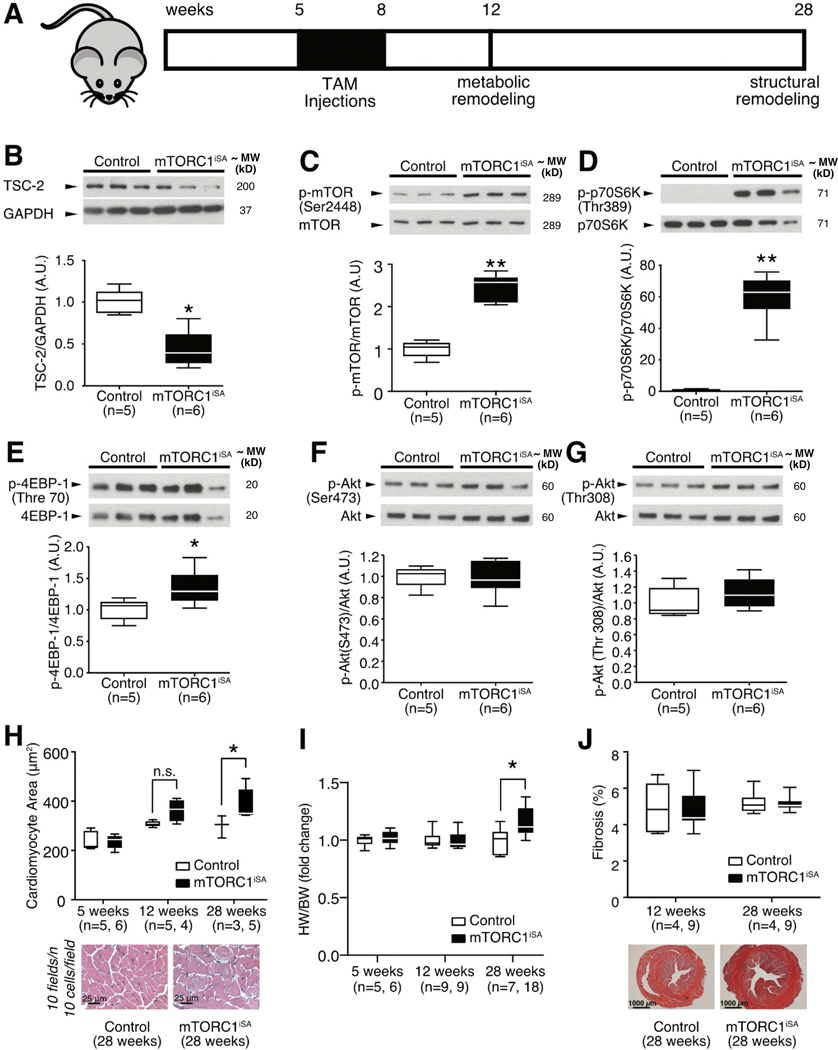
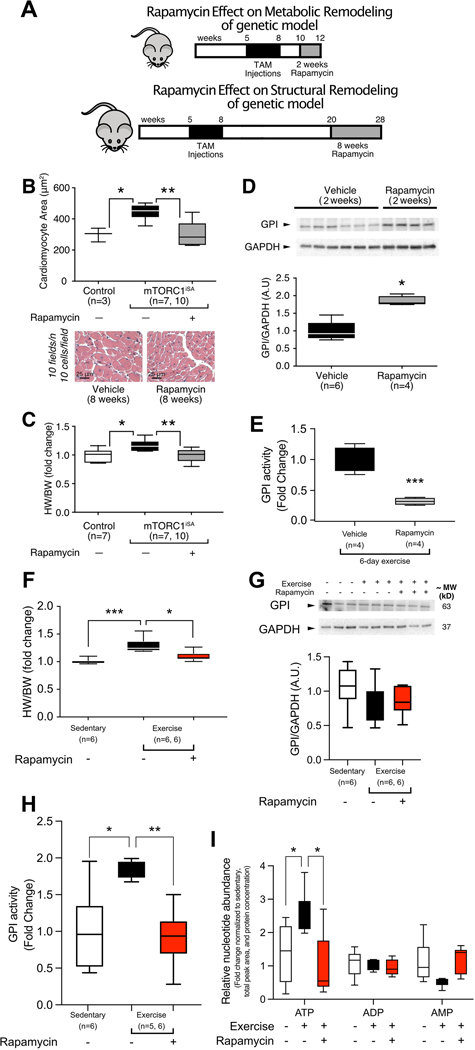
Rationale: The nutrient sensing mechanistic target of rapamycin complex 1 (mTORC1) and its primary inhibitor, tuberin (TSC2), are cues for the development of cardiac hypertrophy. The phenotype of mTORC1 induced hypertrophy is unknown.

Objective: To examine the impact of sustained mTORC1 activation on metabolism, function, and structure of the adult heart.

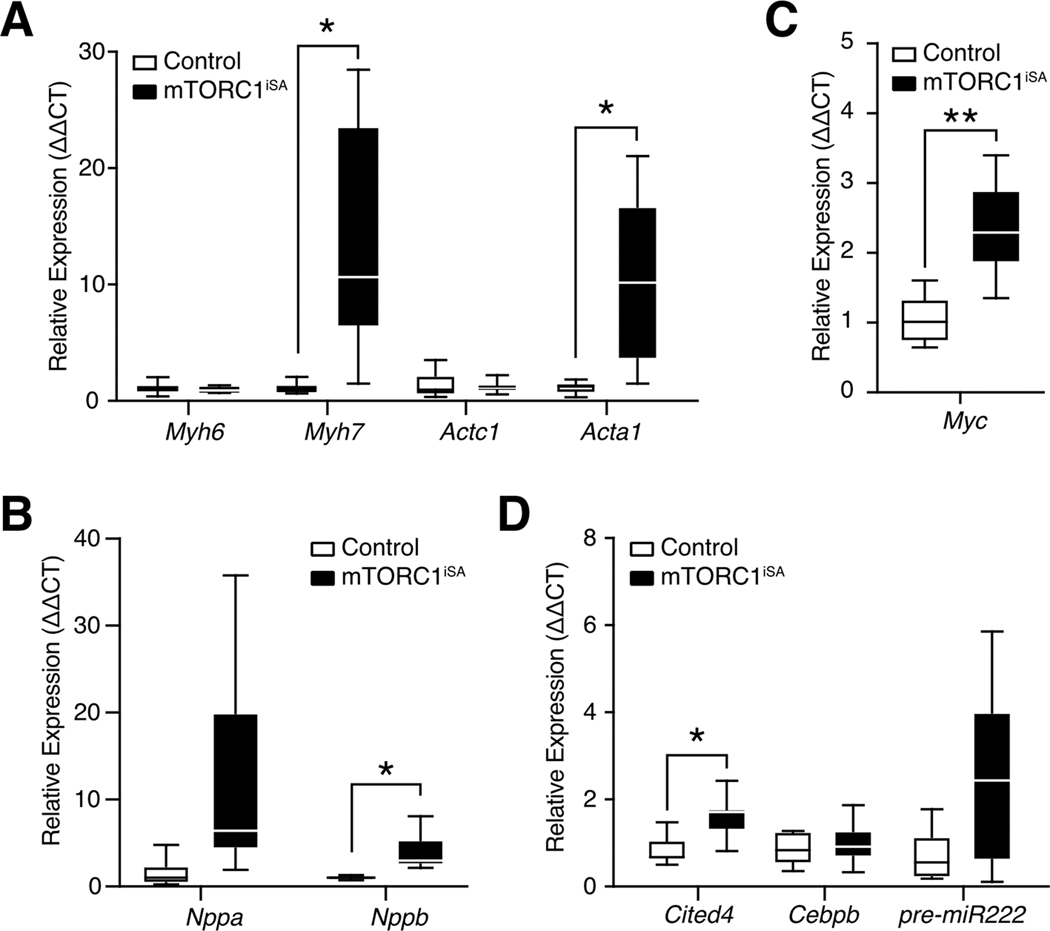
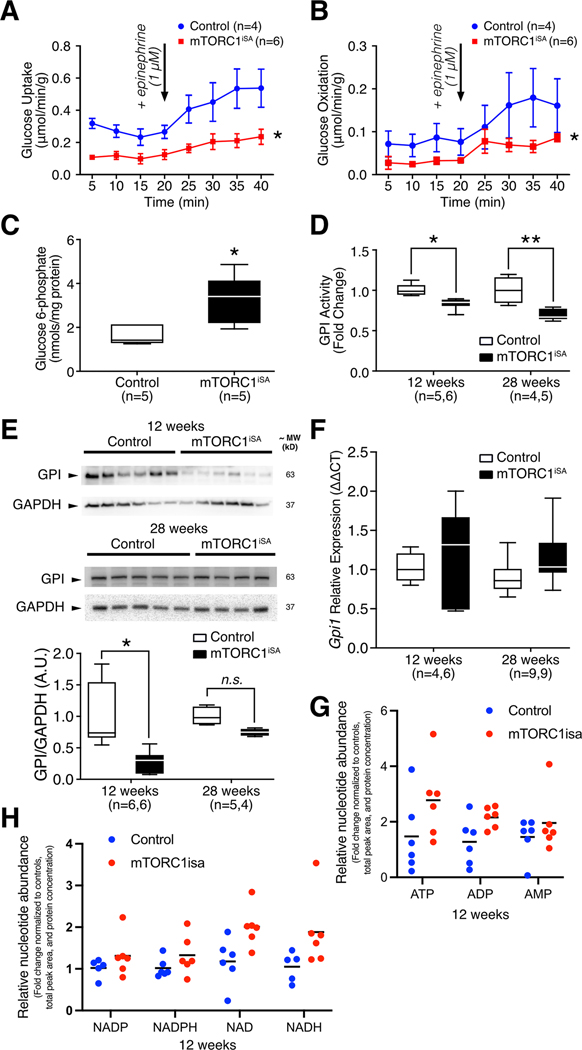
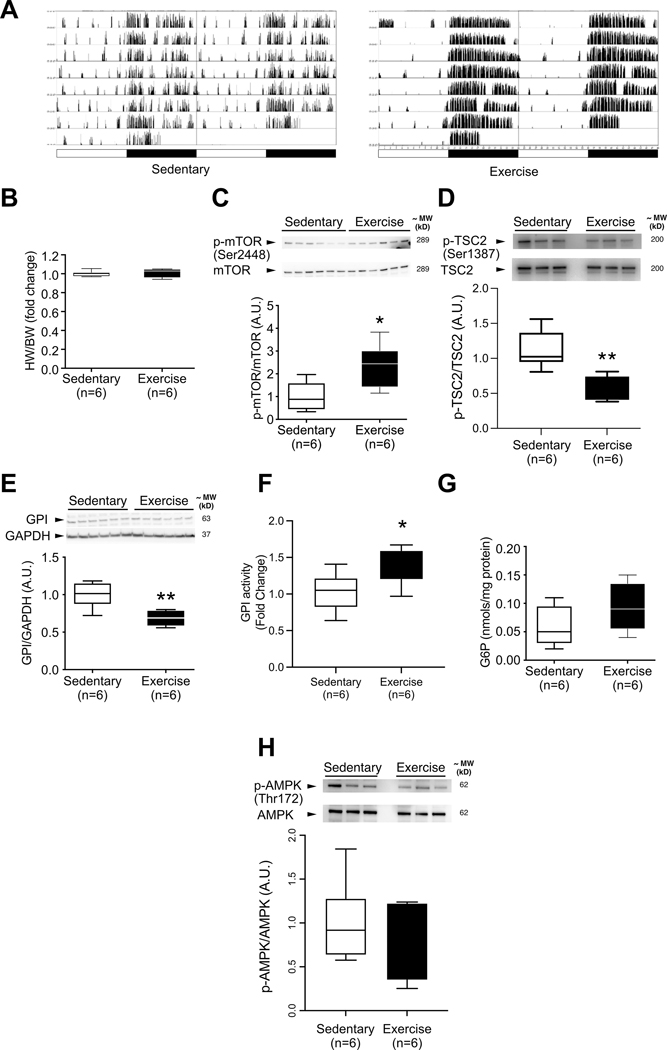
Methods and results: We developed a mouse model of inducible, cardiac-specific sustained mTORC1 activation (mTORC1iSA) through deletion of Tsc2. Prior to hypertrophy, rates of glucose uptake and oxidation, as well as protein and enzymatic activity of glucose 6-phosphate isomerase (GPI) were decreased, while intracellular levels of glucose 6-phosphate (G6P) were increased. Subsequently, hypertrophy developed. Transcript levels of the fetal gene program and pathways of exercise-induced hypertrophy increased, while hypertrophy did not progress to heart failure. We therefore examined the hearts of wild-type mice subjected to voluntary physical activity and observed early changes in GPI, followed by hypertrophy. Rapamycin prevented these changes in both models.

Conclusion: Activation of mTORC1 in the adult heart triggers the development of a non-specific form of hypertrophy which is preceded by changes in cardiac glucose metabolism.

Keywords: Exercise; Glycolysis; Hypertrophy; Metabolism; mTORC1.


Conflict of interest statement

Disclosures

The authors have no conflict of interests to disclose.

Figures

Figure 1.
Figure 1.. TSC2 knockdown produces sustained mTORC1 activation in adult mouse hearts leading to cardiac hypertrophy without increased fibrosis.
(A) Model of sustained mTORC1 activation via Tsc2 knockdown, timeline of Cre-recombinase induction, and timepoints for assessment of metabolic and structural remodeling. (B) TSC2 protein levels in mTORC1iSA mouse hearts at 12 weeks were decreased (n=5 Control and 6 mTORC1iSA mice). (C) mTOR phosphorylation at Ser2448 was increased in mTORC1iSA mouse hearts at 12 weeks (n=5 Control and 6 mTORC1iSA mice). (D) Phosphorylation of p70S6K at Thr389 was increased in mTORC1iSA mouse hearts at 12 weeks (n=5 Control and 6 mTORC1iSA mice). (E) 4EBP-1 was hyperphosphorylated at Thr70 in mTORC1iSA mouse hearts at 12 weeks (n=5 Control and 6 mTORC1iSA mice). (F) Akt phosphorylation at Ser473 was unchanged in mTORC1iSA mouse hearts at 12 weeks (n=5 Control and 6 mTORC1iSA mice). (G) Akt phosphorylation at Ser308 was unchanged in mTORC1iSA mouse hearts at 12 weeks(n=5 Control and 6 mTORC1iSA mice). (H) Cardiomyocyte cross-sectional areas pre-recombination (5 weeks, n=5 Control and 6 mTORC1iSA mice), and post-recombination (12 weeks [n=5 Control and 4 mTORC1iSA mice], and 28 weeks [n=3 Control and 4 mTORC1iSA mice]), with representative H/E at 28 weeks. (I) Heart Weight to Body Weight (HW/BW) ratios from Control and mTORC1iSA mice pre-recombination (5 weeks, n=5 Control and 6 mTORC1iSA mice), and post-recombination (12 weeks [n=9 mice per group], and 28 weeks [n=7 Control and 18 mTORC1iSA mice]). (J). Fibrosis in hearts of Control and mTORC1iSA post-recombination (12 weeks [n=4 Control and 9 mTORC1iSA mice], and 28 weeks [n=4 Control and 9 mTORC1iSA mice]), with representative Masson Trichrome at 28 weeks. Statistical significance was calculated using unpaired two-tailed Student’s t test (B-G), and two-way ANOVA with Bonferroni’s multiple comparisons test (H-J); *p<0.05, **p<0.01.
Figure 2.
Figure 2.. Sustained mTORC1 activation in adult mouse hearts results in transcriptional changes associated with both adaptive and maladaptive hypertrophy.
(A) The fetal isoforms of myosin heavy chain (Myh7) and actin (Acta1) were upregulated at 28 weeks in mTORC1iSA mice (n= 9 mice per group). (B) Brain natriuretic peptide (Nppb) was upregulated at 28 weeks in mTORC1iSA mice (n= 9 mice per group). (C) c-Myc expression was upregulated at 28 weeks in mTORC1iSA mice (n= 9 mice per group). (D) Cited4 was upregulated at 28 weeks in mTORC1iSA mice (n= 9 mice per group). Statistical significance was calculated using unpaired two-tailed Student’s t test with correction for multiple comparisons using the Holm-Sidak method; *p<0.05, **p<0.01. Myh6, myosin heavy chain α; Myh7, myosin heavy chain β; Actc1, cardiac α-actin; Acta1, skeletal α-actin; Cited4, Cbp/p300 interacting transactivator 4; Cebpb, CCAAT/enhancer-binding protein β; miR222, pre-miRNA 222; Myc, c-Myc; Nppa, atrial natriuretic protein; Nppb, brain natriuretic protein.
Figure 3.
Figure 3.. Sustained mTORC1 activation in adult mouse hearts induces metabolic remodeling in mTORC1iSA mice at 12 weeks.
(A) Rates of glucose uptake and (B) glucose oxidation were decreased in retrogradely perfused mTORC1iSA mouse hearts at 12 weeks (n= 4 Control and 6 mTORC1iSA mice). (C) G6P metabolite levels were elevated in the heart muscle of mTORC1iSA mice at 12 weeks (n=5 mice per group). (D) GPI activity is depressed at 12 weeks (n= 5 Control and 6 mTORC1iSA mice) in mTORC1iSA and this decrease is sustained through 28 weeks (n= 4 Control and 6 mTORC1iSA mice). (E) GPI protein levels measured in mTORC1iSA mouse hearts at 12 weeks (n=6 mice per group) were decreased and this decrease is attenuated at 28 weeks (n= 5 Control and 4 mTORC1iSA mice). (F) There was no change in the transcription of GPI at either 12 weeks (n= 4 Control and 6 mTORC1iSA mice) or 28 weeks (n=9 mice per group). (G and H) Levels of ATP, ADP, and AMP, as well as Nicotinamide adenine dinucleotides were similar in mTORC1iSA than in control mouse hearts at 12 weeks (n=6 mice per group). Nucleotide abundance is expressed as fold-change from control, and was normalized by total peak area and protein concentration. Statistical significance was calculated using two-way ANOVA (A and B), unpaired two-tailed Student’s t test (C), two-way ANOVA with Bonferroni’s multiple comparisons test (D and F), unpaired two-tailed Student’s t test with correction for multiple comparisons using a FDR of 0.1 (G-H); *p<0.05, **p<0.01.
Figure 4.
Figure 4.. GPI protein levels are decreased in parallel with increased mTOR phosphorylation during acute exercise after six days of voluntary exercise training.
(A) Representative home cage circadian activity of sedentary and voluntarily exercising C57BL6/J mice, as measured by infrared motion detector (left columns) and wheel runner reed switches (right columns). (B) Heart weight to body weight ratio does not differ between groups after 6 days of voluntary exercise (n=6 mice per group). (C) mTOR phosphorylation at Ser2448 is increased in voluntarily exercised C57BL6/J mice (n=6 mice per group). (D) TSC2 phosphorylation at Ser1387 is decreased in voluntarily exercised C57BL6/J mice (n=6 mice per group). (E) GPI protein levels are decreased in the hearts of voluntarily exercised C57BL6/J mice (n=6 mice per group). (F) GPI activity is increased in the hearts of voluntarily exercised C57BL6/J mice (n=6 mice per group) (G) G6P levels in the hearts of voluntarily exercised mice are not significantly increased (n=6 mice per group). (H) AMPK phosphorylation at Thr172 is unchanged in voluntarily exercised C57BL6/J mice (n=6 mice per group). Statistical significance was calculated using unpaired two-tailed Student’s t test; *p<0.05, ** p<0.01.
Figure 5.
Figure 5.. Rapamycin treatment prevents metabolic and structural remodeling observed in both mTORC1iSA and exercise models.
(A) Model of sustained mTORC1 activation via Tsc2 knockdown, timeline of treatment with rapamycin prior to metabolic and structural remodeling. The increases in cardiomyocyte area (B) and HW/BW ratio (C) seen in mTORC1iSA mice at 28 weeks were prevented when fed a diet containing rapamycin for 8 weeks (n=3 and 7 Control mice in B and C, respectively, 7 mTORC1iSA mice treated with vehicle and 10 mTORC1iSA treated with rapamycin). (D) Two weeks of rapamycin in the diet prevented the decrease of GPI protein levels seen in hearts of mTORC1iSA mice at 12 weeks (n=6 Vehicle treated and 4 rapamycin treated mice). (E) Rapamycin in the diet during the six days exercise protocol prevevents GPI activity increase in hearts of voluntarily exercised C57BL6/J mice (n=4 mice per group). (F) After 6 weeks of voluntary exercise, HW/BW ratio increases in C57BL/6 mice similar to the HW/BW increase seen in mTORC1iSA mice, and rapamycin diet during this 6 week period prevented this increase (n=6 mice per group). (G) After 6 weeks of voluntary exercise, GPI protein levels in hearts of C57BL/6 mice were unchanged. Rapamycin, diet during this 6 week period did not cause further changes in GPI (n=6 mice per group). (F) After 6 weeks of voluntary exercise, GPI activity increases in C57BL/6 mice similar and rapamycin diet during this 6 week period prevented this increase (n=6 mice per group). (I) After 6 weeks of voluntary exercise, ATP levels were increased in hearts of C57BL/6 mice, and rapamycin diet during this 6 week period prevented this increase, (n=6 mice per group). Statistical significance was calculated using one-way ANOVA with Tukey’s multiple comparisons test (B, C, F-H), unpaired two-tailed Student’s t test (D-E), and one-way ANOVA with Tukey’s multiple comparisons test using a FDR of 0.1 (I), (*p < 0.05 orFDR < 0.1, ** p < 0.01, *** p < 0.001)

References

    1. Meerson FZ, Kapelko VI, The contractile function of the myocardium in two types of cardiac adaptation to a chronic load, Cardiology 57(4) (1972) 183–99. - PubMed
    1. Hill JA, Olson EN, Cardiac plasticity, N Engl J Med 358(13) (2008) 1370–80. - PubMed
    1. Fulghum K, Hill BG, Metabolic Mechanisms of Exercise-Induced Cardiac Remodeling, Frontiers in Cardiovascular Medicine 5(127) (2018). - PMC - PubMed
    1. van Bilsen M, van Nieuwenhoven FA, van der Vusse GJ, Metabolic remodelling of the failing heart: beneficial or detrimental?, Cardiovasc Res 81(3) (2009) 420–8. - PubMed
    1. Saxton RA, Sabatini DM, mTOR Signaling in Growth, Metabolism, and Disease, Cell 169(2) (2017) 361–371. - PubMed

Publication types

MeSH terms