. 2021 Jul;595(7869):718-723.
doi: 10.1038/s41586-021-03673-2. Epub 2021 Jun 3.

Nasal delivery of an IgM offers broad protection from SARS-CoV-2 variants

Affiliations

Nasal delivery of an IgM offers broad protection from SARS-CoV-2 variants

Zhiqiang Ku et al. Nature. 2021 Jul.

Abstract

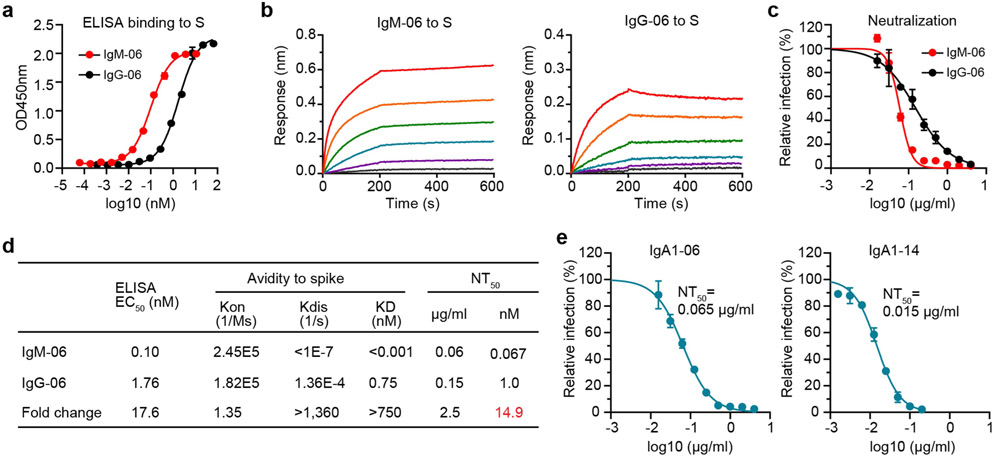
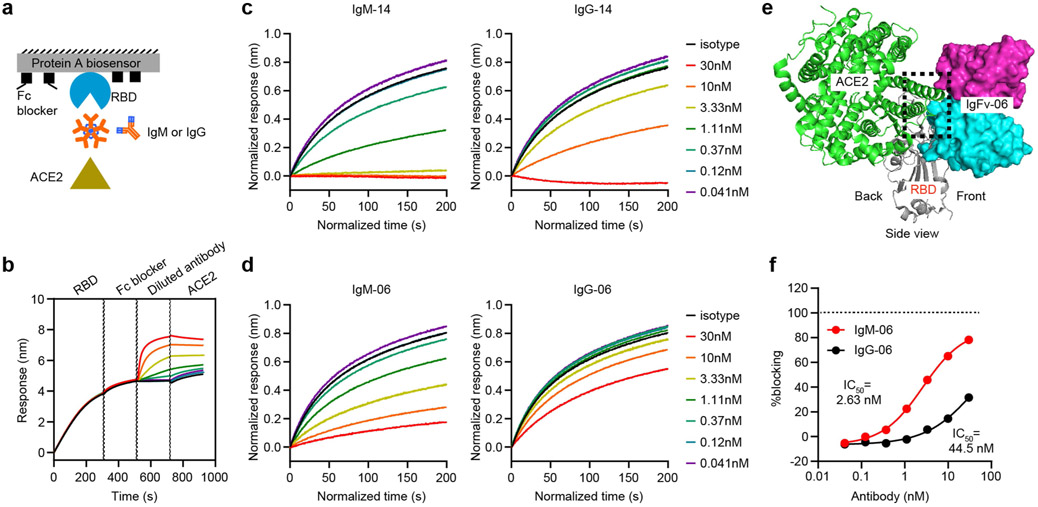
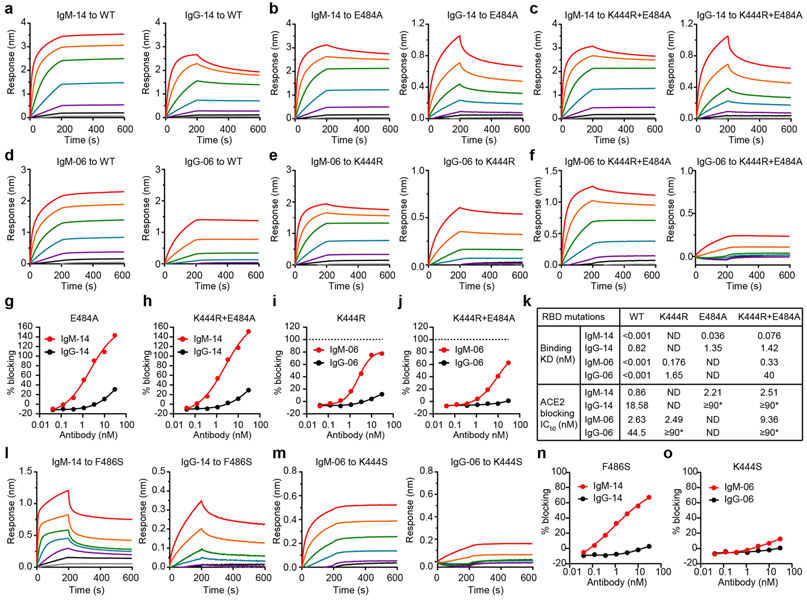
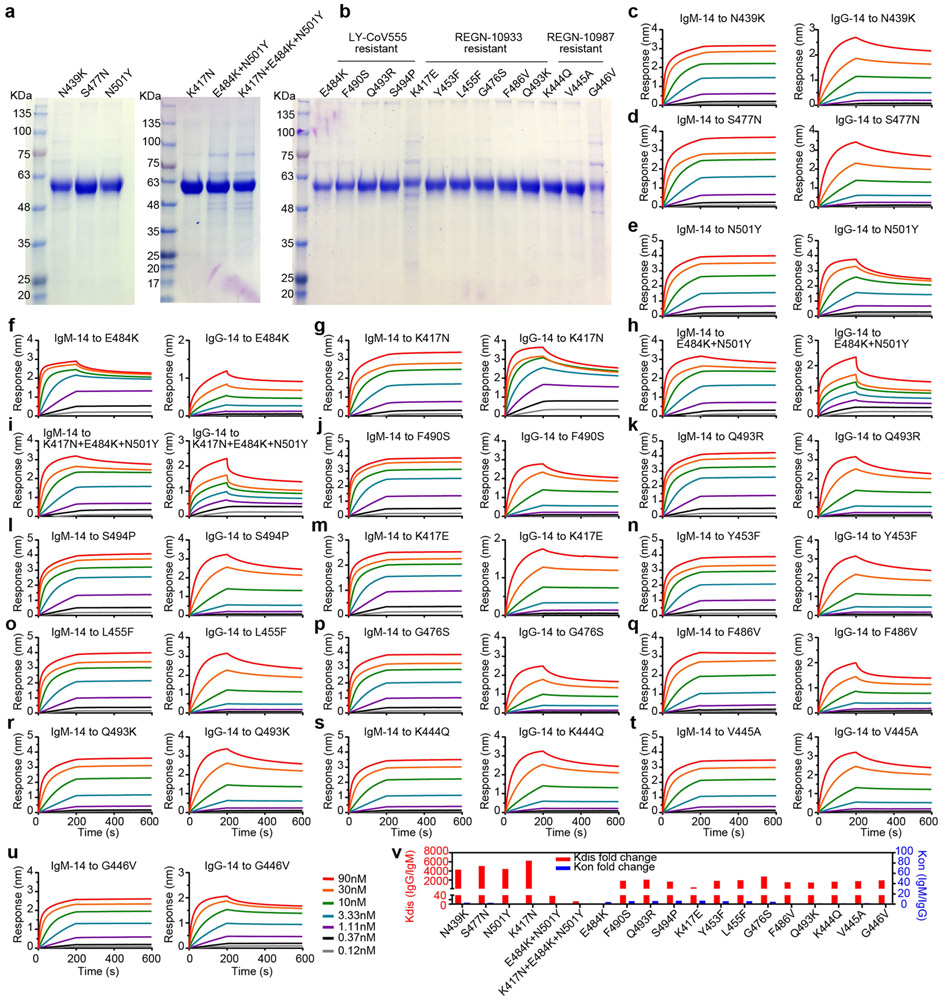
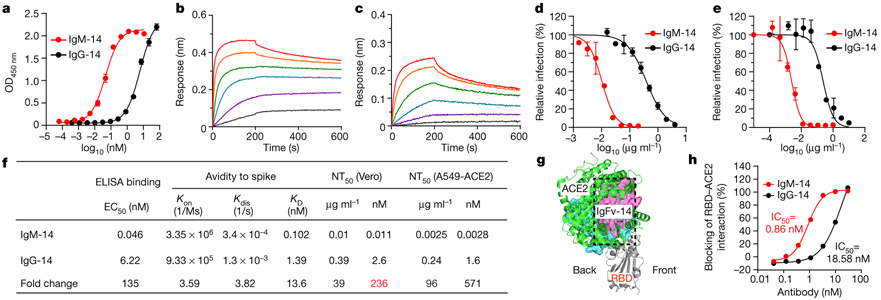
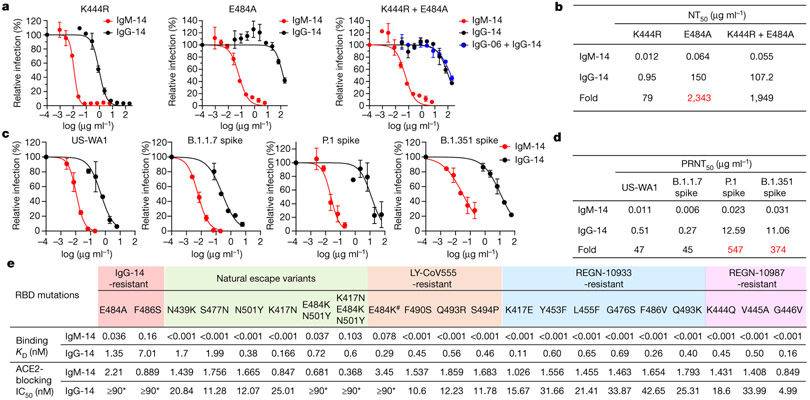
Resistance represents a major challenge for antibody-based therapy for COVID-191-4. Here we engineered an immunoglobulin M (IgM) neutralizing antibody (IgM-14) to overcome the resistance encountered by immunoglobulin G (IgG)-based therapeutics. IgM-14 is over 230-fold more potent than its parental IgG-14 in neutralizing SARS-CoV-2. IgM-14 potently neutralizes the resistant virus raised by its corresponding IgG-14, three variants of concern-B.1.1.7 (Alpha, which first emerged in the UK), P.1 (Gamma, which first emerged in Brazil) and B.1.351 (Beta, which first emerged in South Africa)-and 21 other receptor-binding domain mutants, many of which are resistant to the IgG antibodies that have been authorized for emergency use. Although engineering IgG into IgM enhances antibody potency in general, selection of an optimal epitope is critical for identifying the most effective IgM that can overcome resistance. In mice, a single intranasal dose of IgM-14 at 0.044 mg per kg body weight confers prophylactic efficacy and a single dose at 0.4 mg per kg confers therapeutic efficacy against SARS-CoV-2. IgM-14, but not IgG-14, also confers potent therapeutic protection against the P.1 and B.1.351 variants. IgM-14 exhibits desirable pharmacokinetics and safety profiles when administered intranasally in rodents. Our results show that intranasal administration of an engineered IgM can improve efficacy, reduce resistance and simplify the prophylactic and therapeutic treatment of COVID-19.


Figures

Extended Data Fig. 1 ∣
Extended Data Fig. 1 ∣. The epitopes of IgG1 monoclonal antibodies used for engineering and additional characterizations of IgM and IgA1.
a, The RBD is shown as a cartoon with the core region coloured in grey and the receptor-binding motif (RBM) coloured in red. b, Summary of the binding region on the RBD, key epitope residues and cross-reactivity to SARS-CoV of the six monoclonal antibodies. These epitope residues were mapped using an alanine-scanning RBD mutant library in a previous study. c, ELISA binding to RBD by IgG1, IgA1 and IgM isotypes of the indicated monoclonal antibodies. Data are mean of duplicate wells. d, Neutralization of live SARS-CoV-2 by IgG1, IgA1 and IgM monoclonal antibodies at 1 μg ml−1. Data are mean ± s.d. of triplicates.
Extended Data Fig. 2 ∣
Extended Data Fig. 2 ∣. Binding and neutralization characterizations of IgM-06, IgG-06, IgA1-06 and IgA1-14.
a, ELISA binding to the spike protein (S) by IgM-06 and IgG-06. Data are mean of duplicate wells. b, Binding kinetics of IgM-06 and IgG-06 to the spike protein. c, Neutralization of SARS-CoV-2 by IgM-06 and IgG-06. Data are mean of duplicate wells. d, Summary of binding EC50, association (Kon), dissociation (Kdis), avidity (KD) and neutralization NT50 values of IgM-06 and IgG-06. e, Neutralization of SARS-CoV-2 by IgA1-06 and IgA1-14. Data are mean of duplicate wells.
Extended Data Fig. 3 ∣
Extended Data Fig. 3 ∣. Structural docking of the Fv–RBD complex.
a, b, Docking of IgFv-14–RBD (a) and IgFv-06–RBD (b) complex structures. The RBD is shown as a cartoon and coloured in grey. The Fv is shown as a surface with Vh coloured in cyan and Vl coloured in magenta. Antibody epitope residues are shown as sticks and coloured in blue.
Extended Data Fig. 4 ∣
Extended Data Fig. 4 ∣. Antibody blocking of RBD and ACE2 interaction as measured by a BLI assay.
a, Schematic diagram showing a BLI assay for IgM and IgG blocking of RBD and ACE2 interaction. b, A representative binding response curve of the BLI assay. The vertical dashed lines indicate the separation of each binding phase. c, d, The normalized ACE2 response curves after blocking by IgM-14 and IgG-14 (c) and by IgM-06 and IgG-06 (d). e, Superposition of IgFv-06–RBD and ACE2–RBD complexes. The IgFv-06 is shown as a surface with Vh coloured in cyan and Vl coloured in magenta. The RBD–ACE2 complex is shown as a cartoon with RBD coloured in grey and ACE2 coloured in green. The dashed box indicates steric clash. f, IgM-06 and IgG-06 blocking of RBD and ACE2 interaction. The horizontal dashed line indicates 100% blocking.
Extended Data Fig. 5 ∣
Extended Data Fig. 5 ∣. Construction of SARS-CoV-2 escaping variants and additional neutralization characterizations.
a, Schematic diagram showing the construction of the indicated mNeonGreen SARS-CoV-2 viruses using an infectious clone method. b, Plaque morphologies of mNeonGreen SARS-CoV-2 viruses with wild-type RBD or the indicated RBD mutations. c, Neutralization of SARS-CoV-2 viruses with K444R (IgG-06-resistant), E484A (IgG-14-resistant) and K444R + E484A (IgG-06 + IgG-14-resistant) mutations by IgM-14 and IgG-14 on A549-ACE2 cells. Data are mean of duplicate wells. d, Summary of the NT50 values against indicated mutant viruses and the fold changes of NT50 values between IgM-14 and IgG-14. e, Neutralization of indicated SARS-CoV-2 mutant viruses by IgM-06 and IgG-06 on Vero cells. Data are mean of duplicate wells. f, Summary of the NT50 values against indicated mutant viruses and the fold changes of NT50 values between IgM-06 and IgG-06. NA, not available.
Extended Data Fig. 6 ∣
Extended Data Fig. 6 ∣. Binding kinetics and ACE2-blocking activities of IgM-14, IgG-14, IgM-06 and IgG-06 against selected RBD mutants.
a–c, The binding kinetics of IgM-14 and IgG-14 to wild-type RBD (a), E484A RBD (b) and K444R + E484A RBD (c). d–f, The binding kinetics of IgM-06 and IgG-06 to wild-type RBD (d), K444R RBD (e) and K444R+E484A RBD (f). g, h, IgM-14 and IgG-14 blocking of E484A RBD (g) and K444R + E484A RBD (h) interaction with ACE2. i, j, IgM-06 and IgG-06 blocking of K444R RBD (i) and K444R + E484A RBD (j) interaction with ACE2. k, Summary of the binding avidities (KD) and ACE2-blocking activities (IC50) to indicated RBD proteins by IgM-06 and IgG-06. ND, not determined. *Half-maximal blocking was not achieved at the highest monoclonal antibody concentration (30 nM) and the IC50 values are defined as ≥90 nM. l, m, The binding kinetics of IgM-14 and IgG-14 to F486S RBD (l) and IgM-06 and IgG-06 to K444S RBD (m). n, o, IgM-14 and IgG-14 blocking of F486S RBD interaction with ACE2 (n) and IgM-06 and IgG-06 blocking of K444S RBD interaction with ACE2 (o).
Extended Data Fig. 7 ∣
Extended Data Fig. 7 ∣. Binding kinetics of IgM-14 and IgG-14 to the 19 RBD mutants.
a, SDS–PAGE images of six RBD proteins with mutations that represent natural escape variants in circulation. b, SDS–PAGE image of thirteen RBD proteins with mutations associated with neutralization-resistance to LY-CoV555, REGN-10933 and REGN-10987. The SDS–PAGE gel images were from one experiment. c–u, Binding kinetics of IgM-14 (left) and IgG-14 (right) to the indicated RBD mutants. v, Fold changes of Kdis and Kon between binding of IgM-14 and IgG-14 to the 19 RBD mutants. The ratios were calculated as indicated in the y axis.
Extended Data Fig. 8 ∣
Extended Data Fig. 8 ∣. Antibody blocking of interactions between ACE2 and the 19 RBD mutants, the frequency of RBD mutations and mutational effects on RBD functionality.
a–s, The dose-dependent blocking of the interactions between ACE2 and the indicated RBD mutants. t, The correlation between ACE2 blocking IC50 and neutralization NT50 values. Two-tailed Spearman correlation was used in the statistical analysis. u, The frequency of SARS-CoV-2 circulating variants with indicated RBD mutations. The Tracking Mutations tool was used for analysis as described in the methods. v, The effects of indicated RBD mutations on RBD binding affinity to ACE2 and RBD protein expression. The online web source on the sequence-to-phenotype maps of the RBD of SARS-CoV-2 (https://jbloomlab.github.io/SARS-CoV-2-RBD_DMS/) was referred to for analysis. The y axis indicates log10 scale changes to wild-type RBD. Positive values indicate an improving effect and negative values indicate a decreasing effect by the mutations.
Extended Data Fig. 9 ∣
Extended Data Fig. 9 ∣. Bio-distribution of AF750-labelled IgM-14 after intransal delivery in mice.
a, Whole-body imaging of four mice at different time points after a single intranasal dose of IgM-14. b, Ex vivo imaging of blood (20 μl and different organs. c, Quantification of average radiant efficiency of blood and indicated organs. Data are mean ± s.d. of four independent mice.
Extended Data Fig. 10 ∣
Extended Data Fig. 10 ∣. Additional in vivo characterizations of antibody efficacy, pharmacokinetics and safety.
a, Experimental design of prophylactic evaluation of the indicated monoclonal antibodies. n = 4 independent mice for all groups. b, Virus PFU titres in the lung samples of mice prophylactically treated with the indicated monoclonal antibodies. c, Virus RNA (N gene) titres in the lung samples of mice prophylactically treated with IgM-14. The cut-off for the qRT–PCR method, shown as dotted line, is defined as mean + 2 standard deviations of corresponding RNA copies in the qRT–PCR using lung samples from five uninfected mice. d, Viral loads (PFU titres) in the lung samples of mice therapeutically treated with IgM-14 or IgG-14 at the indicated doses. The lines of median lung viral loads are shown for each group. n = 10 biologically independent mice for all groups except that n = 5 for IgM-14 group. A two-sided Mann–Whitney test was used in the statistical analysis for b, d. An ordinary one-way ANOVA with Sidak’s multiple comparisons was used in the statistical analysis for c. e, Sequencing analysis of viruses recovered from lung samples of the ten most outlier mice. A representative chromatogram representing the amino acids 483–489 of the RBD is shown to indicate that no mutations of the critical residues E484 and F486 were observed. f, The plasma concentrations of IgM-14 after a single intranasal dose of 5 mg kg−1 in BALB/c mice. Data are mean ± s.d. of three independent mice.The values lower than LLOQ (0.02 μg ml−1) were defined as 0.01. g, Body weight changes of rats after intranasal administrations of 2 mg kg−1 per dose of IgM-14 or the vehicle control. Data are mean ± s.d. of four independent rats. The arrows indicate dosing twice daily for five consecutive days. Statistical differences between IgM-14 and vehicle groups were analysed by a two-sided multiple t-test. ns, P ≥ 0.05.
Fig. 1 ∣
Fig. 1 ∣. Engineering of IgM and IgA1 neutralizing monoclonal antibodies.
a, The IgG1 epitope residues are shown as spheres on the RBD. b, Illustration of antibody engineering from IgG1 into IgM and IgA1. c, d, SDS–PAGE (left) and native PAGE (right) (c) and size-exclusion chromatography (d) analysis showing monoclonal antibody assembly and purity. The gel images were from one experiment. HC, heavy chain; LC, light chain. e, ELISA binding to the RBD by the indicated isotypes of CoV2-14. Data are mean of duplicate wells. f, Antibody valency versus EC50 for the indicated isotypes. g, Neutralization of SARS-CoV-2 by the indicated monoclonal antibodies at 0.1 μg ml−1. Data are mean ± s.d. of triplicates. h, The EC50 and per cent neutralization of the three isotypes for CoV2-06 and CoV2-14 are plotted to illustrate different correlation patterns between binding and neutralization.
Fig. 2 ∣
Fig. 2 ∣. Enhanced binding, neutralization and ACE2-blocking by IgM-14 over IgG-14.
a, ELISA for binding to the spike protein. Data are mean of duplicate wells. OD450 nm, optical density at 450 nm. b, c, Binding kinetics of IgM-14 (b) and IgG-14 (c) to the spike protein. d, e, Neutralization of SARS-CoV-2 in Vero (d) and A549-ACE2 (e) cells. Data are mean of duplicate wells. f, Summary of binding EC50, association (Kon), dissociation (Kdis), avidity (KD) and neutralization NT50 values. The fold change of NT50 values between IgM-14 and IgG-14 is highlighted in red. g, Superposition of the IgFv-14–RBD and ACE2–RBD complexes. IgFv-14 is shown as a surface with the variable heavy chain (Vh) coloured in cyan and the variable light chain (Vl) in magenta. The RBD–ACE2 complex is shown as a cartoon with the RBD coloured in grey and ACE2 in green. The dashed box indicates steric clash. h, Blocking of RBD and ACE2 interaction. Data for each antibody concentration are from one biosensor.
Fig. 3 ∣
Fig. 3 ∣. Broader coverage of escape variants by IgM-14 over IgG-14.
a, Neutralization of the K444R (IgG-06-resistant), E484A (IgG-14-resistant) and K444R + E484A (IgG-06 + IgG-14-resistant) SARS-CoV-2 variants. b, Summary of NT50 values against the indicated SARS-CoV-2 variants. c, PRNT assay using the US-WA1 strain and the recombinant B.1.1.7, P.1 and B.1.351 variants. d, Summary of PRNT50 values against the indicated viruses. Data are mean of duplicate wells for a, c. The fold changes in NT50 and PRNT50 values between IgM-14 and IgG-14 against the indicated resistant viruses are highlighted in red. e, Summary of binding KD and ACE2-blocking IC50 values to a panel of 21 RBD mutants. The hash symbol indicates that E484K is an escape mutation for both LY-CoV555 and REGN-10933. Asterisks indicate that the half-maximal blocking was not achieved at the highest monoclonal antibody concentration (30 nM) and the IC50 values are defined as ≥90 nM.
Fig. 4 ∣
Fig. 4 ∣. Intranasally delivered IgM-14 confers protection against SARS-CoV-2 VOCs.
a, Experimental design for the evaluation of antibody bio-distribution. b, Representative whole-body images. c, Representative ex vivo images. Bl, blood (20 μl); Br, brain; H, heart; K, kidney; Lu, lung; Lv, liver; N, nasal cavity; S, spleen. d, Quantification of fluorescence signals. Data are mean ± s.d. of four mice. Dashed line shows the average autofluorescence of organs. e, Experimental design of dose-range evaluations of IgM-14 against a mouse-adapted SARS-CoV-2 (CMA4 strain). For prophylactic treatment, IgM-14 was evaluated at two sets of dose ranges to determine the minimal effective dose. f, g, Viral loads in the lungs of CMA4-infected mice after prophylactic (f) or therapeutic (g) treatment with IgM-14. n = 10 biologically independent mice for all groups, except for the 1.2 mg kg−1 group in g (n = 15). h, i, Viral loads in the lungs of mice infected with the P.1 (h) and B.1.351 (i) variant, after therapeutic treatment as indicated. n = 5 biologically independent mice for all groups. The solid lines in f–i indicate median viral loads in the lung. An ordinary one-way ANOVA with Sidak’s multiple comparisons was used in the statistical analysis for f, g. A two-sided Mann–Whitney test was used in the statistical analysis for h, i.

References

    1. Ku Z et al. Molecular determinants and mechanism for antibody cocktail preventing SARS-CoV-2 escape. Nat. Commun 12, 469 (2021). - PMC - PubMed
    1. Wibmer CK et al. SARS-CoV-2 501Y.V2 escapes neutralization by South African COVID-19 donor plasma. Nat. Med 27, 622–625 (2021). - PubMed
    1. Wang P et al. Antibody resistance of SARS-CoV-2 variants B.1.351 and B.1.1.7. Nature 593, 130–135 (2021). - PubMed
    1. Starr TN et al. Prospective mapping of viral mutations that escape antibodies used to treat COVID-19. Science 371, 850–854 (2021). - PMC - PubMed
    1. Wölfel R et al. Virological assessment of hospitalized patients with COVID-2019. Nature 581, 465–469 (2020). - PubMed

Publication types

MeSH terms