

Lactobacillus rhamnosus GG modifies the metabolome of pathobionts in gnotobiotic mice
- PMID: 34082713
- PMCID: PMC8176599
- DOI: 10.1186/s12866-021-02178-2
Lactobacillus rhamnosus GG modifies the metabolome of pathobionts in gnotobiotic mice
Abstract
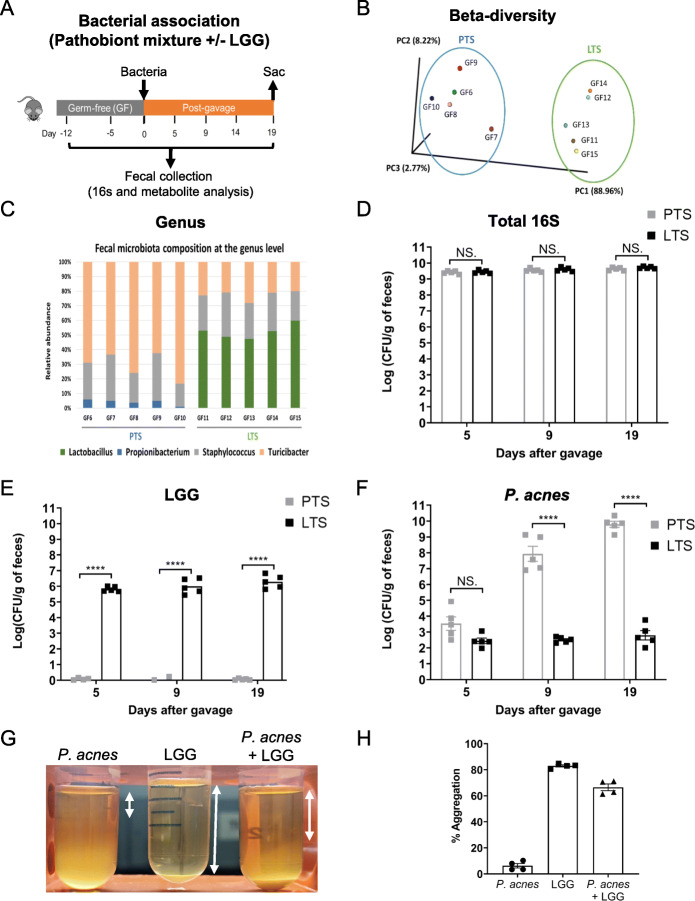
Background: Lactobacillus rhamnosus GG (LGG) is the most widely used probiotic, but the mechanisms underlying its beneficial effects remain unresolved. Previous studies typically inoculated LGG in hosts with established gut microbiota, limiting the understanding of specific impacts of LGG on host due to numerous interactions among LGG, commensal microbes, and the host. There has been a scarcity of studies that used gnotobiotic animals to elucidate LGG-host interaction, in particular for gaining specific insights about how it modifies the metabolome. To evaluate whether LGG affects the metabolite output of pathobionts, we inoculated with LGG gnotobiotic mice containing Propionibacterium acnes, Turicibacter sanguinis, and Staphylococcus aureus (PTS).
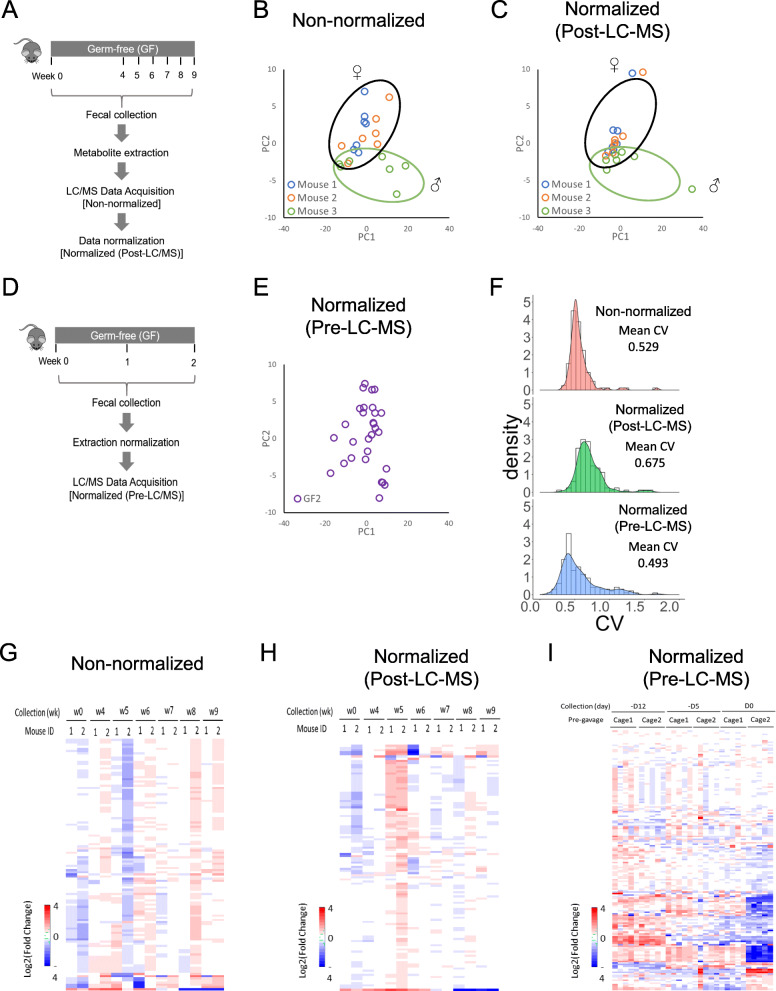
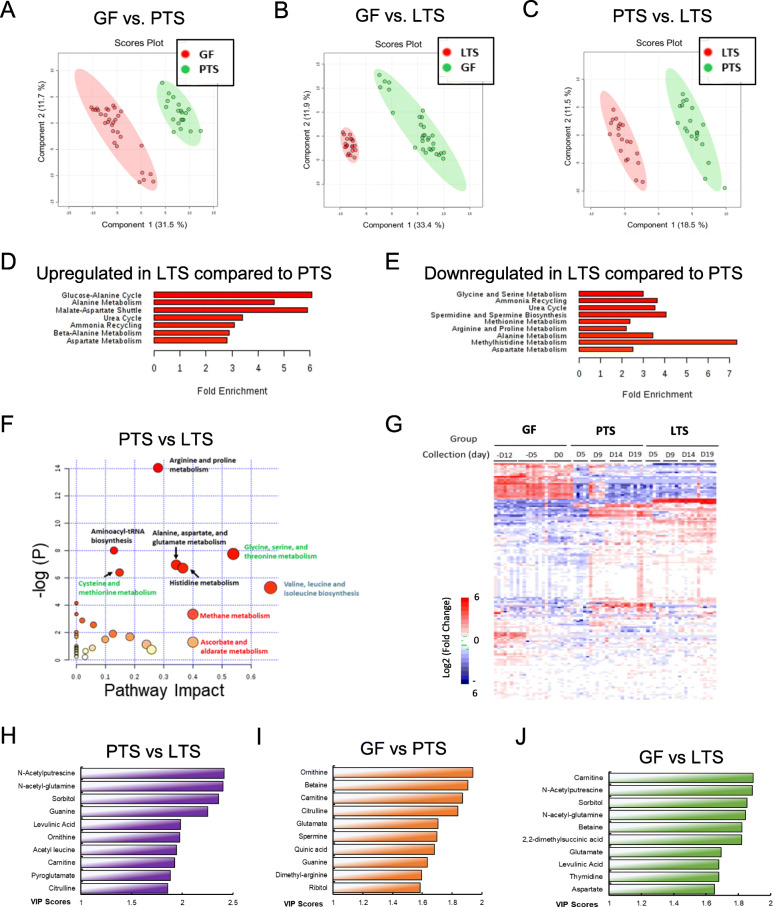
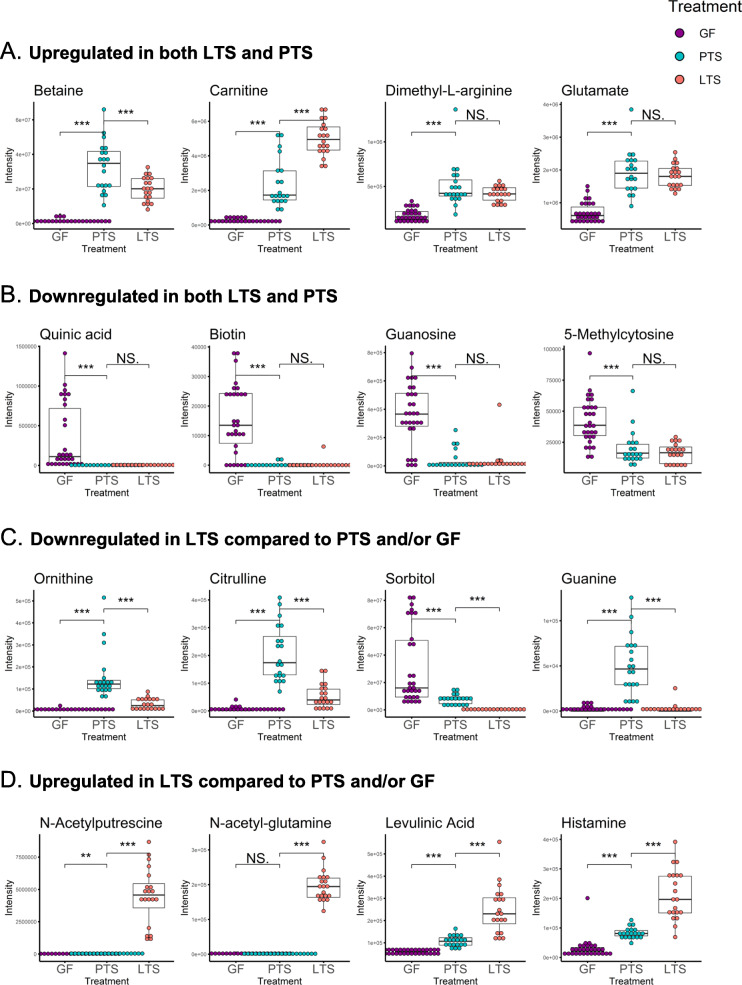
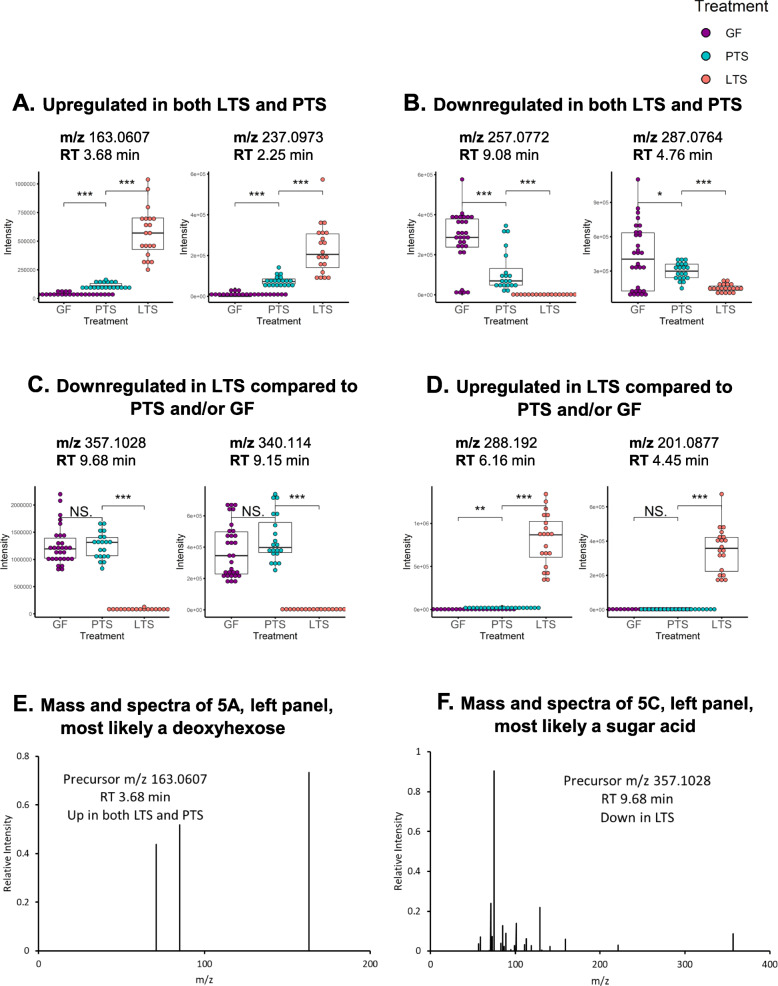
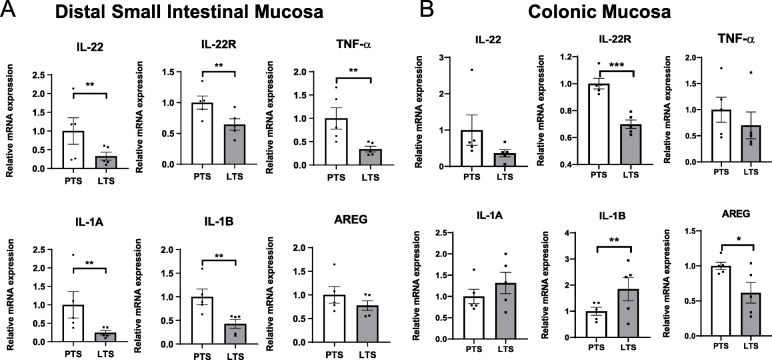
Results: 16S rRNA sequencing of fecal samples by Ion Torrent and MinION platforms showed colonization of germ-free mice by PTS or by PTS plus LGG (LTS). Although the body weights and feeding rates of mice remained similar between PTS and LTS groups, co-associating LGG with PTS led to a pronounced reduction in abundance of P. acnes in the gut. Addition of LGG or its secretome inhibited P. acnes growth in culture. After optimizing procedures for fecal metabolite extraction and metabolomic liquid chromatography-mass spectrometry analysis, unsupervised and supervised multivariate analyses revealed a distinct separation among fecal metabolites of PTS, LTS, and germ-free groups. Variables-important-in-projection scores showed that LGG colonization robustly diminished guanine, ornitihine, and sorbitol while significantly elevating acetylated amino acids, ribitol, indolelactic acid, and histamine. In addition, carnitine, betaine, and glutamate increased while thymidine, quinic acid and biotin were reduced in both PTS and LTS groups. Furthermore, LGG association reduced intestinal mucosal expression levels of inflammatory cytokines, such as IL-1α, IL-1β and TNF-α.
Conclusions: LGG co-association had a negative impact on colonization of P. acnes, and markedly altered the metabolic output and inflammatory response elicited by pathobionts.
Keywords: Competitive exclusion; Fecal metabolites; Germ-free mice; Inflammation; Liquid chromatography, mass spectrometry; Microbiota; Propionibacterium acnes.
Conflict of interest statement
All authors declare that they have no competing interests.
Figures
Similar articles
-
Lactobacillus rhamnosus GG modulates innate signaling pathway and cytokine responses to rotavirus vaccine in intestinal mononuclear cells of gnotobiotic pigs transplanted with human gut microbiota.BMC Microbiol. 2016 Jun 14;16(1):109. doi: 10.1186/s12866-016-0727-2. BMC Microbiol. 2016. PMID: 27301272 Free PMC article.
-
Probiotic Lactobacillus rhamnosus GG reduces mortality of septic mice by modulating gut microbiota composition and metabolic profiles.Nutrition. 2020 Oct;78:110863. doi: 10.1016/j.nut.2020.110863. Epub 2020 May 17. Nutrition. 2020. PMID: 32593948
-
Lactobacillus rhamnosus GG Derived Extracellular Vesicles Modulate Gut Microbiota and Attenuate Inflammatory in DSS-Induced Colitis Mice.Nutrients. 2021 Sep 23;13(10):3319. doi: 10.3390/nu13103319. Nutrients. 2021. PMID: 34684320 Free PMC article.
-
Mechanism of action of gut microbiota and probiotic Lactobacillus rhamnosus GG on skeletal remodeling in mice.Endocrinol Diabetes Metab. 2024 Jan;7(1):e440. doi: 10.1002/edm2.440. Epub 2023 Jul 28. Endocrinol Diabetes Metab. 2024. PMID: 37505196 Free PMC article. Review.
-
Thirty Years of Lactobacillus rhamnosus GG: A Review.J Clin Gastroenterol. 2019 Mar;53 Suppl 1:S1-S41. doi: 10.1097/MCG.0000000000001170. J Clin Gastroenterol. 2019. PMID: 30741841 Review.
Cited by
-
Alterations and correlations of gut microbiota, fecal, and serum metabolome characteristics in a rat model of alcohol use disorder.Front Microbiol. 2023 Jan 4;13:1068825. doi: 10.3389/fmicb.2022.1068825. eCollection 2022. Front Microbiol. 2023. PMID: 36687619 Free PMC article.
-
Exopolysaccharides of Lactobacillus rhamnosus GG ameliorate Salmonella typhimurium-induced intestinal inflammation via the TLR4/NF-κB/MAPK pathway.J Anim Sci Biotechnol. 2023 Mar 6;14(1):23. doi: 10.1186/s40104-023-00830-7. J Anim Sci Biotechnol. 2023. PMID: 36872332 Free PMC article.
-
Lacticaseibacillus rhamnosus GG-driven remodeling of arginine metabolism mitigates gut barrier dysfunction.Am J Physiol Gastrointest Liver Physiol. 2025 Jul 1;329(1):G162-G185. doi: 10.1152/ajpgi.00366.2024. Epub 2025 May 26. Am J Physiol Gastrointest Liver Physiol. 2025. PMID: 40418622 Free PMC article.
-
Association between gut microbiome-related metabolites and symptomatic hand osteoarthritis in two independent cohorts.EBioMedicine. 2023 Dec;98:104892. doi: 10.1016/j.ebiom.2023.104892. Epub 2023 Nov 24. EBioMedicine. 2023. PMID: 38006743 Free PMC article.
-
Effects of Milk Replacer-Based Lactobacillus on Growth and Gut Development of Yaks' Calves: a Gut Microbiome and Metabolic Study.Microbiol Spectr. 2022 Aug 31;10(4):e0115522. doi: 10.1128/spectrum.01155-22. Epub 2022 Jun 30. Microbiol Spectr. 2022. PMID: 35771011 Free PMC article.
References
Publication types
MeSH terms
Substances
Supplementary concepts
Grants and funding
LinkOut - more resources
Full Text Sources
Molecular Biology Databases
