. 2021 Jun 3;22(1):409.
doi: 10.1186/s12864-021-07557-7.

Post-diapause transcriptomic restarts: insight from a high-latitude copepod

Affiliations

Post-diapause transcriptomic restarts: insight from a high-latitude copepod

Vittoria Roncalli et al. BMC Genomics. .

Erratum in

Abstract

Background: Diapause is a seasonal dormancy that allows organisms to survive unfavorable conditions and optimizes the timing of reproduction and growth. Emergence from diapause reverses the state of arrested development and metabolic suppression returning the organism to an active state. The physiological mechanisms that regulate the transition from diapause to post-diapause are still unknown. In this study, this transition has been characterized for the sub-arctic calanoid copepod Neocalanus flemingeri, a key crustacean zooplankter that supports the highly productive North Pacific fisheries. Transcriptional profiling of females, determined over a two-week time series starting with diapausing females collected from > 400 m depth, characterized the molecular mechanisms that regulate the post-diapause trajectory.

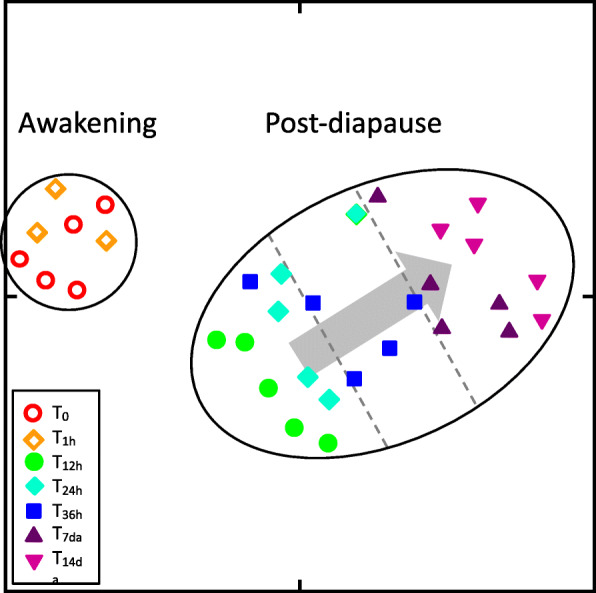
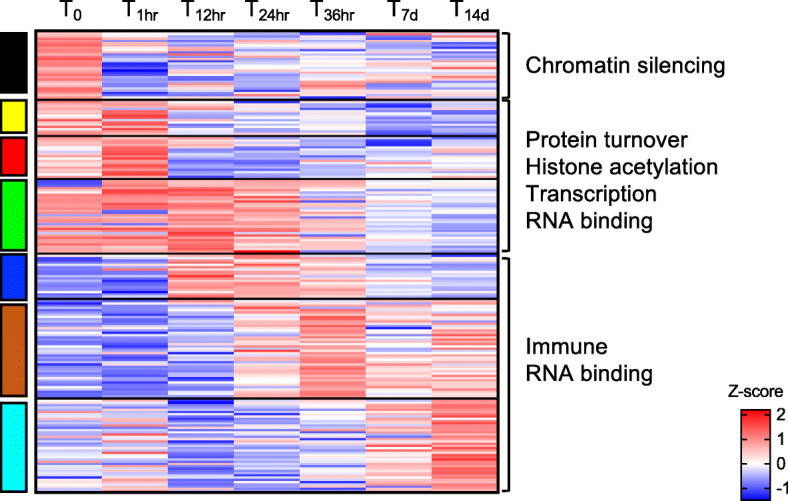
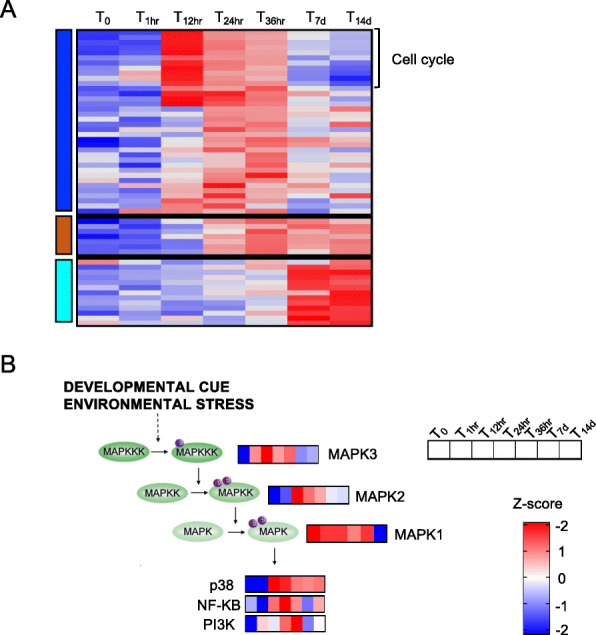
Results: A complex set of transitions in relative gene expression defined the transcriptomic changes from diapause to post-diapause. Despite low temperatures (5-6 °C), the switch from a "diapause" to a "post-diapause" transcriptional profile occurred within 12 h of the termination stimulus. Transcriptional changes signaling the end of diapause were activated within one-hour post collection and included the up-regulation of genes involved in the 20E cascade pathway, the TCA cycle and RNA metabolism in combination with the down-regulation of genes associated with chromatin silencing. By 12 h, females exhibited a post-diapause phenotype characterized by the up-regulation of genes involved in cell division, cell differentiation and multiple developmental processes. By seven days post collection, the reproductive program was fully activated as indicated by up-regulation of genes involved in oogenesis and energy metabolism, processes that were enriched among the differentially expressed genes.

Conclusions: The analysis revealed a finely structured, precisely orchestrated sequence of transcriptional changes that led to rapid changes in the activation of biological processes paving the way to the successful completion of the reproductive program. Our findings lead to new hypotheses related to potentially universal mechanisms that terminate diapause before an organism can resume its developmental program.

Keywords: Copepod; Diapause; Gulf of Alaska; Neocalanus flemingeri; Respiration; Transcriptomics.


Conflict of interest statement

The authors declare that they have no competing interests.

Figures

Fig. 1
Fig. 1
t-SNE analysis of relative expression of all of expressed genes in N. flemingeri females from collection (T0) to 14 days post-diapause (T14d). The analysis includes the log-transformed relative expression (Log2(RPKM+ 1)) of all genes (n = 140,841) and used perplexity = 9 and number of iterations = 50,000; clusters (enclosed in black ovals) identified using DBSCAN with MinPts = 3 and the Eps value that maximized the Dunn index. Sample timepoints are indicated by different symbols as shown in the inset in the graph. The internal substructure of the post-diapause cluster (indicated by the arrow) highlights the progression from T12hr to T14d samples
Fig. 2
Fig. 2
“Awakening” vs “Post-diapause” activation. Venn diagram of the total number of differentially expressed genes (up- and down-regulated) identified in the pairwise comparisons T0 vs T1hr and T0 vs T12hr. DEGs have been identified using the general linear model followed by likelihood ratio tests (FDR; p-value ≤0.05) between the indicated timepoints. Only 23 DEGs were shared between the two sets
Fig. 3
Fig. 3
Ecdysteroid signaling pathway in N. flemingeri adult females during diapause termination. Schematic representation of the ecdysteroid signaling cascade (adapted from Hwang [17]). Heatmaps show relative expression (z-score) of the N. flemingeri genes in females from T0 to T14d. All genes shown were identified as DEGs
Fig. 4
Fig. 4
Tricarboxylic acid cycle (TCA) and oxidative phosphorylation. a Schematic representation for tricarboxylic acid cycle (TCA) adapted from Wikimedia Commons (https://commons.wikimedia.org/wiki/File:Cycle_de_krebs.png). For each step of the TCA cycle intermediate products, enzymes (bold) and coenzymes (FAD and NAD+) are indicated. For each enzyme, heatmaps show relative expression (z-score)in females from T0 to T14d. b KEGG pathway diagram (map 00190) including gene expression results for the five genes among the DEGs in N. flemingeri. The upper part of the figure shows the five respiratory chain complexes with the corresponding E.C. numbers for each enzyme. In the bottom part, heatmaps show relative expression (z-score) of each enzyme associated with the respiratory chain complex in females from T0 to T14d. All enzymes shown were identified as DEGs. Copyright permission to use and adapt the KEGG map 00190 has been granted from KEGG database [18]
Fig. 5
Fig. 5
Correlation of WGCNA modules for the DEGs to sample traits. Heatmap shows correlation of module eigengenes (rows labeled by color) to samples either grouped by preservation time point (first seven columns) or individually. The right most columns (n = 33) present the correlations of the eigengene expression for each module with the individual samples as labeled on the top. The color of each cell represents the direction and strength of the correlation (blue = negative and red = positive; color scale on right). Number of DEGs in each module: green (n = 1409), red (n = 1240), black (n = 174), yellow (n = 1454), blue (n = 2909), brown (n = 2391) and turquoise (n = 3620). The grey module (n = 1411) includes DEGs that did not aggregate with a specific gene correlation network
Fig. 6
Fig. 6
Overrepresented process in females from collection to 14 days post-diapause. List of GO terms enriched for the differentially expressed genes (DEGs) in seven WGCNA modules as shown in the module correlation heatmap (see Fig. 5). Enrichment analysis was performed independently for the DEGs in each WGCNA module against the annotated reference transcriptome (n=59544). Module colors refer to Fig. 5. For each enriched GO term, parent GO terms (based on Gene Ontology hierarchical assignment), term description, GO ID and p-value adjusted for FDR are listed. Parent GO terms that were enriched exclusively in one module are in bold
Fig. 7
Fig. 7
RNA metabolism and chromatin silencing. Heatmap of the differentially expressed genes (n = 198) annotated with GO terms associated with chromatin silencing and RNA metabolism (see Fig. 6). Genes (rows) were ordered based on modules (left) for which they were enriched (see Fig. 5). For each gene, relative expression is shown as the average z-score for each timepoint as indicated by the color scale. Timepoints are indicated at the top of the heatmap. Labels on the right indicate processes that were highly represented in each module
Fig. 8
Fig. 8
Cell cycle cell differentiation and MAPK cascade pathway. a Heatmap of the differentially expressed genes (n = 56) annotated with GO terms associated with cell cycle and cell differentiation (see Fig. 6). Genes (rows) were ordered based on modules (left) for which they were enriched (see Fig. 5). For each gene, relative expression is shown as the average z-score for each timepoint as indicated by the color scale. Timepoints are indicated at the top of the heatmap. Labels on the right indicate processes that were highly represented in each module. b Schematic representation of the mitogen-activated protein kinases (MAPK) pathway (adapted from Jagodzik et al., [19]. Heatmaps show relative expression (z-score) of the N. flemingeri genes in females from T0 to T14d. All enzymes shown were identified as DEGs
Fig. 9
Fig. 9
Multicellular organism development and immune system process. Heatmap of the differentially expressed genes annotated with GO terms associated with: a multicellular organism development (n = 108) and b immune system process (n = 61) (see Fig. 6). Genes (rows) were ordered based on modules (left) for which they were enriched (see Fig. 5). For each gene, relative expression is shown as the average z-score for each timepoint as indicated by the color scale. Timepoints are indicated at the top of the heatmap
Fig. 10
Fig. 10
Reproductive program and metabolic processess. Heatmap of the differentially expressed genes annotated with GO terms associated with a oogenesis (n = 54) and b metabolic processes: glycolysis (n = 9), β-oxidation (n = 4), lipase activity (n = 27), epoxigenase activity (n = 9) and digestion (n = 19) (see Fig. 6). Genes (rows) were ordered based on modules (left) for which they were enriched (see Fig. 5). For each gene, relative expression is shown as the average z-score for each timepoint as indicated by the color scale. Timepoints are indicated at the top of the heatmap. Labels on the right indicate processes that were highly represented in each module
Fig. 11
Fig. 11
Respiration rate in pre- and post-diapausing N. flemingeri females. Summary of respiration rates measured for pre-diapausing “active” (May) and post-diapausing (September) N. flemingeri females in a boxplot graph. The box displays the median and interquartile range, while the whiskers give the minimum and maximum values for each time point. Median and mean respiration rates were the same, except for the first post-diapause respiration measurements (median = 0.22, mean = 0.26 μg O2 ind− 1 h− 1)

References

    1. Denlinger DL. Regulation of diapause. Annu Rev Entomol. 2002;47(1):93–122. doi: 10.1146/annurev.ento.47.091201.145137. - DOI - PubMed
    1. Mansingh A. Physiological classification of dormancies in insects. Can Entomol. 1971;103(7):983–1009. doi: 10.4039/Ent103983-7. - DOI
    1. Tauber CA, Tauber MJ. Insect seasonal cycles: genetics and evolution. Ann Rev Ecol Evol Syst. 1981;12(1):281–308. doi: 10.1146/annurev.es.12.110181.001433. - DOI
    1. Koštál V. Eco-physiological phases of insect diapause. J Insect Physiol. 2006;52(2):113–127. doi: 10.1016/j.jinsphys.2005.09.008. - DOI - PubMed
    1. Podrabsky JE, Hand SC. Physiological strategies during animal diapause: lessons from brine shrimp and annual killifish. J Exp Biol. 2015;218(Pt 12):1897–1906. doi: 10.1242/jeb.116194. - DOI - PMC - PubMed

LinkOut - more resources