. 2021 Jun 3;19(1):116.
doi: 10.1186/s12915-021-01050-z.

The amygdala modulates prepulse inhibition of the auditory startle reflex through excitatory inputs to the caudal pontine reticular nucleus

Affiliations

The amygdala modulates prepulse inhibition of the auditory startle reflex through excitatory inputs to the caudal pontine reticular nucleus

Jose Carlos Cano et al. BMC Biol. .

Abstract

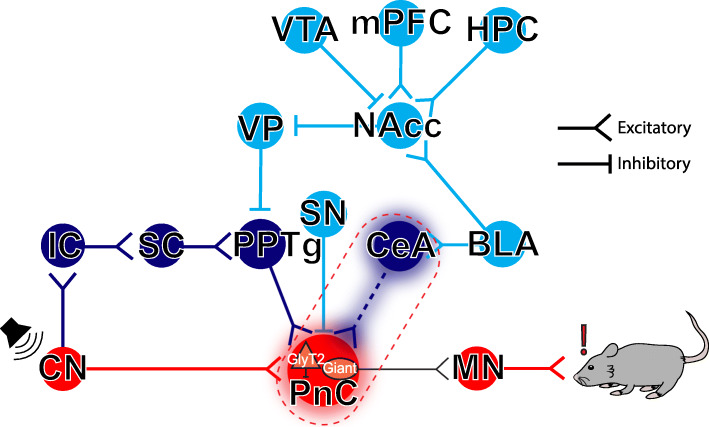
Background: Sensorimotor gating is a fundamental pre-attentive process that is defined as the inhibition of a motor response by a sensory event. Sensorimotor gating, commonly measured using the prepulse inhibition (PPI) of the auditory startle reflex task, is impaired in patients suffering from various neurological and psychiatric disorders. PPI deficits are a hallmark of schizophrenia, and they are often associated with attention and other cognitive impairments. Although the reversal of PPI deficits in animal models is widely used in pre-clinical research for antipsychotic drug screening, the neurotransmitter systems and synaptic mechanisms underlying PPI are still not resolved, even under physiological conditions. Recent evidence ruled out the longstanding hypothesis that PPI is mediated by midbrain cholinergic inputs to the caudal pontine reticular nucleus (PnC). Instead, glutamatergic, glycinergic, and GABAergic inhibitory mechanisms are now suggested to be crucial for PPI, at the PnC level. Since amygdalar dysfunctions alter PPI and are common to pathologies displaying sensorimotor gating deficits, the present study was designed to test that direct projections to the PnC originating from the amygdala contribute to PPI.

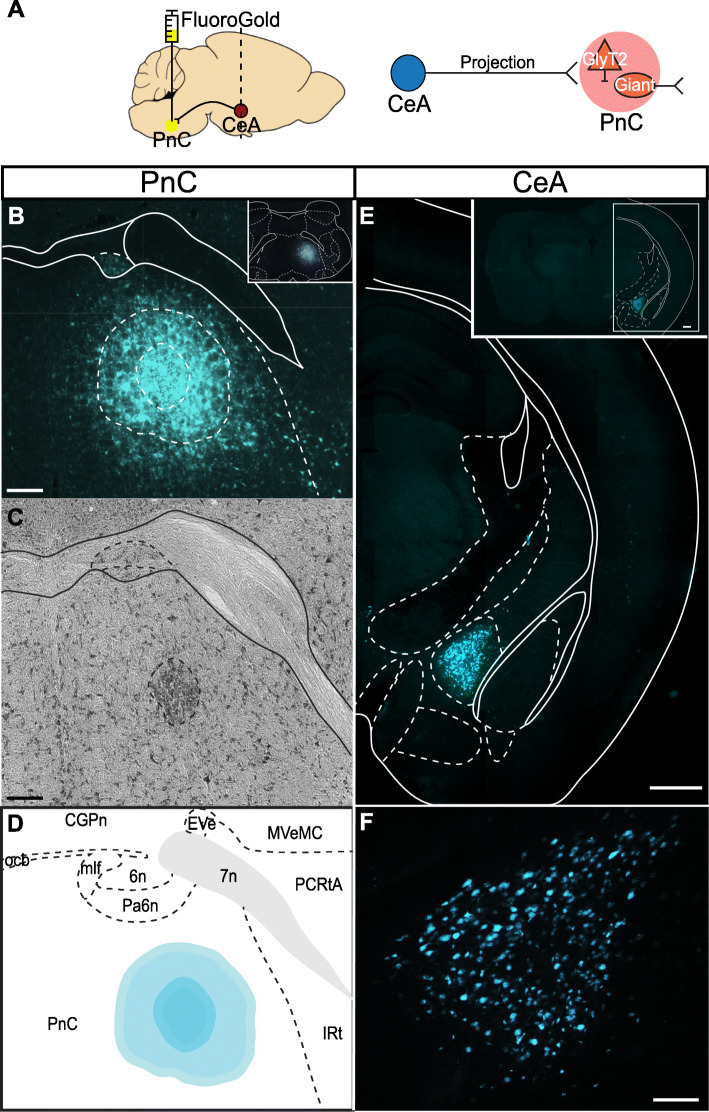
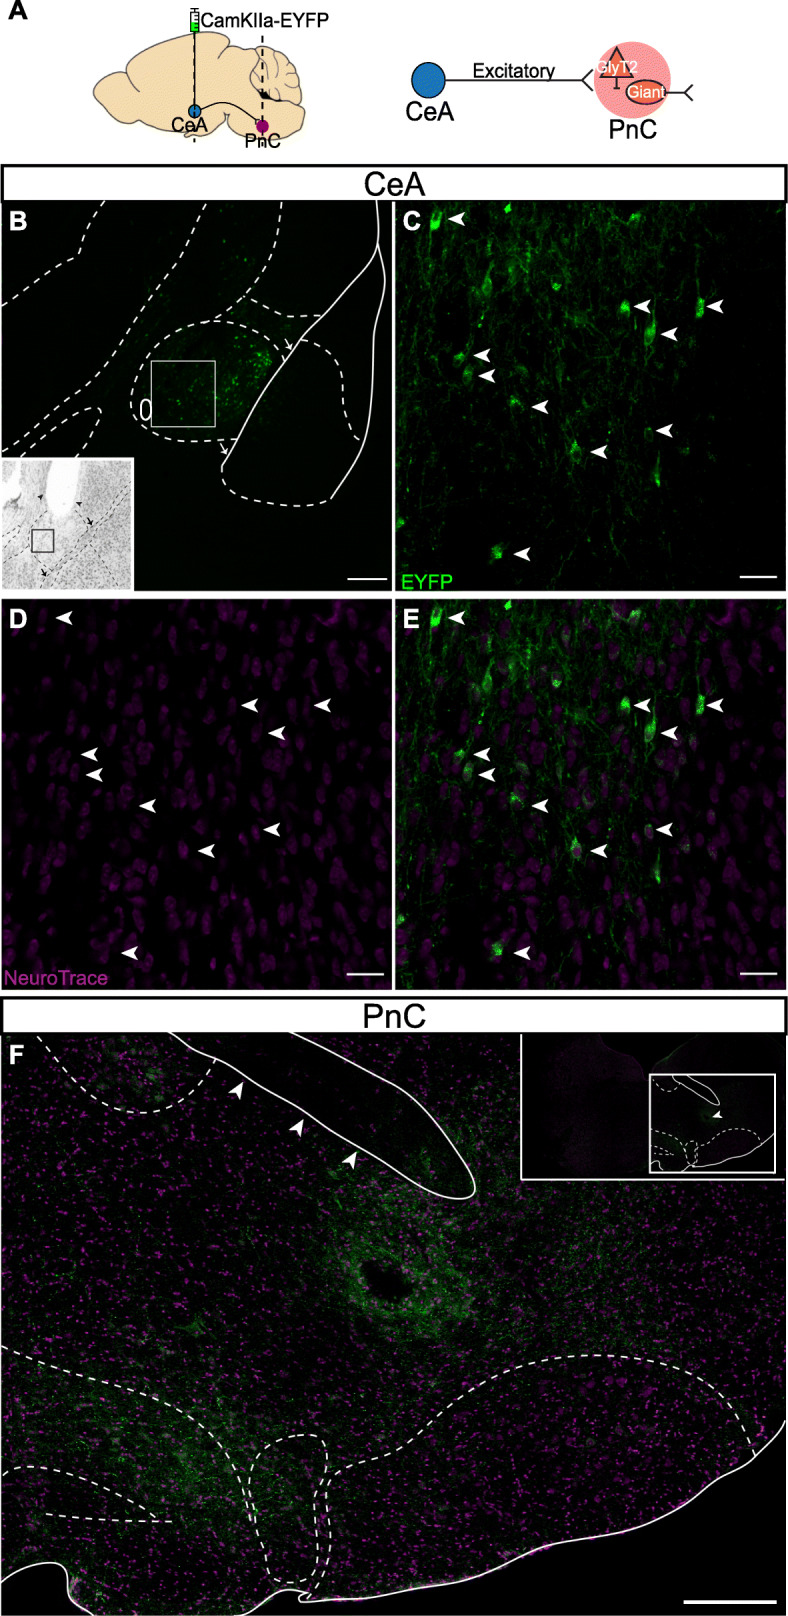
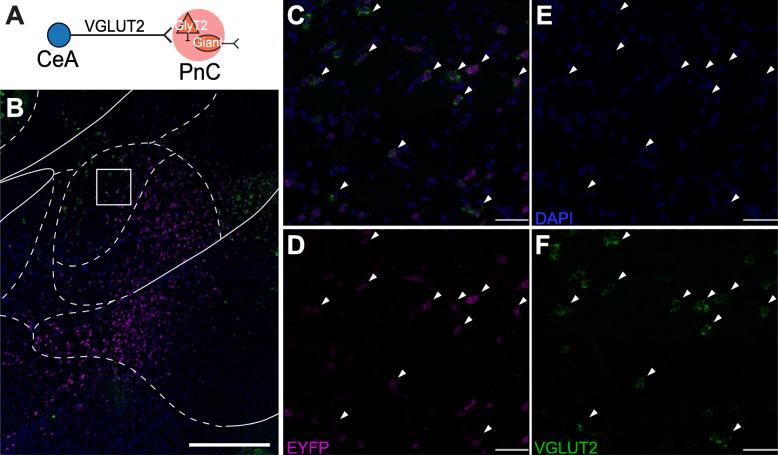
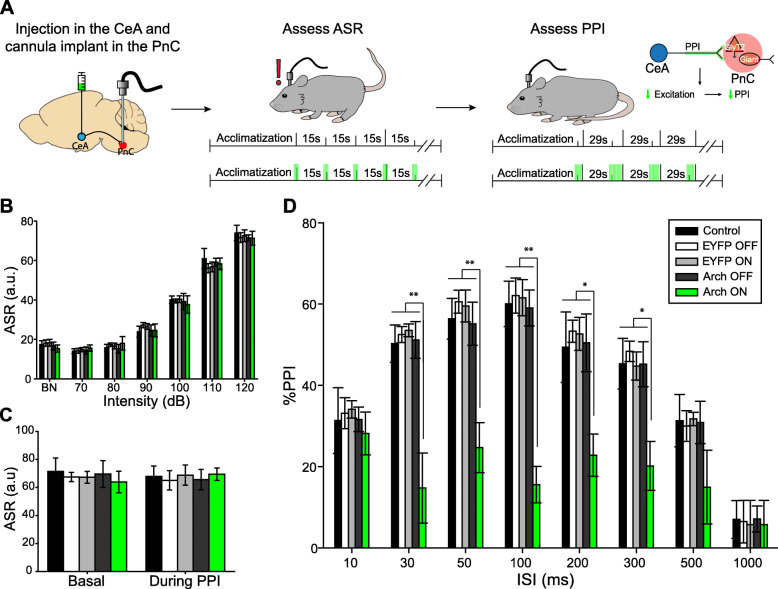
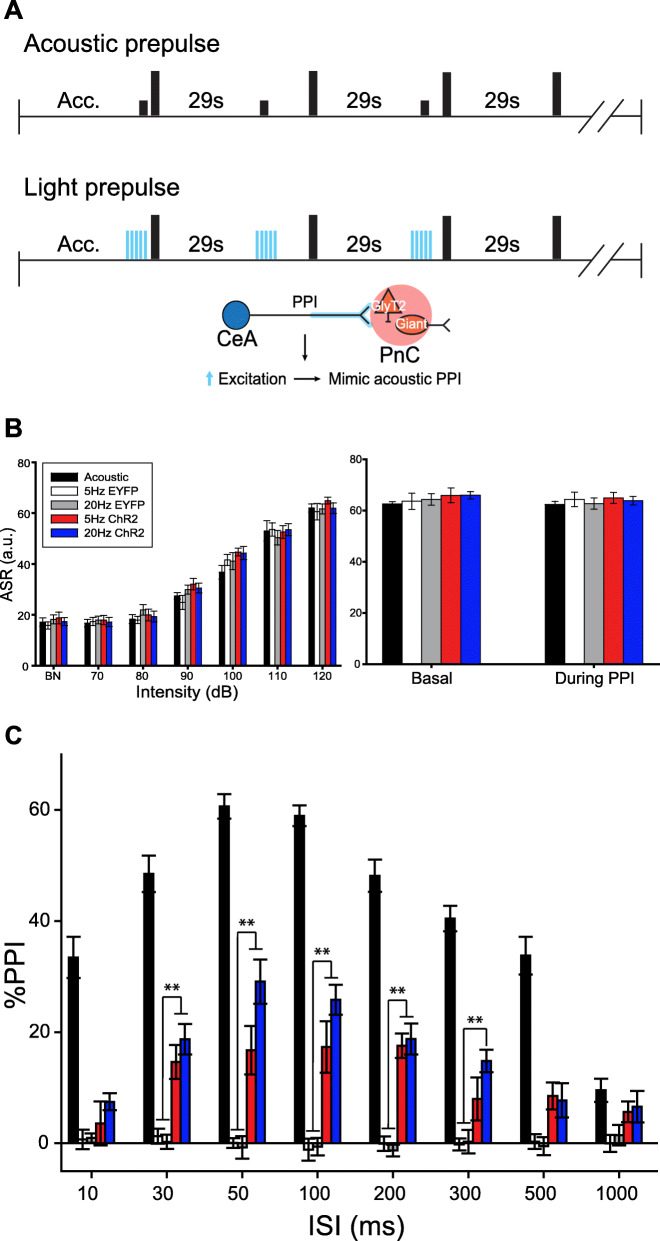
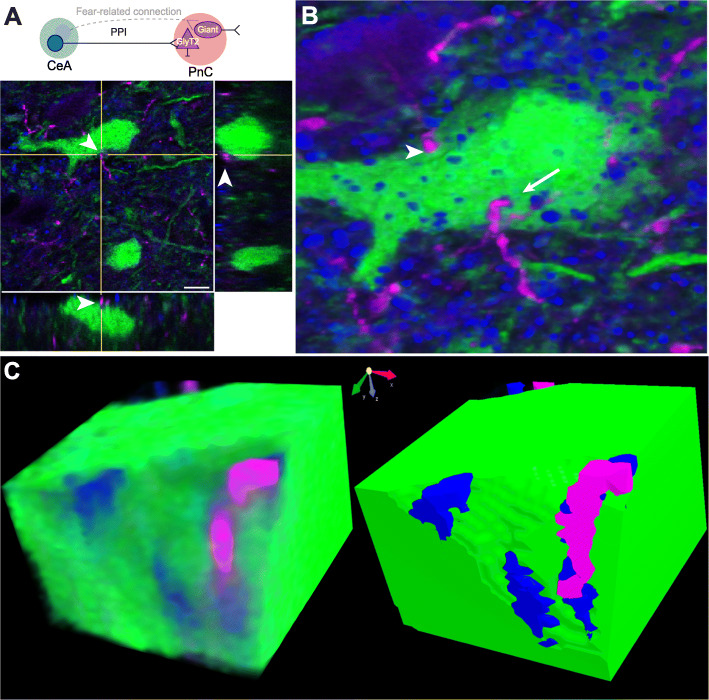
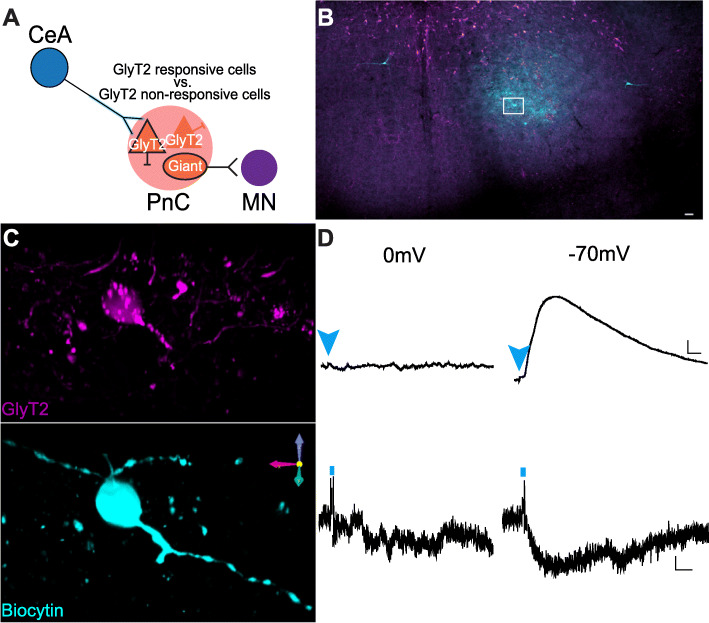
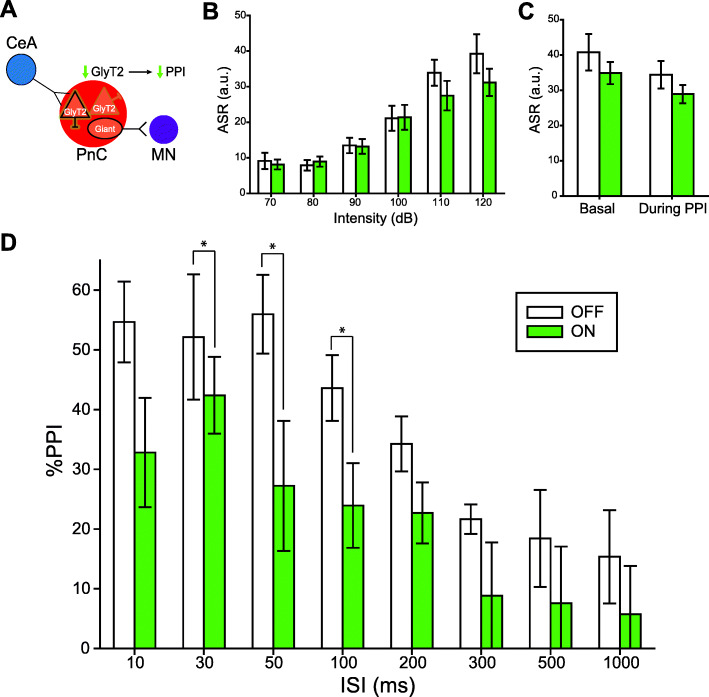
Results: Using wild type and transgenic mice expressing eGFP under the control of the glycine transporter type 2 promoter (GlyT2-eGFP mice), we first employed tract-tracing, morphological reconstructions, and immunohistochemical analyses to demonstrate that the central nucleus of the amygdala (CeA) sends glutamatergic inputs lateroventrally to PnC neurons, including GlyT2+ cells. Then, we showed the contribution of the CeA-PnC excitatory synapses to PPI in vivo by demonstrating that optogenetic inhibition of this connection decreases PPI, and optogenetic activation induces partial PPI. Finally, in GlyT2-Cre mice, whole-cell recordings of GlyT2+ PnC neurons in vitro paired with optogenetic stimulation of CeA fibers, as well as photo-inhibition of GlyT2+ PnC neurons in vivo, allowed us to implicate GlyT2+ neurons in the PPI pathway.

Conclusions: Our results uncover a feedforward inhibitory mechanism within the brainstem startle circuit by which amygdalar glutamatergic inputs and GlyT2+ PnC neurons contribute to PPI. We are providing new insights to the clinically relevant theoretical construct of PPI, which is disrupted in various neuropsychiatric and neurological diseases.

Keywords: Amygdala; Caudal pontine reticular nucleus; Electrophysiology; Optogenetics; Sensorimotor gating; Startle.


Conflict of interest statement

The authors declare that they have no competing interests.

Figures

Fig. 1
Fig. 1
Neuronal circuits contributing to the acoustic startle response and PPI. The mammalian primary acoustic startle pathway (red pathway) consists of primary auditory neurons that activate cochlear root and cochlear nuclei (CN), which then relay the auditory information to the giant neurons of the caudal pontine reticular nucleus (PnC) in the brainstem. PnC giant neurons then directly activate cervical and spinal motor neurons (MNs). During PPI (dark blue pathway), acoustic prepulses are thought to inhibit startle via the activation of the inferior (IC), superior colliculi (SC), and the pedunculopontine tegmental nucleus (PPTg). The PPI pathway is also under the influence (light blue pathway) of midbrain and cortico-limbic structures including the basolateral amygdala (BLA), which activates the nucleus accumbens (NAcc) which in turn inhibits the ventral pallidum (VP). Together, these PPI structures form the cortico-striato-pallido-pontine (CSPP) network. Here, we propose that CeA-PnC excitatory synapses (dotted dark blue pathway within the dotted red rectangle) regulate PPI alongside the CSPP circuit. HPC: hippocampus; mPFC: medial prefrontal cortex; SN: substantia nigra; VTA: ventral tegmental area
Fig. 2
Fig. 2
The CeA sends projections to the PnC. a Left, Sagittal representation of the mouse brain illustrating the Fluoro-Gold injection site in the PnC (yellow circle) and the retrograde labeling site in the CeA (red circle, dotted line). Right, Schematic of the hypothesis being tested. b Representative coronal PnC slice showing the extent of the Fluoro-Gold injection. The outer dotted circle indicates the fluorescent Fluoro-Gold injection halo. The inner dotted circle represents the center of the gliotic lesion, medial to the 7th cranial nerve and within the cytoarchitectural boundaries of the PnC. Inset: Representative image of the injection site in a coronal PnC slice, shown at lower magnification. c Representative Nissl-stained PnC section. The darker region surrounded by a dotted circular area indicates the gliotic lesion made by the Fluoro-Gold injection. d Representative image showing the Fluoro-Gold injection site in the PnC mapped to the Paxinos and Franklin Mouse Brain Atlas [52]. e Representative coronal section showing CeA neurons retrogradely labeled with Fluoro-Gold (cyan). f Higher magnification of the CeA neurons shown in e and retrogradely labeled with Fluoro-Gold. Representative of N = 4 mice. Scale bars: b–d 200 μm, e 500 μm, f 100 μm
Fig. 3
Fig. 3
CeA glutamatergic projections course within the lateroventral portion of the PnC. a Left, Sagittal representation of the mouse brain illustrating the AAV-CamKIIα-eYFP injection site targeting CeA neurons (green circle) and CeA projection fibers terminating at the level of the PnC (red circle). The dotted line illustrates the PnC level at which coronal cut sections were obtained to visualize CamKIIα-eYFP+ axons originating from the CeA. Right, Schematic of the hypothesis being tested. b Representative CeA coronal sections showing eYFP+ fluorescence (green) and NeuroTraceTM staining (magenta). The white rectangle shows the area imaged in panels ce. Inset, Nissl stain image of the injection site in the CeA. Arrowheads represent the injection needle tract, dorsal to imaging site. The black square corresponds to the white square area on the fluorescence image. c White arrows indicate CeA cells positive for CamKIIα-eYFP (green). d NeuroTraceTM stain (magenta) labels CeA cells bodies (white arrows). e White arrows indicate CeA cells positive for CamKIIα-eYFP and NeuroTraceTM. f Representative image of CamKIIα-eYFP+ CeA fibers (green) coursing within a PnC coronal section stained with NeuroTraceTM (magenta). The three arrowheads indicate the 7th cranial nerve. Inset, lower magnification of the PnC coronal section with PnC delineated landmarks. The arrowhead indicate the location of the track left by the implanted optic fiber for PPI in vivo experiments. Representative of N = 4 mice. Scale bars: c, e 400 μm, df 50 μm
Fig. 4
Fig. 4
CeA neurons targeted with the AAV-CamKIIα-eYFP viral injection are VGLUT2+. a Schematic of the hypothesis being tested. b Representative image of a CeA coronal section at low magnification, hybridized with eYFP (magenta) and VGLUT2 (green) probes. White rectangle shows area imaged in panels cf. cf Arrowheads indicate CamKIIα-eYFP+ medial CeA neurons co-expressing VGLUT2 mRNA. Representative of N = 3 mice. Scale bars: b 500 μm, c–f 25 μm
Fig. 5
Fig. 5
Silencing CeA-PnC excitatory projections during acoustic prepulses and ISIs decreases PPI. a Schematic of acoustic startle reflex and PPI protocols performed using non-injected WT control mice, mice injected with eYFP only (light ON or OFF), and mice injected with Archaerhodopsin (Arch3.0; light ON or OFF). The rightmost schematic represents the hypothesis being tested. b Graph showing no significant effect of green light presented prior to and during 70–120 dB acoustic pulses on basal startle amplitude among animal groups [mouse group: (F(1,11) = 1.417, p = 0.268); light: (F(1) = 0.00155, p = 0.969); sound intensity × light interaction: (F(1,6) = 0.206, p = 0.974)]. c Graph showing no significant main effect of light during 120 dB pulses presented before (basal) vs. randomly during the PPI task, on mean baseline startle amplitude among animal groups (F(1) = 3.124, p = 0.105). d Graph showing that green light paired with acoustic prepulses and ISIs significantly decreased PPI only in mice injected with Arch3.0, at ISIs between 30 and 300 ms. We found a significant effect of ISI (F(1,7) = 24.863, p < 0.001), light: (F(1) = 10.201, p = 0.009), and light × ISI interaction: (F(1,7) = 4.057, p < 0.001) on PPI (Two-way RM ANOVA). N = 8 mice per group. Data are represented as mean ± SEM. *p < 0.05, **p < 0.01
Fig. 6
Fig. 6
Photo-stimulation of CeA-PnC excitatory synapses induces PPI. a Representation of the PPI protocols performed using acoustic prepulses (top) or blue light prepulses (middle) in WT mice injected with eYFP only and mice injected with ChR2. The bottom schematic represents the hypothesis being tested. b In all mice, control (acoustic) ASR was assessed using acoustic pulse-alone startling stimulations (black bars). In addition, in WT mice injected with ChR2-eYFP, pulse-alone stimulations were paired with optogenetic stimulation trains of CeA-PnC glutamatergic synapses at 5 Hz (red bars) and 20 Hz (dark blue bars). Similarly, mice injected with the control vector AAV-eYFP were used to test possible blue light-induced heat effects at 5 Hz (white bars) and 20 Hz (gray bars) paired with pulse-alone stimulations. Left, Graph showing no significant main effect of blue light photo-stimulation paired with acoustic pulse-alone stimulations (70–120 dB) on mean basal startle amplitude, among animal groups. There was no effect of viral vector type (F(1,4) = 2.096, p = 0.082) or viral vector × sound intensity interaction (F(1,24) = 0.578, p = 0.944). Right, Graph showing no significant main effect of blue light photo-stimulation paired with 120-dB pulses presented during the PPI task, on mean baseline startle amplitude among animal groups. There was no effect of viral vector type (F(1,4) = 1.250, p = 0.298) or viral vector × sound intensity interaction (F(1,4) = 0.109, p = 0.979). c In all mice, control (acoustic) PPI was assessed using acoustic prepulses (black bars). In subsequent trials, photo-stimulation of CeA-PnC glutamatergic synapses at 5 Hz and 20 Hz replaced the prepulses in mice injected with the control AAV-eYFP vector (white and grey bars) and in mice injected with ChR2-eYFP (red and dark blue bars). The graph shows that only in mice injected with ChR2, optogenetic stimulation used as prepulses elicited PPI values 18–41% of acoustic prepulse, at ISI between 10 and 500 ms. (F(1,14) = 6.152, p < 0.001). N = 8 mice per group. Data are represented as mean ± SEM. *p < 0.05, **p < 0.01
Fig. 7
Fig. 7
CamKIIα+ CeA fibers closely apposed to GlyT2+ PnC neurons. a Top, Schematic of the hypothesis being tested. Bottom, Orthogonal view of a close apposition between CamKIIα-mCherry+ CeA excitatory fibers (magenta) and the soma of a GlyT2+ PnC neuron (green) indicated by the arrowhead in all three views. b Three-dimensional reconstruction of putative synaptic contacts between CamKIIα-mCherry+ CeA fibers (magenta) and GlyT2-eGFP+ neurons expressing PSD-95 (blue; arrow). Few putative synaptic appositions did not show PSD-95 staining (arrowheads). c Volume rendering and angular sectioning of the PSD-95+ putative synaptic contact shown in b. Representative of N = 6 mice. Scale bar in a is 50 μm
Fig. 8
Fig. 8
CeA glutamatergic inputs activate GlyT2+ PnC neurons via AMPA and NMDA receptors. a Top, Injection of AAVDJ-CamKIIα-ChR2-eYFP in the CeA and injection of Cre-dependent AAVDJ-tdTomato in the PnC of GlyT2-Cre mice, followed by in vitro patch clamp recordings. Bottom, Schematic of the hypothesis being tested. b Paired-pulse ratios of the light-evoked EPSPs (top) and EPSCs (bottom) at 50- and 100-ms interstimulus intervals (ISIs). Insets: Representative traces. c Graph showing the amplitude of the light-evoked EPSPs recorded in GlyT2+ PnC neurons in control, during the sequential bath application of AP5 and DNQX and following washout. Insets: Sample traces. Scale: 10 mV/15 ms. Representative of N = 10 mice, n = 38 neurons. Data are represented as mean ± SEM. *P > 0.05, **P > 0.01. Scale bars: b Voltage traces: 2 mV/10 ms; Current traces: 5 pA/5 ms
Fig. 9
Fig. 9
Electrophysiological properties of GlyT2+ PnC neurons. a Schematic of the hypothesis being tested. b Representative PnC slice showing eGFP+ fluorescence (magenta) and Biocytin staining (cyan). c Higher magnification of the box area in a, showing representative morphological reconstructions of recorded GlyT2+ cell bodies filled with biocytin. d Representative light-evoked voltage (top two traces) and current traces (bottom two traces) recorded at 0 mV (left) and − 70 mV (right) of a GlyT2+ neuron responsive to blue light. Blue arrowheads and short vertical lines indicate blue light photo-stimulation. Representative of N = 10 mice, n = 38 neurons. Scale bars: b 250 μm. c 10 μm. d Voltage traces: 1 mV/10 ms; Current traces: 5 pA/1 ms
Fig. 10
Fig. 10
Silencing GlyT2+ PnC neurons during acoustic prepulses decreases PPI. a Schematic of the hypothesis being tested in GlyT2-Cre mice injected with a Cre-dependent AAV encoding Archaerhodopsin-eYFP (Arch3.0-eYFP). b Graph showing no significant effect of green light paired with 70–120 dB acoustic startling pulses on basal startle amplitude [light: (F(1,7) = 1.407, p = 0.274); intensity × light interaction:(F(3,21) = 1.747, p = 0.188)]. c Graph showing no significant main effect of light during 120 dB pulses presented before (basal) vs. randomly during the PPI task, on mean baseline startle amplitude (F(1) = 3.124, p = 0.105). d Graph showing that green light paired with acoustic prepulses significantly decreased PPI in mice injected with Arch3.0, at ISIs between 30 and 100 ms. We found a significant effect of ISI (F(6,42) = 8.957, p < 0.001) and light (F(1,7) = 8.216, p = 0.024) (two-way RM ANOVA). N = 8 mice per group. Data are represented as mean ± SEM. *p < 0.05, **p < 0.01

Similar articles

Cited by

References

    1. Braff DL, Stone C, Callaway E, Geyer M, Glick I, Bali L. Prestimulus effects on human startle reflex in normals and schizophrenics. Psychophysiology. 1978;15(4):339–343. doi: 10.1111/j.1469-8986.1978.tb01390.x. - DOI - PubMed
    1. Swerdlow NR, Braff DL, Geyer MA. Cross-species studies of sensorimotor gating of the startle reflex. Ann N Y Acad Sci. 1999;29:202–216. doi: 10.1111/j.1749-6632.1999.tb09269.x. - DOI - PubMed
    1. Perry W, Braff DL. Information-processing deficits and thought disorder in schizophrenia. Am J Psychiatry. 1994;151(3):363–367. doi: 10.1176/ajp.151.3.363. - DOI - PubMed
    1. Li L, Du Y, Li N, Wu X, Wu Y. Top-down modulation of prepulse inhibition of the startle reflex in humans and rats. Neurosci Biobehav Rev. 2009;33(8):1157–1167. doi: 10.1016/j.neubiorev.2009.02.001. - DOI - PubMed
    1. Swerdlow NR, Benbow CH, Zisook S, Geyer MA, Braff DL. A preliminary assessment of sensorimotor gating in patients with obsessive compulsive disorder. Biol Psychiatry. 1993;33(4):298–301. doi: 10.1016/0006-3223(93)90300-3. - DOI - PubMed

Publication types

Substances