. 2021 Jun 3;19(1):115.
doi: 10.1186/s12915-021-01041-0.

Cotton D genome assemblies built with long-read data unveil mechanisms of centromere evolution and stress tolerance divergence

Affiliations

Cotton D genome assemblies built with long-read data unveil mechanisms of centromere evolution and stress tolerance divergence

Zhaoen Yang et al. BMC Biol. .

Abstract

Background: Many of genome features which could help unravel the often complex post-speciation evolution of closely related species are obscured because of their location in chromosomal regions difficult to accurately characterize using standard genome analysis methods, including centromeres and repeat regions.

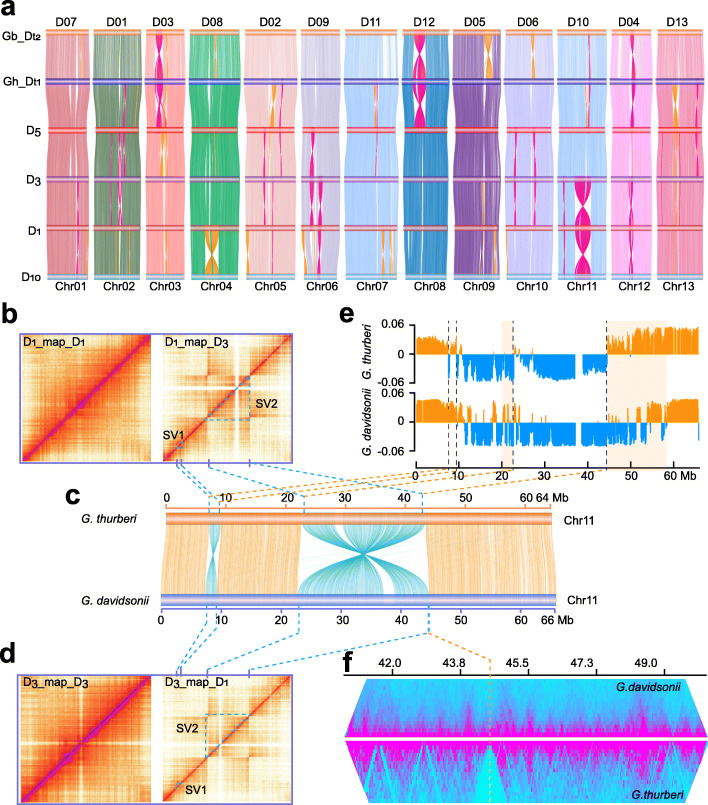
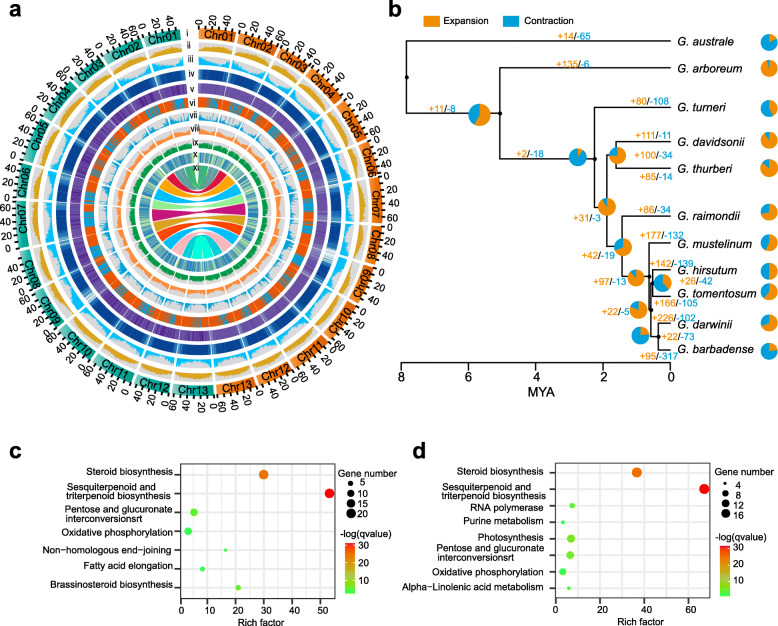
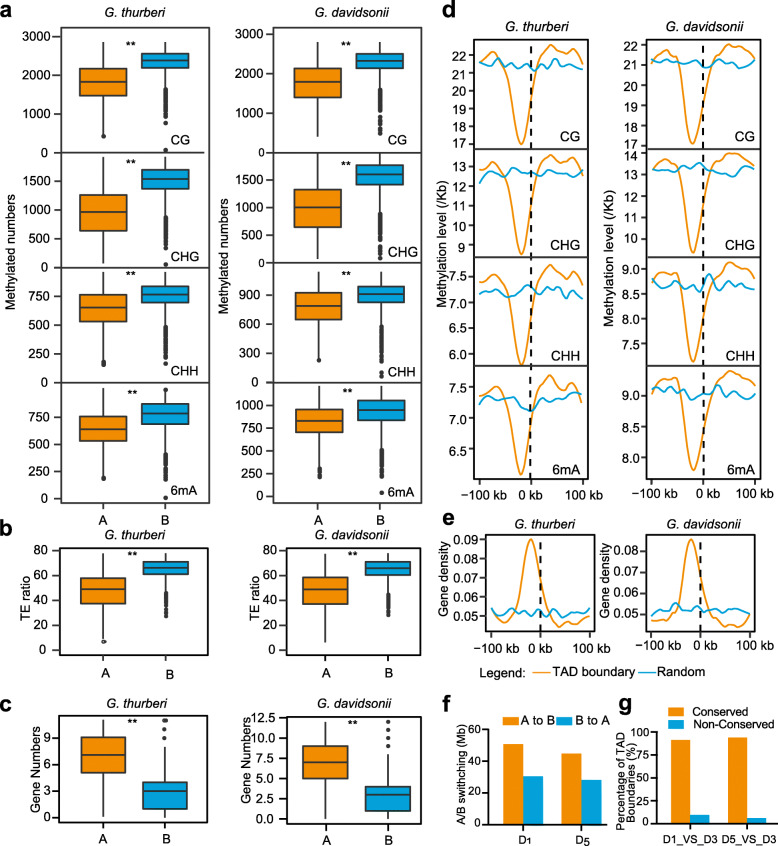
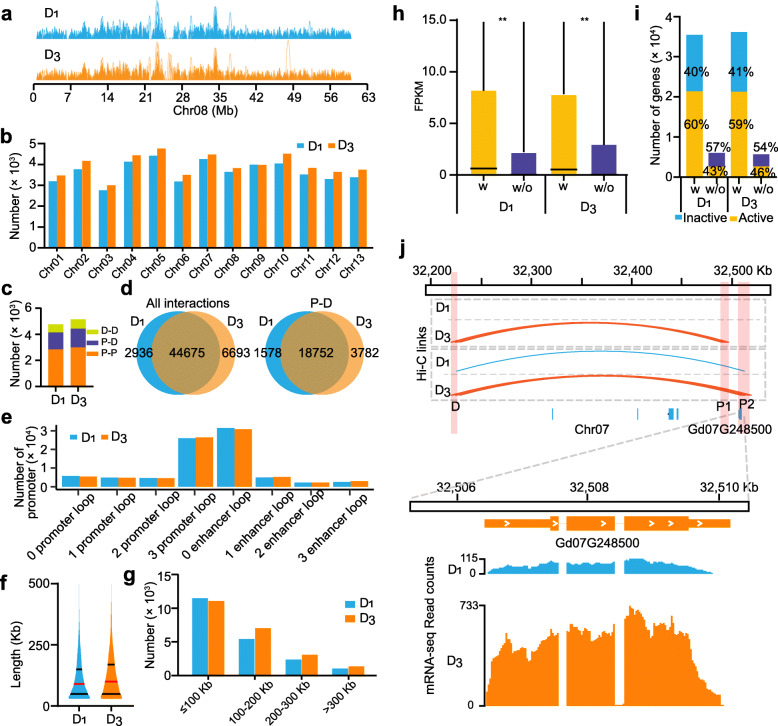
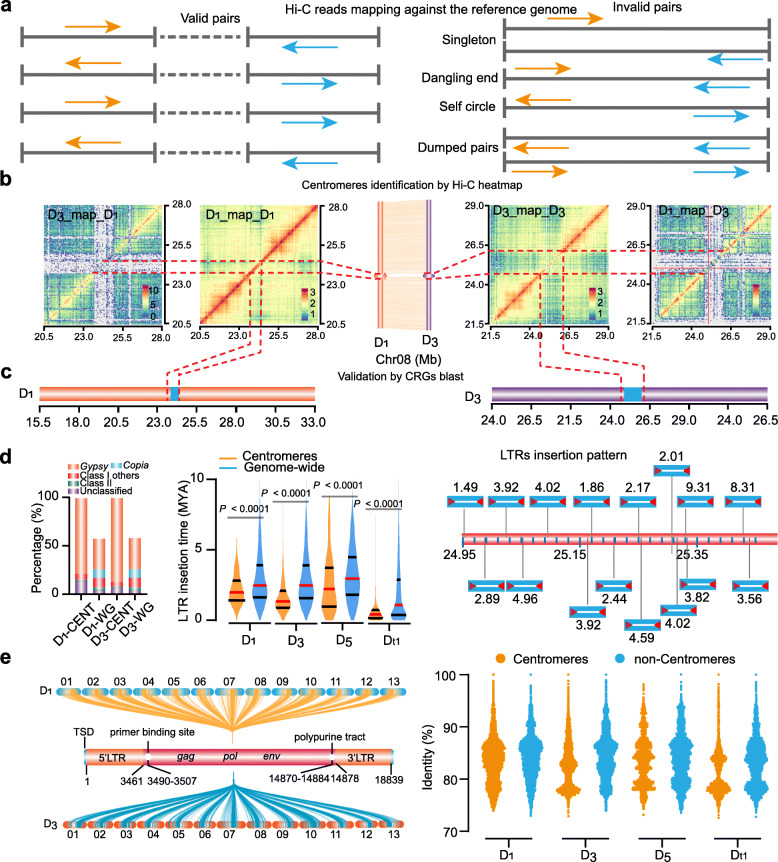
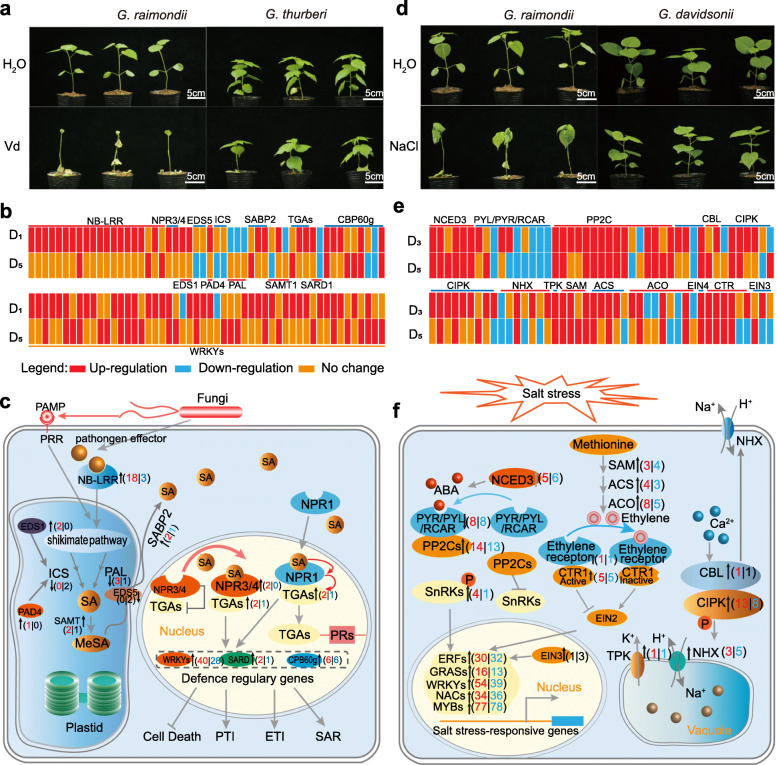
Results: Here, we analyze the genome evolution and diversification of two recently diverged sister cotton species based on nanopore long-read sequence assemblies and Hi-C 3D genome data. Although D genomes are conserved in gene content, they have diversified in gene order, gene structure, gene family diversification, 3D chromatin structure, long-range regulation, and stress-related traits. Inversions predominate among D genome rearrangements. Our results support roles for 5mC and 6mA in gene activation, and 3D chromatin analysis showed that diversification in proximal-vs-distal regulatory-region interactions shape the regulation of defense-related-gene expression. Using a newly developed method, we accurately positioned cotton centromeres and found that these regions have undergone obviously more rapid evolution relative to chromosome arms. We also discovered a cotton-specific LTR class that clarifies evolutionary trajectories among diverse cotton species and identified genetic networks underlying the Verticillium tolerance of Gossypium thurberi (e.g., SA signaling) and salt-stress tolerance of Gossypium davidsonii (e.g., ethylene biosynthesis). Finally, overexpression of G. thurberi genes in upland cotton demonstrated how wild cottons can be exploited for crop improvement.

Conclusions: Our study substantially deepens understanding about how centromeres have developed and evolutionarily impacted the divergence among closely related cotton species and reveals genes and 3D genome structures which can guide basic investigations and applied efforts to improve crops.

Keywords: 3D genome; G. davidsonii; G. thurberi; Gossypium; Hi-C; Long-range interactions; Salt tolerance; Structural variation; Verticillium wilt.


Conflict of interest statement

The authors declare that there are no competing interests.

Figures

Fig. 1.
Fig. 1.
Characterization of genomic variation among different D genomes. a Genome comparison of among G. barbadense (D subgenome, Gb_Dt2), G. hirsutum (D subgenome, Gh_Dt1), G. raimondii (D5), G. davidsonii (D3), G. thurberi (D1), and G. turneri (D10). The inversions are marked in orange and magenta. b Identification of a large inversion on Chr11 between G. thurberi and G. davidsonii. The panel shows chromatin interaction heat maps including G. thurberi Hi-C data mapping G. thurberi (D1_map_D1) and G. davidsonii Hi-C data mapping G. thurberi (D1_map_ D3). The triangle marks the inversions in the heat maps. c Genomic comparison between G. thurberi and G. davidsonii on Chr11. d The panel shows chromatin interaction heat maps including G. davidsonii Hi-C data mapping G. davidsonii (D3_map_ D3) and G. thurberi Hi-C data mapping G. davidsonii (D1_map_D3). The triangle marks the inversions in the heat maps. e A/B compartments in Chr11; orange represents the A compartments and blue represents the B compartments. The transparent boxes indicate A-B compartment switching regions. f TAD heatmap around the right breakpoint of the large inversion on Chr11
Fig. 2.
Fig. 2.
Gene family expansion among 11 cotton species. a Genomic landscape between G. thurberi and G. davidsonii genomes. (i) Genomes of G. thurberi (right panel) and G. davidsonii (left panel). (ii,iii) Transposable elements and gene density. (iv) 5mC DNA methylation levels. (v) 6mA DNA methylation levels. (vi) A and B compartments across the chromosome, orange indicates A compartments and blue indicates B compartments. (vii) Expression level based on RNA-seq analysis of leaves. The expression level was normalized by the number of reads per bin/(number of mapped read (in millions))×bin length (kb). (viii) InDel density between G. thurberi and G. davidsonii. (ix) SNP density between G. thurberi and G. davidsonii. (x) PAV density between G. thurberi and G. davidsonii. (xi) Syntenic block between G. thurberi and G. davidsonii. All data in panel (i)-(x) are shown in 500-kb windows. b A phylogenetic tree based on 7561 single-copy genes. The ratios of gene expansion and contraction of each branch are showed in the pie diagrams. The digits present the number of gene families which have experienced expansion or contractions. c,d KEGG pathway enrichment of the gene families which have experienced expansion or contraction in G. thurberi and G. davidsonii
Fig. 3.
Fig. 3.
Methylation features of 3D chromatin. a–c Methylation level, TE ratio, and gene density in A and B compartments in G. thurberi and G. davidsonii. A two-sided Wilcoxon signed-rank indicates there were significant differences at **P < 0.001. d Methylation feature around TAD boundaries. The methylation levels in TAD boundaries (orange lines) flanking 100 kb was compared with those methylation levels in random genome regions (blue lines). The lines on the right side (0 to 100 kb) indicate TAD regions, and the lines on the left side (− 100 to 0 kb) indicate TAD regions when TADs were organized consecutively or non-TAD regions when one TAD was not closely adjacent to the others. e Gene distribution around the TAD boundaries. The method for extracting genomic regions around boundaries was the same as that in panel d. f A-B compartment switching between G. thurberi (D1) and G. davidsonii (D3) or between G. raimondii (D5) and G. davidsonii (D3). g Comparison of TAD boundaries between G. thurberi and G. davidsonii (D1_Vs_D3) or G. raimondii and G. davidsonii (D5_Vs_D3)
Fig. 4.
Fig. 4.
Long-range interactions between the proximal and distal regulatory regions. a An example of long-range interactions on Chr08 in G. thurberi and G. davidsonii. b Distribution of long-range interactions in each chromosome. c The long-range interactions were divided into the P-P, P-D, and D-D interactions. d Comparison of all interactions between G. thurberi and G. davidsonii. e Comparison of P-D interactions between G. thurberi and G. davidsonii. f Violin plots for long-range interactions in G. thurberi and G. davidsonii. The center red line in plot indicates the median, and the black lines indicate the upper and lower quartiles of insertion time. g Summary of the number of P–D interaction with variable distances in G. thurberi and G. davidsonii. h Comparison of expression level for genes interacting or not interacting with chromatin interactions (**P < 0.0001, a two-sided Wilcoxon signed-rank test). i Transcriptional status for genes with or without chromatin interactions. “Inactive” represents gene with FPKM < 0.1; “Active” represents gene with FPKM ≥ 0.1. “w” indicates genes with chromatin interactions; “w/o” indicates genes without chromatin interactions. j An example of one D interacted with two P in G. davidsonii. In the upper panel, the orange and blue lines represent Hi-C links in G. thurberi and G. davidsonii. respectively, and the blue boxes represent the genes locating in the interaction loop. The middle panel indicates the gene (Gd07G24850) around the P1 and P2. The lower panel is the read coverage generated by mRNA-seq
Fig. 5.
Fig. 5.
An overview of centromere identification based on Hi-C data. a A diagram of Hi-C data mapping against the reference genome. b Characterization of centromeres in Hi-C heat maps. The left panel shows chromatin interactions, including G. davidsonii mapped to G. thurberi (D3_map_D1) and G. thurberi mapped to G. thurberi (D1_map_D1). The middle panel presents a genomic alignment around the centromeres. The three-dimensional rings indicate the centromeres. The right panel shows chromatin interactions, including G. davidsonii mapped to G. davidsonii (D3_map_D3) and G. thurberi mapped to G. davidsonii (D1_map_D3). The regions within the orange lines are the centromere regions. c Validation the centromeres by centromeric LTR (Centromere Retroelement Gossypium, CRG) BLAST analysis. The data showed the validation on Chr08. d Centromere feature analysis. The right panel presents a comparison of the repetitive elements for centromeres vs. the whole genome. The middle shows LTR insertion time distributions for centromeres specifically, and for the whole genome. The center red line in the plot indicates the median, and the black lines indicate the upper and lower quartiles for insertion times. The right panel shows an analysis of the intact LTR insertion pattern. An example is presented for G. thurberi Chr04. The digits present the insertion time of nearby LTRs. e Analysis of centromere LTR enrichment. The left panel represents the sequence identity characteristic of a “CentLTR” sequence, as examined in centromeres and non- non-centromeric regions in four D genomes. The right panel is the identity distribution pattern of CenLTR hits presented as a dot plot. This analysis detected a total of 152,285 CenLTRs in D1 centromeres, with 163,217 in D1 non-centromeric regions; 158,815 in D3 centromeres, with 139,231 in D3 non-centromeric regions; 16,093 in D5 centromeres, with 76,875 in D5 non-centromeric regions; and 80,537 in Gh_Dt1 centromeres, with 246,791 in Gh_Dt1 non-centromeric regions
Fig. 6.
Fig. 6.
Models depicting the molecular basis of Verticillium wilt and salt stress tolerance in G. thurberi and G. davidsonii. a Phenotypic comparison of G. thurberi (D1) and G. raimondii (D5) seedlings (35-day-old seedlings) in response to challenge with Verticillium dahliae. Photographs were taken under normal conditions or 14 days after challenge with Verticillium dahliae. b Heat maps for differentially expressed genes with annotations related to salicylic acid (SA) signaling, NB-LRR, and WRKYs. Genes with an adjusted P value < 0.05 and an absolute value of log2[foldchange] > 1 found by EdgeR were designated as differentially expressed. c A proposed model showing that the SA signaling pathways enhance Verticillium wilt tolerance in G. thurberi. V. dahliae attack induces SA biosynthesis via the isochorismate synthase (ICS) and phenylalanine ammonia-lyase (PAL) pathways in plastids. Enhanced disease susceptibility (EDS1) and phytoalexin deficient 4 (PAD4) are required for increased SA accumulation. SA methyltransferase (SAMT) catalyzes SA to MeSA, which diffuses into the cytoplasm, where it is converted back to active SA by SABP2. The red and blue digits in brackets represent the upregulated genes in D1 and D5, respectively. d Phenotypic comparison of G. davidsonii (D3) and G. thurberi (D1) seedlings in response to salt stress treatment (250 mM NaCl watering 21-day-old seedlings every 2 days). Photographs were taken under normal conditions or 14 days after treatment with NaCl solution. e Heat maps for differentially expressed genes with annotations related to ABA, ethylene, and CBL-CIPK pathways. Genes with an adjusted P value < 0.05 and an absolute value of log2[foldchange] > 1 found by EdgeR were designated as differentially expressed. f Transcriptional network related to salt response in G. raimondii and G. davidsonii. Ethylene biosynthesis, calcium signaling, and vacuole NHX are activated in G. davidsonii. The NCED3 gene encodes the enzyme which catalyzes the first step of ABA biosynthesis. The ABA signaling pathway, comprising PYR/PYL/RCAR, PP2C, and SnRKs proteins, is a major plant hormone involved in salt stress responses. Ethylene biosynthesis is catalyzed by the SAM, ACS (ACC synthase), and ACO (ACC oxidase) enzymes. The ethylene signaling pathway includes ethylene receptor, CTR1, and EIN2. TPK (two-pore potassium) is K+ channel that trafficks K+ out of the vacuole. NHX1 (tonoplast-based Na+/H+ exchanger) is required for sequestration of excessive Na+ and Cl in the vacuole. The red and blue digits in the brackets represent the upregulated genes in D3 and D5, respectively

Similar articles

Cited by

References

    1. Mehboob ur R, Shaheen T, Tabbasam N, Iqbal MA, Ashraf M, Zafar Y, Paterson AH. Cotton genetic resources. A review. Agronomy Sustainable Dev. 2011;32:419–432. doi: 10.1007/s13593-011-0051-z. - DOI
    1. Yang Z, Qanmber G, Wang Z, Yang Z, Li F. Gossypium genomics: trends, scope, and utilization for cotton improvement. Trends Plant Sci. 2020;25(5):488–500. doi: 10.1016/j.tplants.2019.12.011. - DOI - PubMed
    1. Adams KL, Wendel JF. Polyploidy and genome evolution in plants. Curr Opin Plant Biol. 2005;8(2):135–141. doi: 10.1016/j.pbi.2005.01.001. - DOI - PubMed
    1. Yang Z, Ge X, Yang Z, Qin W, Sun G, Wang Z, Li Z, Liu J, Wu J, Wang Y, Lu L, Wang P, Mo H, Zhang X, Li F. Extensive intraspecific gene order and gene structural variations in upland cotton cultivars. Nat Commun. 2019;10(1):2989. doi: 10.1038/s41467-019-10820-x. - DOI - PMC - PubMed
    1. Du X, Huang G, He S, Yang Z, Sun G, Ma X, Li N, Zhang X, Sun J, Liu M, et al. Resequencing of 243 diploid cotton accessions based on an updated A genome identifies the genetic basis of key agronomic traits. Nat Genet. 2018;50(6):796–802. doi: 10.1038/s41588-018-0116-x. - DOI - PubMed

Publication types

LinkOut - more resources