. 2021 Jun 3;18(1):125.
doi: 10.1186/s12974-021-02173-4.

Age influences susceptibility of brain capillary endothelial cells to La Crosse virus infection and cell death

Affiliations

Age influences susceptibility of brain capillary endothelial cells to La Crosse virus infection and cell death

Rahul Basu et al. J Neuroinflammation. .

Abstract

Background: A key factor in the development of viral encephalitis is a virus crossing the blood-brain barrier (BBB). We have previously shown that age-related susceptibility of mice to the La Crosse virus (LACV), the leading cause of pediatric arbovirus encephalitis in the USA, was associated with the ability of the virus to cross the BBB. LACV infection in weanling mice (aged around 3 weeks) results in vascular leakage in the olfactory bulb/tract (OB/OT) region of the brain, which is not observed in adult mice aged > 6-8 weeks. Thus, we studied age-specific differences in the response of brain capillary endothelial cells (BCECs) to LACV infection.

Methods: To examine mechanisms of LACV-induced BBB breakdown and infection of the CNS, we analyzed BCECs directly isolated from weanling and adult mice as well as established a model where these cells were infected in vitro and cultured for a short period to determine susceptibility to virus infection and cell death. Additionally, we utilized correlative light electron microscopy (CLEM) to examine whether changes in cell morphology and function were also observed in BCECs in vivo.

Results: BCECs from weanling, but not adult mice, had detectable infection after several days in culture when taken ex vivo from infected mice suggesting that these cells could be infected in vitro. Further analysis of BCECs from uninfected mice, infected in vitro, showed that weanling BCECs were more susceptible to virus infection than adult BCECs, with higher levels of infected cells, released virus as well as cytopathic effects (CPE) and cell death. Although direct LACV infection is not detected in the weanling BCECs, CLEM analysis of brain tissue from weanling mice indicated that LACV infection induced significant cerebrovascular damage which allowed virus-sized particles to enter the brain parenchyma.

Conclusions: These findings indicate that BCECs isolated from adult and weanling mice have differential viral load, infectivity, and susceptibility to LACV. These age-related differences in susceptibility may strongly influence LACV-induced BBB leakage and neurovascular damage allowing virus invasion of the CNS and the development of neurological disease.

Keywords: Blood-brain barrier; Brain capillary endothelial cells; Cytopathic effect; La Crosse virus; Vascular leakage.


Conflict of interest statement

The authors declare that they have no competing interests.

Figures
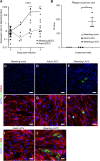
Fig. 1
Fig. 1
Detection of LACV in BCEC preps from weanling but not adult mice ex vivo. (a) Whole brain BCECs were isolated at 1, 2, and 3 dpi from weanling and adult LACV or mock-infected mice (N = 3 to 6 for each dpi) and then analyzed for LACV RNA. A Ttwo-way ANOVA was performed for understanding the difference in time and age. *P < 0.05, ****P < 0.0001. (bj) Whole brain BCECs, isolated from weanling and adult LACV and mock-infected animals, were cultured until confluence. (b) Supernatants from LACV-infected weanling and adult BCEC were analyzed for infections virus. (*P < 0.01 between adult and weanling LACV, one-way ANOVA, I). Data are the mean from 3 samples. (cj) Cells were immunostained with LACV (ce) and ZO1 (fh) or claudin 5 (cldn5, i and j). Scale bar = 100 μm (ce) and scale bar =20 μm (fj). Each symbol represents data obtained from a single mouse BCEC
Fig. 2
Fig. 2
Higher infection rate of weanling BCECs compared to adult BCECs in vitro. Weanling and adult BCECs were isolated from uninfected mice and then cultured in vitro until cells reached confluency. Cultures were infected with LACV at (a) 0.1, (b) 1, and (c)10 MOI for 1 h, washed, and then incubated for indicated time points. Data are plotted as the mean obtained from 3 or more different experimental samples and all individual plaque counts are shown. A two-way ANOVA was performed for statistical analysis. *P < 0.05, **P < 0.01, ***P < 0.001, ****P < 0.0001
Fig. 3
Fig. 3
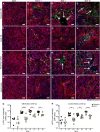
LACV infection induces higher cellular loss in weanling BCECs compared to adult BCECs. Weanling and adult BCECs, isolated separately from OB and cortex, were infected with LACV and imaged at × 10 objective magnification at 48 hpi (Scale bar = 100 μm). ZO1, LACV, and DAPI are shown in red, green, and blue channels respectively. Weanling OB BCECs (ad) and adult OB BCECs (eh) were mock-infected (a, e) or infected with LACV at MOIs of 0.1(b, f), 1 (c, g), and 10 (d, h). Weanling cortical BCECs (il) and adult cortical BCECs (mp) were mock-infected (i, m) or infected with LACV at MOIs of 0.1(j, n), 1(k, o), and 10 (l, p). All images are representative of multiple areas from wells of two experiments (a single experiment set was used for setting the background fluorescence and image quantification). Arrows show areas of viral infection and loss of cells. Quantification of sum intensity of LACV to DAPI (q, r) area using several randomized images from each set. Quantification of each image is shown as a single symbol along with the mean (orange bar: mean of weanlings and green bar: mean of adults) for each group. For each viral inoculum dose, multiple unpaired t-tests were performed between weanling OB vs adult OB and weanling cortical vs adult cortical BCECs. *P < 0.05, **P < 0.01, ***P < 0.001, ****P < 0.0001
Fig. 4
Fig. 4
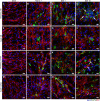
LACV infection induced cellular morphology changes in BCECs. Cultures described in Fig. 3 were stained for DAPI (blue), LACV (green), and ZO1 (red) and imaged at × 40 objective magnification (Scale bar = 20 μm) to examine morphological changes of infected cells. Weanling OB BCECs (ad) and adult OB BCECs (eh) are shown. OB BCECs were mock-infected (a, e) or infected with LACV at MOIs of 0.1 (b, f), 1 (c, g), and 10 (d, h). Weanling cortical BCECs (il) and adult cortical BCECs (mp) were mock-infected (i, m) or infected with LACV at MOIs of 0.1 (j, n), 1 (k, o), and 10 (l, p). Cell aggregation and disruption of ZO1 staining are shown by the arrow (d). Localization of ZO1 in an intracellular compartment is shown by an arrow (l). Combined counts of images from OB and cortex samples at 10 MOI inoculum doses of LACV and ZO1 stained samples showed an average of 3.7 ± 0.5 foci of cellular loss from 17 representative images of weanling BCECs. In adult BCEC, an average of 0.6 ± 0.3 foci of cellular loss were observed from 10 representative images. 0.2 ± 0.1 syncytia were observed in a total of 13 images of weanling BCECs whereas no syncytium was seen in a total of 12 images of adult BCECs
Fig. 5
Fig. 5
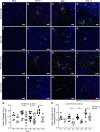
CPE observed in weanling BCECs associated with active caspase-3. Weanling and adult BCECs isolated from OB and cortex were infected with LACV. At 48 hpi, the samples were stained for LACV (green), active caspase-3 (red), and nuclear counterstain DAPI (blue). Scale bar represents 100 μm. BCECs were mock-infected (a, e, i, m) or infected with LACV with an MOI of 0.1 (b, f, j, n), 1 (c, g, k, o), and 10 (d, h, l and p). Weanling OB (ad), adult OB weanling cortical (eh), weanling coritcal (il), and adult cortical (mp) BCECs are shown. Arrows indicate active caspase-3 staining in and around LACV-infected cells (b, c, d, j, k, l) or regions of cell loss (d). Relative active caspase-3 presence per cell was quantified by calculating the active caspase-3 sum intensity-to-DAPI area ratio from several randomized from a single experiment set that was used for setting the background fluorescence and image quantification of all group. Quantification of each datapoint is shown as a single symbol along with the mean (orange bar: mean of weanlings and green bar: mean of adults) for each group (q, r). Multiple unpaired t-tests were performed for statistical analyses between matched groups and significance is represented by *P < 0.05 and **P < 0.01
Fig. 6
Fig. 6
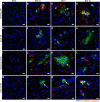
LACV infection induces syncytium-like aggregation and bystander cell death. Cultures described in Fig. 5 were stained for DAPI (blue), LACV (green), and active caspase-3 (red) and imaged using a × 40 objective. Weanling OB BCECs (ad), adult OB BCECs (eh) were mock-infected (a, e) or infected with LACV at MOIs of 0.1 (b, f), 1 (c, g), and 10 (d, h). Weanling cortical BCECs (il) and adult cortical BCECs (mp) were mock-infected (i, m) or infected with LACV at MOIs of 0.1 (j, n), 1 (k, o), and 10 (l, p). Large, syncytium-like aggregation is noted as arrows in d and k). Combined counts of images from the OB and cortex samples at 10 MOI inoculum doses of LACV and active caspase-3-stained samples demonstrated an average of 2.3 ± 0.7 of cellular loss were counted per image of 10 representative images from weanling BCECs. In adults, 0.9 ± 0.3 foci of cellular loss were observed per image from10 representative images. 0.6 ± 0.2 syncytia were observed in a total of 11 images from weanling BCECs. In adults, 0.36 ± 0.28 syncytia were counted per image from 11 representative images. All images were at 10 MOI of inoculation dose. Scale bar = 20 μm
Fig. 7
Fig. 7
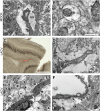
Alteration of cerebrovascular tissue morphology in LACV induced vascular leakage. CLEM images of vibratome sectioned OBs from mock (a, b) and LACV-infected mice (cf) injected with 100-nm fluorescent beads at 3 dpi. BCEC ultrastructure from mock-infected OB (a, b). LM image of vibratome-sectioned LACV-infected mice OB used to identify vascular leakage in blood vessels by TEM (c), with beads in brain parenchyma shown with white arrows (e). Ultrastructure of BCEC from areas of vascular leakage (d, f) showing compromised perivascular tissue region indicated by white arrowheads and altered BCEC morphology indicated by black arrows. TEM scale bar = 500nm, LM scale bar = 500 μm

Similar articles

Cited by

References

    1. Bennett RS, et al. La Crosse virus infectivity, pathogenesis, and immunogenicity in mice and monkeys. Virol J. 2008;5:25. doi: 10.1186/1743-422X-5-25. - DOI - PMC - PubMed
    1. Taylor KG, et al. Age-dependent myeloid dendritic cell responses mediate resistance to La Crosse virus-induced neurological disease. J Virol. 2014;88(19):11070–11079. doi: 10.1128/JVI.01866-14. - DOI - PMC - PubMed
    1. McJunkin JE, et al. La Crosse encephalitis in children. N Engl J Med. 2001;344(11):801–807. doi: 10.1056/NEJM200103153441103. - DOI - PubMed
    1. Winkler CW, et al. Capillaries in the olfactory bulb but not the cortex are highly susceptible to virus-induced vascular leak and promote viral neuroinvasion. Acta Neuropathol. 2015;130(2):233–245. doi: 10.1007/s00401-015-1433-0. - DOI - PubMed
    1. Winkler CW, et al. Lymphocytes have a role in protection, but not in pathogenesis, during La Crosse virus infection in mice. J Neuroinflammation. 2017;14(1):62. doi: 10.1186/s12974-017-0836-3. - DOI - PMC - PubMed

MeSH terms