. 2021 Jun 3;18(1):124.
doi: 10.1186/s12974-021-02158-3.

Crosstalk between astrocytes and microglia results in increased degradation of α-synuclein and amyloid-β aggregates

Affiliations

Crosstalk between astrocytes and microglia results in increased degradation of α-synuclein and amyloid-β aggregates

Jinar Rostami et al. J Neuroinflammation. .

Abstract

Background: Alzheimer's disease (AD) and Parkinson's disease (PD) are characterized by brain accumulation of aggregated amyloid-beta (Aβ) and alpha-synuclein (αSYN), respectively. In order to develop effective therapies, it is crucial to understand how the Aβ/αSYN aggregates can be cleared. Compelling data indicate that neuroinflammatory cells, including astrocytes and microglia, play a central role in the pathogenesis of AD and PD. However, how the interplay between the two cell types affects their clearing capacity and consequently the disease progression remains unclear.

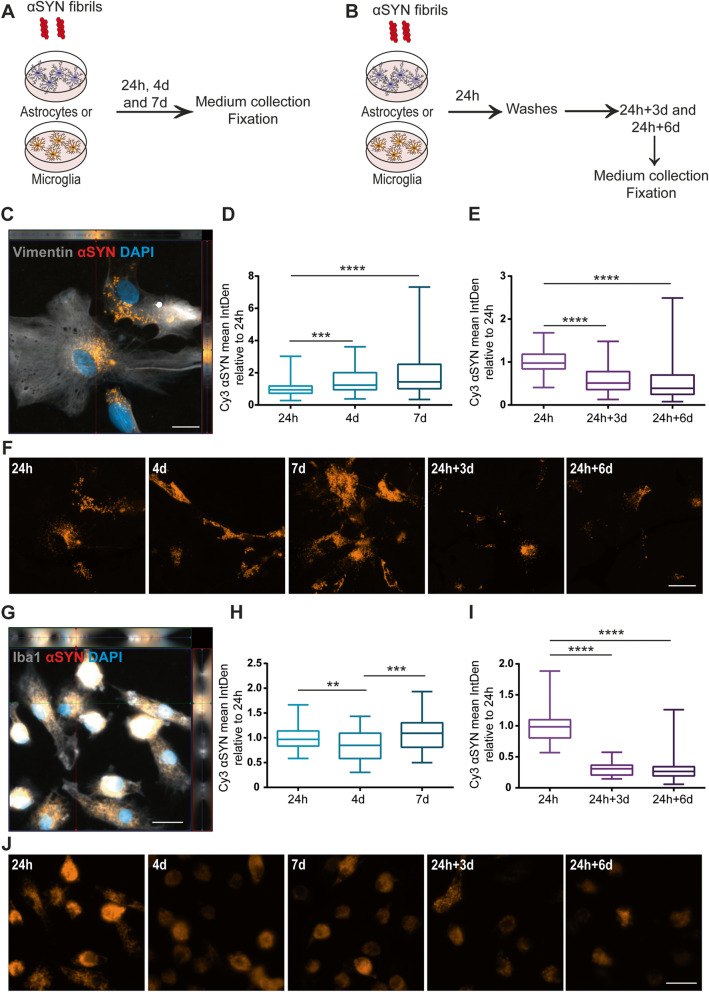
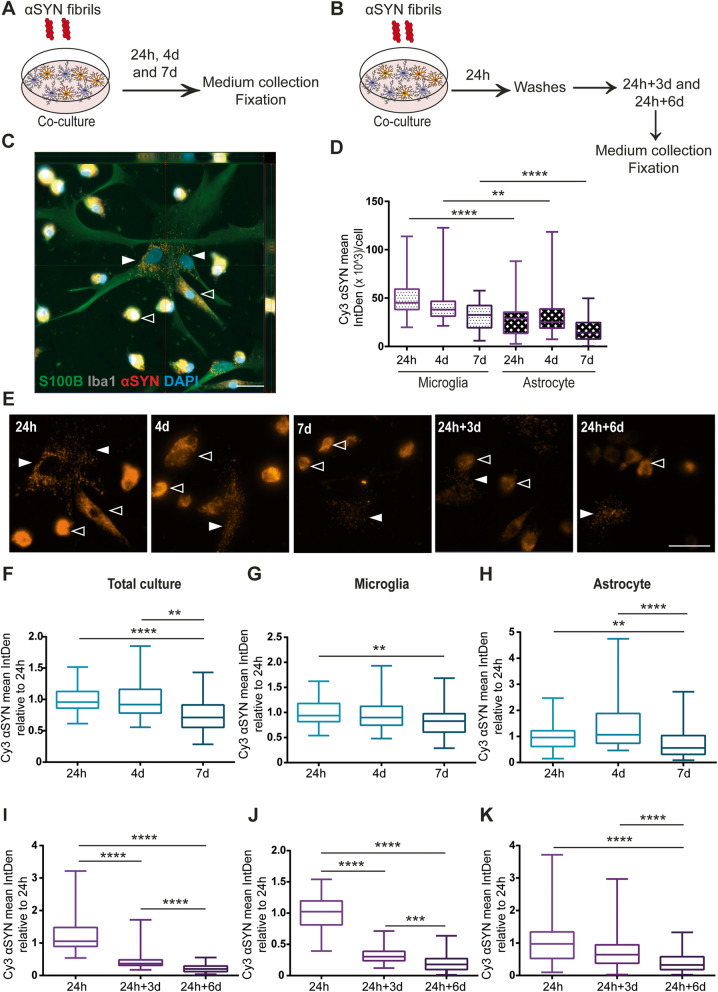
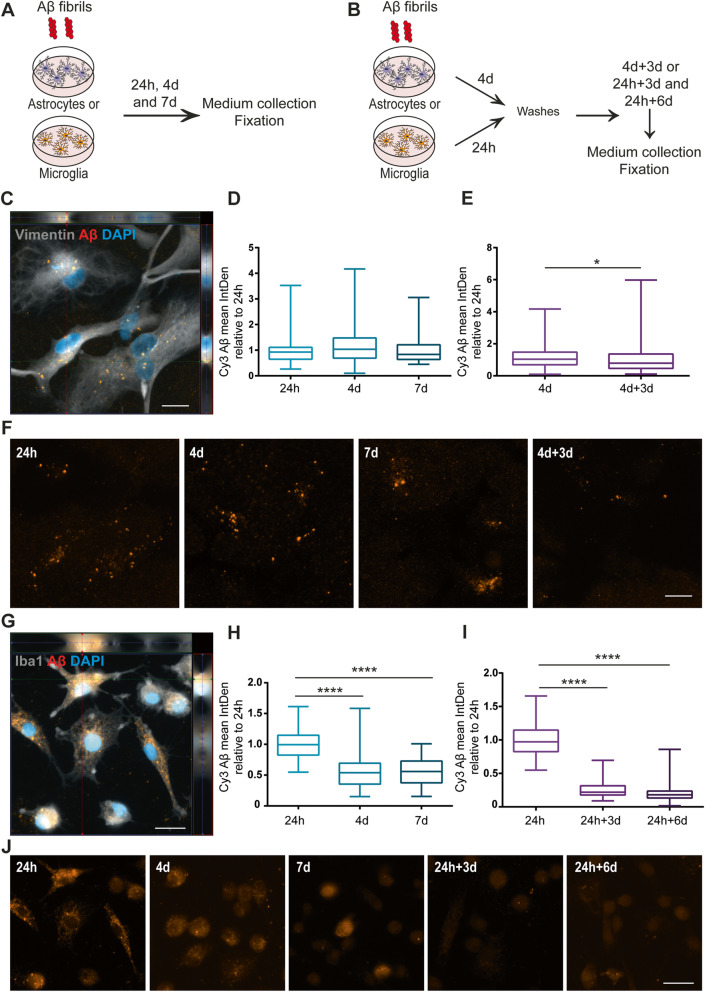
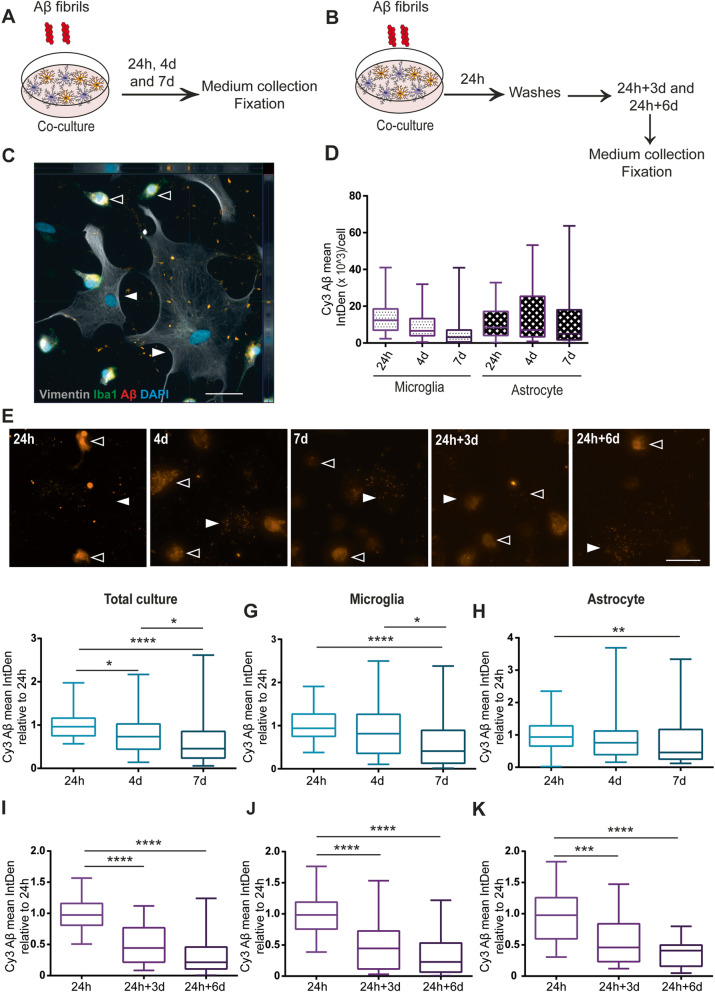
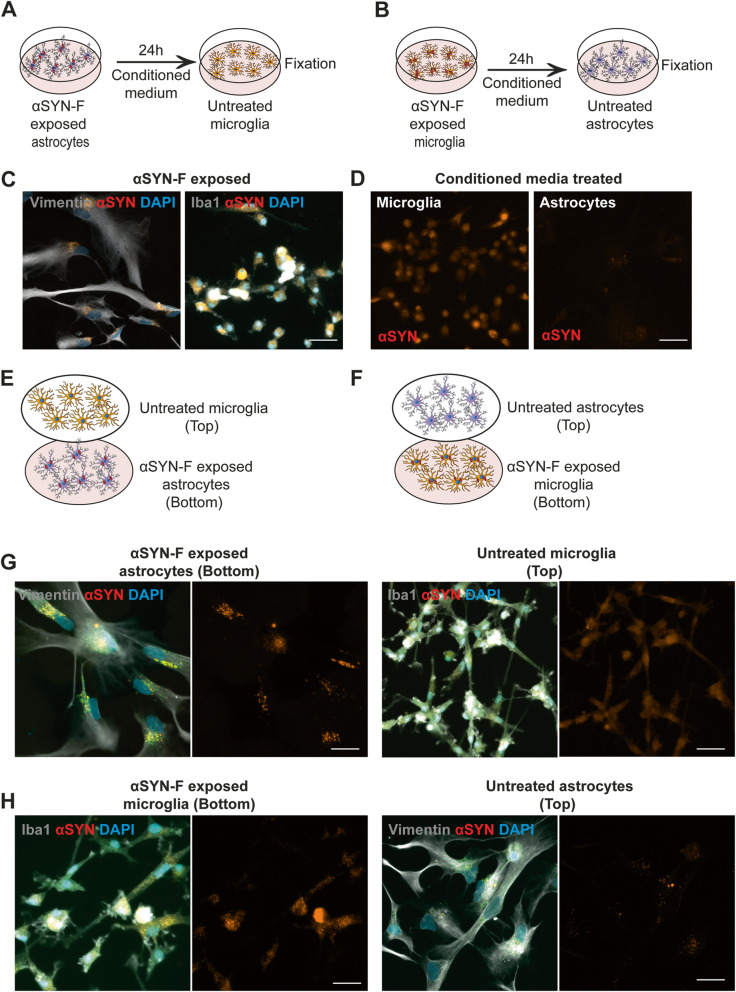
Methods: The aim of the present study was to investigate in which way glial crosstalk influences αSYN and Aβ pathology, focusing on accumulation and degradation. For this purpose, human-induced pluripotent cell (hiPSC)-derived astrocytes and microglia were exposed to sonicated fibrils of αSYN or Aβ and analyzed over time. The capacity of the two cell types to clear extracellular and intracellular protein aggregates when either cultured separately or in co-culture was studied using immunocytochemistry and ELISA. Moreover, the capacity of cells to interact with and process protein aggregates was tracked using time-lapse microscopy and a customized "close-culture" chamber, in which the apical surfaces of astrocyte and microglia monocultures were separated by a <1 mm space.

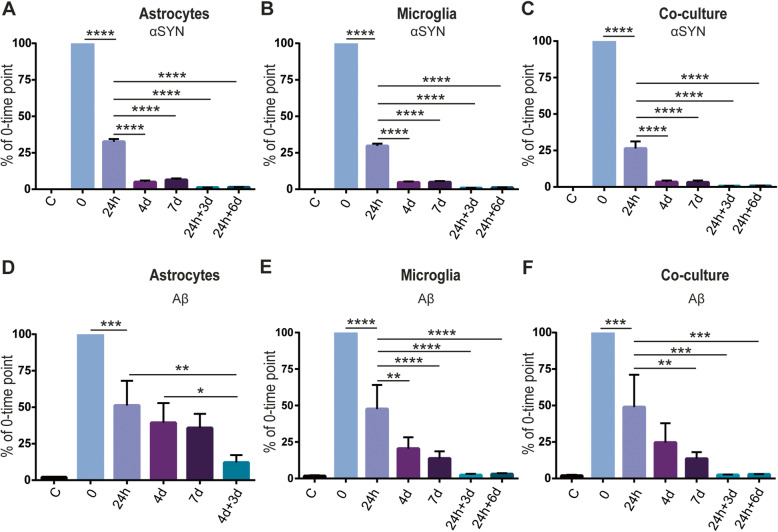
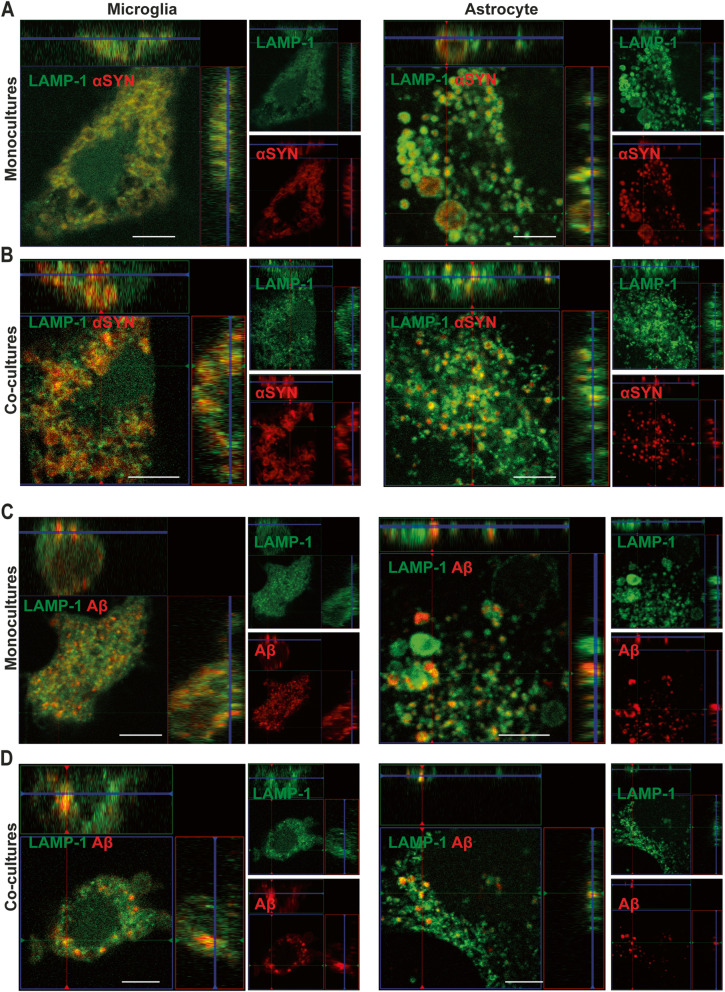
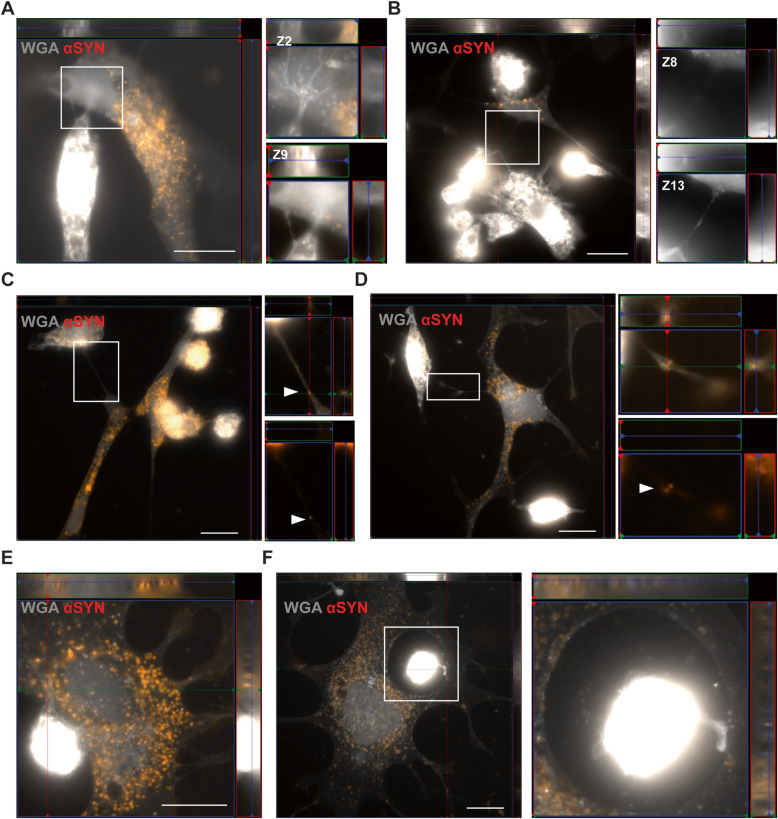
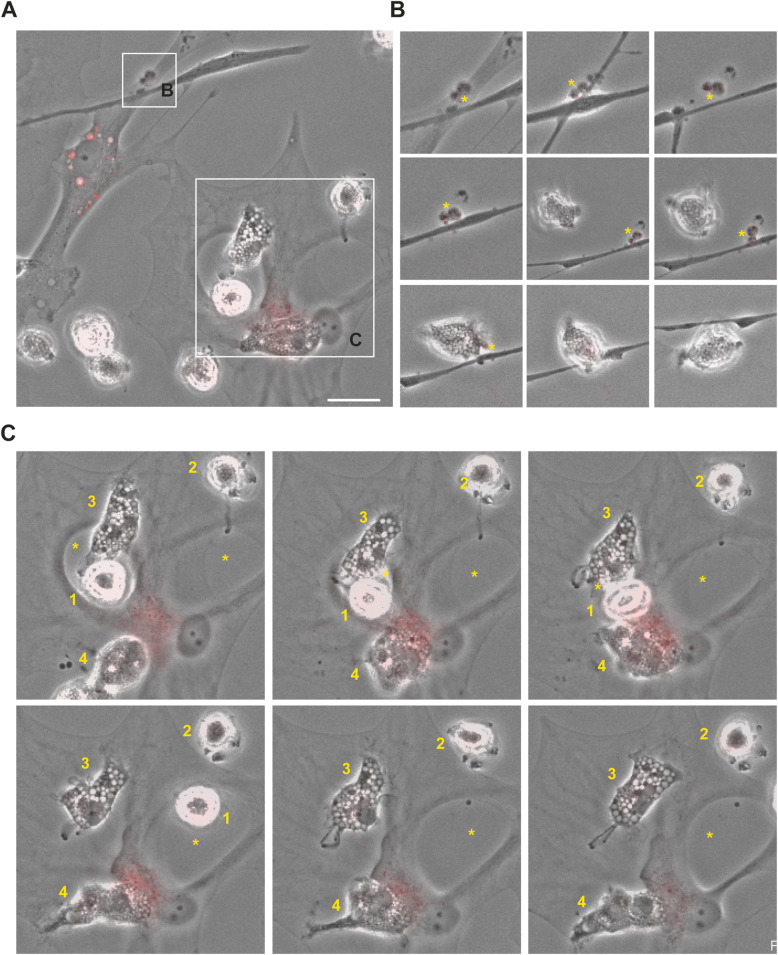
Results: Our data show that intracellular deposits of αSYN and Aβ are significantly reduced in co-cultures of astrocytes and microglia, compared to monocultures of either cell type. Analysis of conditioned medium and imaging data from the "close-culture" chamber experiments indicate that astrocytes secrete a high proportion of their internalized protein aggregates, while microglia do not. Moreover, co-cultured astrocytes and microglia are in constant contact with each other via tunneling nanotubes and other membrane structures. Notably, our live cell imaging data demonstrate that microglia, when attached to the cell membrane of an astrocyte, can attract and clear intracellular protein deposits from the astrocyte.

Conclusions: Taken together, our data demonstrate the importance of astrocyte and microglia interactions in Aβ/αSYN clearance, highlighting the relevance of glial cellular crosstalk in the progression of AD- and PD-related brain pathology.

Keywords: Alzheimer’s disease; Amyloid-β; Astrocyte; Co-culture; Crosstalk; Degradation; Microglia; Parkinson’s disease; Tunneling nanotube; α-Synuclein.


Conflict of interest statement

The authors declare that they have no competing interests.

Figures

Fig. 1
Fig. 1
In contrast to microglia, astrocytes accumulate αSYN over time. Schematic figure of the study design illustrating that the cells were treated with αSYN-F, either continuously (a) or with a 24h pulse (b). Astrocytes ingested and accumulated αSYN-F already at 24h (c). However, the accumulation was continuous over the course of 7d, resulting in an increased intracellular signal of αSYN (d). However, when the cells were washed at 24h and cultured without αSYN-F for 3d and 6d, a significant reduction was observed over time (e). Representative images of the αSYN deposits in astrocytes at the different time points are shown in f. Microglia showed extensive amounts of intracellular αSYN-F at 24h (g). However, microglia did not show the same level of accumulation over time as compared to the astrocytes but had unchanged levels of intracellular αSYN from 24h to 7d (h). Only low levels of αSYN were present in microglia at 24h+3d and 24h+6d, indicating more effective degradation in microglia than in astrocytes (i). Representative images of the αSYN deposits in microglia at the different time points are shown in (j). Scale bars = 20μm
Fig. 2
Fig. 2
αSYN accumulation is reduced when microglia and astrocytes are co-cultured. Schematic figure of the study design illustrating that the cells were either treated with αSYN-F constantly (a) or with a 24h pulse (b). Both astrocytes (Iba1- S100B+, filled arrow heads) and microglia (Iba1+, open arrow heads) ingested and accumulated αSYN in the co-culture set-up (c). Image analysis showed that the microglia contained more αSYN signal per cell at 24h and 4 d, compared to the astrocytes (d). Representative images of the αSYN-F deposits at the different time points in the co-culture are shown in e; astrocytes and microglia are indicated with filled respective open arrow heads. Analysis of the total intracellular αSYN in the co-culture revealed that there was an overall reduction of αSYN at d7 in relation to the 24h time point (f). Separate image analysis of the αSYN content in the two cell types of the co-culture confirmed that the decrease in αSYN signal was significantly lower in both microglia (g) and astrocytes (h) at d7. For the astrocytes, the reduction in αSYN was opposite to the pattern in the pure astrocytic culture, suggesting a lower accumulation of αSYN within astrocytes in the co-culture. When the co-cultures were washed at 24h and cultured without αSYN-F for 3d and 6d, a significant reduction was observed over time in the total co-culture (i), which was due to a decrease in both co-cultured microglia (j) and co-cultured astrocytes (k). Scale bars = 20μm
Fig. 3
Fig. 3
Intracellular Aβ levels are reduced in microglia over time but remain stable in astrocytes. Schematic figure of the study design illustrating that the cells were either constantly treated with Aβ-F for 24h, 4d, and 7d (a) or treated with an Aβ-F pulse (b), lasting for 24h (microglia) or 4d (astrocytes), followed by culture in Aβ-F-free medium. Astrocytes had ingested and accumulated Aβ-F already at 24h (c). The intracellular Aβ accumulation was significantly increased after 4d compared to 24h (d). At 4d+3d, the astrocytic Aβ signal was significantly reduced, compared to the 4d time point (e). Representative images of the Aβ deposits in astrocytes at the different time points are shown in f. Large amounts of intracellular Aβ could be detected in microglia at 24h (g). Contrary to the astrocytes, microglia showed a reduction in intracellular Aβ signal at 4 days and 7d compared to 24h (h). Furthermore, the intracellular Aβ aggregates in microglia were significantly lowered at 24h+3d and 24+6d, compared to 24h (i). Representative images of the Aβ deposits in microglia at the different time points are shown in j. Scale bars = 20μm
Fig. 4
Fig. 4
Intracellular Aβ is reduced when astrocytes and microglia are cultured together. Schematic figure of the study design illustrating that the cells were either treated with Aβ-F constantly (a) or with a 24h Aβ-F pulse (b). In the co-culture, both astrocytes (Iba1- S100B+, filled arrow heads) and microglia (Iba1+, open arrow heads) ingested and accumulated Aβ-F (c). Image analysis and normalization to the number of cells confirmed that astrocytes and microglia contained comparable levels of Aβ at 24h, 4d and 7d (d). Representative images of the Aβ deposits at the different time points in the co-culture are shown in (e); astrocytes and microglia are indicated with filled respective open arrow heads. Analysis of the total intracellular Aβ in the co-culture revealed that intracellular Aβ was lower in the culture at 7d, compared to 24h (f). Separate analysis of the two cell types in the co-culture demonstrated that the astrocytes, rather than the microglia, were responsible for this reduction (g, h). When the co-cultures were washed at 24h and cultured without Aβ-F for 3d and 6d, a significant reduction was observed over time (i), which was due to a decrease in both microglia (j) and astrocytes (k). Scale bars = 20μm
Fig. 5
Fig. 5
Astrocytes and microglia clear equal amounts of αSYN, but microglia clear extracellular Aβ more effectively. αSYN levels in the medium revealed that both astrocytes and microglia engulfed almost 75% of the initial αSYN. Furthermore, both astrocytes and microglia continued to ingest αSYN during the 7d of exposure. Secretion of αSYN was observed in all cultures at 24h+3d and 24h+6d (ac). Analysis of Aβ in the medium revealed that astrocytes were less efficient in engulfing Aβ, compared to microglia. In the co-culture set-up, cells engulfed Aβ at the same level as in the microglial culture. Also, low secretion of Aβ could be observed at 24h+3d and 24h+6d in the microglia and co-cultures, whereas higher Aβ levels was observed at 4d+3d in the astrocyte cultures (df)
Fig. 6
Fig. 6
Ingested αSYN-F and Aβ-F are located in LAMP1+ vesicles. Confocal microscopy demonstrated that intracellular deposits of αSYN (a, b) and Aβ (c, d) were surrounded by LAMP1+ vesicles in both monocultures of astrocytes and microglia (a and c) and in the co-cultures (b and d). Scale bars = 20μm
Fig. 7
Fig. 7
Secreted αSYN aggregates are transferred from astrocytes to microglia. Conditioned media experiments were performed to investigate if transfer of αSYN occurred from one cell type to another via secretion (a, b). Microglia that received conditioned medium from αSYN-exposed astrocytes contained high levels of αSYN, while astrocytes that received microglia medium had very little intracellular αSYN (c, d). To further study secretory spreading of αSYN aggregates between the two cell types, we performed experiments using a customized close-culture chamber, in which the astrocytes and microglia were cultured face-to-face, separated by a <1-mm space. In the chamber, either untreated microglia were co-cultured with αSYN-exposed astrocytes (e) or untreated astrocytes were co-cultured with αSYN-exposed microglia (f). Consistently with the conditioned media data, astrocytes were found to transfer a large proportion of their internalized αSYN to microglia (g), while microglia hardly transferred any αSYN to the astrocytes (h). Scale bars = 20μm
Fig. 8
Fig. 8
Direct contact between microglia and astrocytes enables cell-to-cell transfer of αSYN deposits. Astrocytes and microglia were found to have direct TNTs (a, b). Z-stacks of the zoomed regions of a and b are shown beside respective image. High resolution imaging revealed TNT-mediated transfer of αSYN between astrocytes and microglia (c, d, white arrows). The microglia were also found to be in close contact with (e) or completely surrounded by astrocytic membranes (f). Scale bars= 20μm
Fig. 9
Fig. 9
Microglia can attract and clear intracellular αSYN deposits from astrocytes via membrane contact. Time-lapse microscopy illustrated a complex interplay between astrocytes and microglia (a). Different time points of the regions of interest are shown in b and c. For b, the total duration from the first to last image is 10h and for c 11h. Astrocytes secreted large αSYN-containing vesicles (yellow star) that were ingested by microglia (b). Moreover, microglia were found to be in direct contact with astrocytes in ring-shaped areas (yellow star) encapsulated by astrocytic membrane (microglia 1) or attached to the cell membrane of this area (microglia 2) (c). Microglia were anchored to the astrocyte membrane via distinct protrusions (microglia 2 and 3) and often interacted with the astrocytes in the region where the most intracellular αSYN deposits were situated (microglia 4). During this interaction, the deposits appeared to decrease dramatically, indicating direct αSYN transmission followed by instant degradation. Scale bar= 10μm

References

    1. Matejuk A, Ransohoff RM. Crosstalk between astrocytes and microglia: an overview. Frontiers in Immunology. 2020;11:1416. doi: 10.3389/fimmu.2020.01416. - DOI - PMC - PubMed
    1. Goedert M. Parkinson’s disease and other alpha-synucleinopathies. Clin Chem Lab Med. 2001;39(4):308–312. doi: 10.1515/CCLM.2001.047. - DOI - PubMed
    1. LaFerla FM, Green KN, Oddo S. Intracellular amyloid-beta in Alzheimer’s disease. Nat Rev Neurosci. 2007;8(7):499–509. doi: 10.1038/nrn2168. - DOI - PubMed
    1. Mayne K, White JA, McMurran CE, Rivera FJ, de la Fuente AG. Aging and neurodegenerative disease: is the adaptive immune system a friend or foe? Front Aging Neurosci. 2020;12:572090. doi: 10.3389/fnagi.2020.572090. - DOI - PMC - PubMed
    1. Allen NJ, Eroglu C. Cell biology of astrocyte-synapse interactions. Neuron. 2017;96(3):697–708. doi: 10.1016/j.neuron.2017.09.056. - DOI - PMC - PubMed

MeSH terms

LinkOut - more resources