. 2021 Jun 3;14(1):87.
doi: 10.1186/s13041-021-00794-7.

Atg7 deficiency in microglia drives an altered transcriptomic profile associated with an impaired neuroinflammatory response

Affiliations

Atg7 deficiency in microglia drives an altered transcriptomic profile associated with an impaired neuroinflammatory response

Lara Friess et al. Mol Brain. .

Abstract

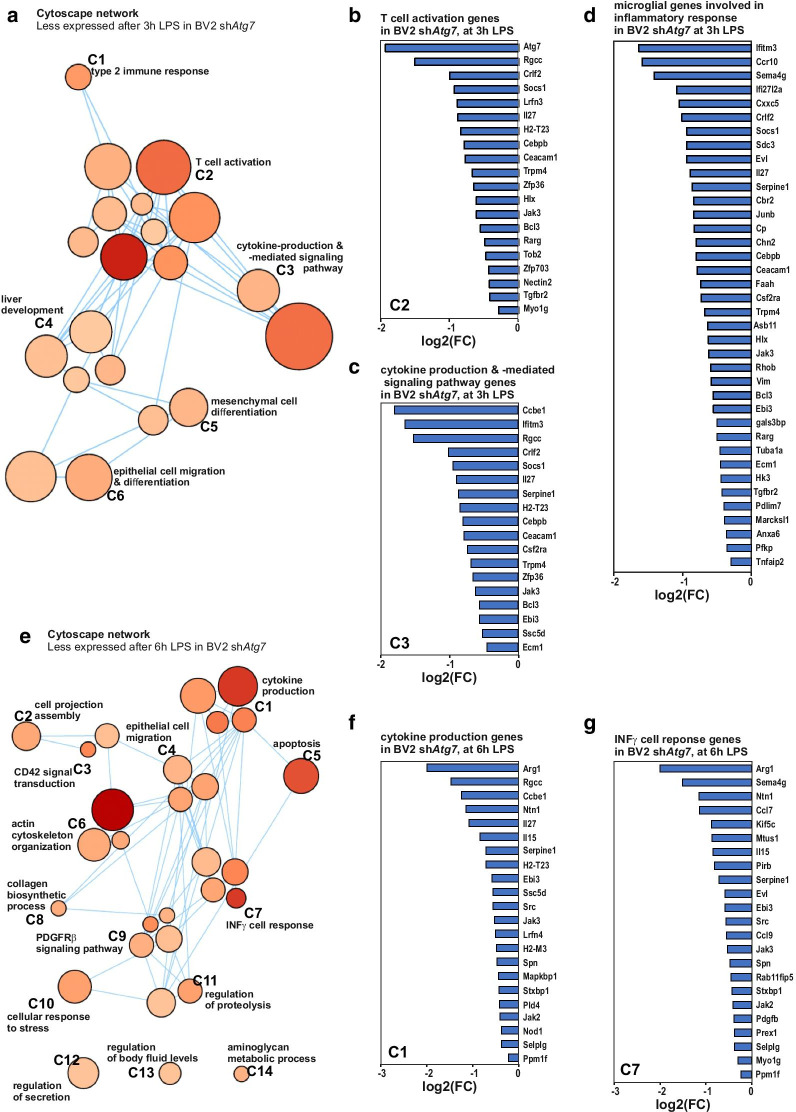
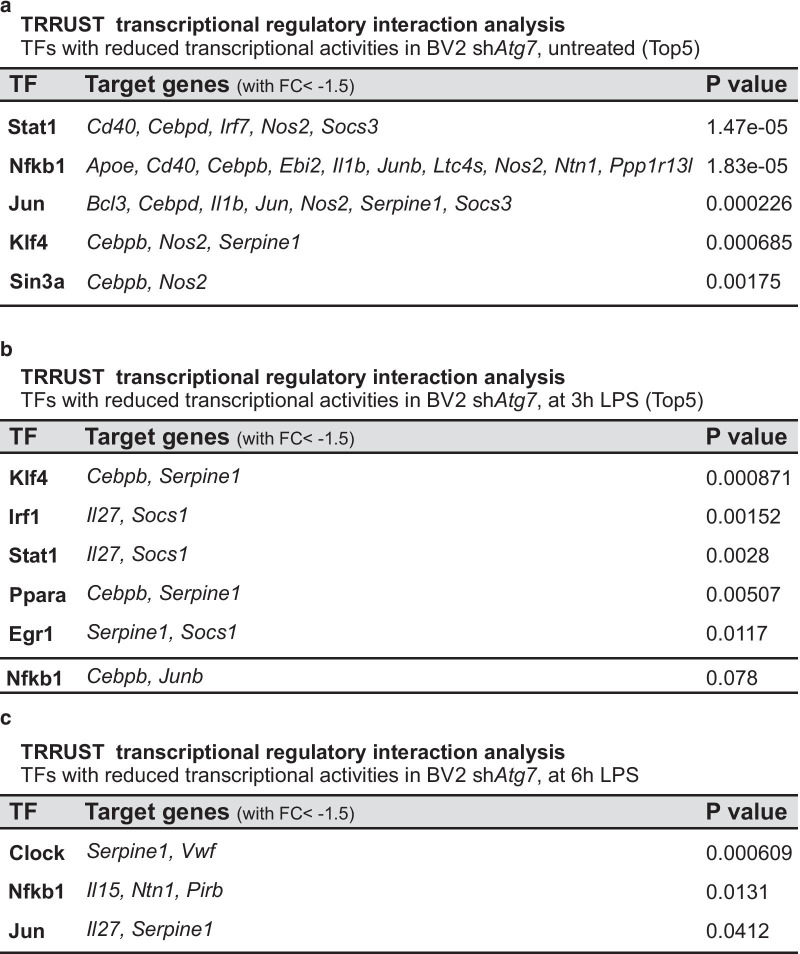
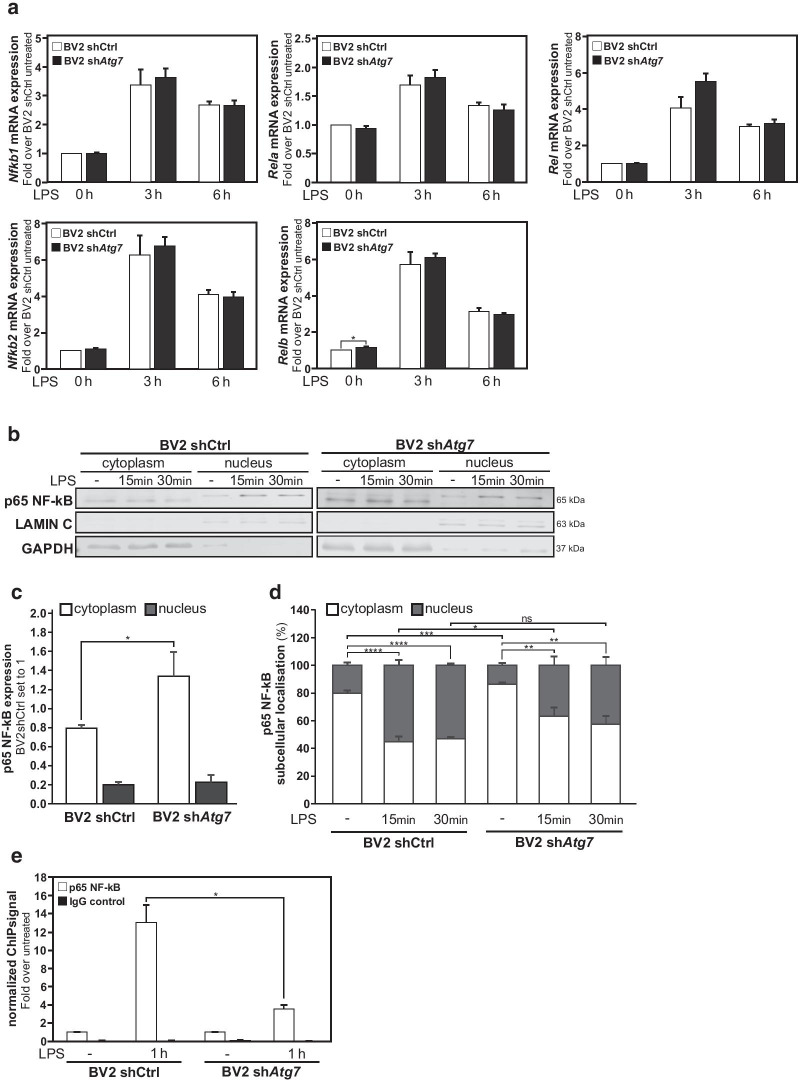
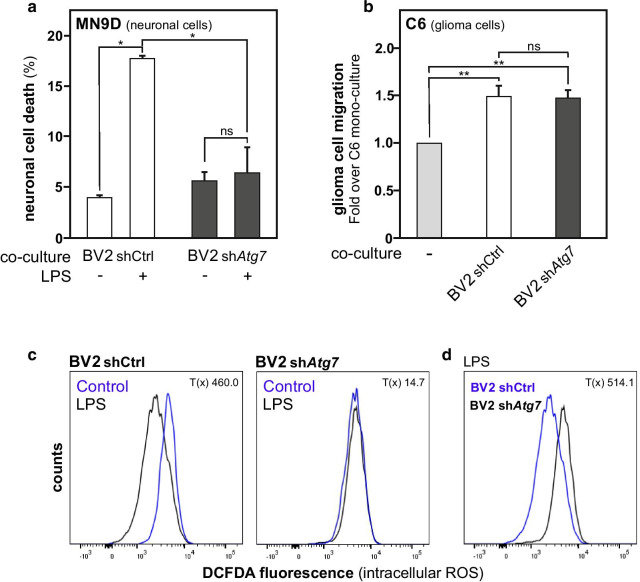
Microglia, resident immunocompetent cells of the central nervous system, can display a range of reaction states and thereby exhibit distinct biological functions across development, adulthood and under disease conditions. Distinct gene expression profiles are reported to define each of these microglial reaction states. Hence, the identification of modulators of selective microglial transcriptomic signature, which have the potential to regulate unique microglial function has gained interest. Here, we report the identification of ATG7 (Autophagy-related 7) as a selective modulator of an NF-κB-dependent transcriptional program controlling the pro-inflammatory response of microglia. We also uncover that microglial Atg7-deficiency was associated with reduced microglia-mediated neurotoxicity, and thus a loss of biological function associated with the pro-inflammatory microglial reactive state. Further, we show that Atg7-deficiency in microglia did not impact on their ability to respond to alternative stimulus, such as one driving them towards an anti-inflammatory/tumor supportive phenotype. The identification of distinct regulators, such as Atg7, controlling specific microglial transcriptional programs could lead to developing novel therapeutic strategies aiming to manipulate selected microglial phenotypes, instead of the whole microglial population with is associated with several pitfalls.

Keywords: Atg7; Inflammatory response; Microglia; NF-κB; Neurotoxicity; Transcriptome.


Conflict of interest statement

The authors declare that they have no competing interests.

Figures

Fig. 1
Fig. 1
Stable knockdown of Atg7 gene expression using small-hairpin RNA in BV2 microglia. a Immunoblot analysis of ATG7 protein expression levels in BV2 microglia cell lines infected with lentivirus expressing a shRNA targeting Atg7 expression (shAtg7 BV2 cells), or with a control scramble shRNA (shCtrl BV2 cells). The expression of ACTB as housekeeping gene was used as loading control. b The graphs show the quantification for ATG7 versus ACTB protein expression ratio in shAtg7 BV2 cells as compared to shCtrl BV2 cells used as control. c Comparison of Atg7 mRNA expression measured by RT-qPCR in shAtg7 BV2 cells and shCtrl BV2 cells. d Immunofluorescence analysis of ATG7 protein expression in shAtg7 BV2 cells and shCtrl BV2 cells. Chromosomal dye Hoechst is used for nuclear counterstaining. Phalloidin staining shows actin filaments (scale bar 50 µM). All values are a mean of three independent experiments ± SEM and considered significant for ****p < 0.0001
Fig. 2
Fig. 2
Atg7 deficiency impairs the microglial response to lipopolysaccharide, but not interleukin 4. a Immunoblot analysis of NOS2 protein expression in shAtg7 and shCtrl BV2 cells. The expression of ACTB as housekeeping gene was used as loading control. Cells were treated with LPS (100 ng/ml) for 3 h or 6 h. b Graphs show the quantification for NOS2 versus ACTB protein expression and in shAtg7 and shCtrl BV2 cells. Values are in comparison to shCtrl BV2 after 3 h LPS. c Comparison of Nos2 mRNA expression measured by RT-qPCR in shAtg7 and shCtrl BV2 cells. d Immunoblot analysis of ARG1 protein expression in shAtg7 and shCtrl BV2 cells. The expression of ACTB as housekeeping gene was used as loading control. Cells were treated with IL-4 (10 ng/ml) for 3 h or 6 h. b Graphs show the quantification for ARG1 versus ACTB protein expression and in shAtg7 and shCtrl BV2 cells. Values are in comparison to untreated shCtrl BV2. c Comparison of Arg1 mRNA expression measured by RT-qPCR in shAtg7 and shCtrl BV2 cells. All values are a mean of 3 (b, f) or 4 (c, e) independent experiments ± SEM and considered significant for *p < 0.05, **p < 0.01. n.s., not significant for the indicated comparison
Fig. 3
Fig. 3
Atg7 deficiency drives an altered transcriptomic profile in microglia. a Heat map of up- and downregulated genes comparing three independent replicates each of the two cell lines shCtrl and shAtg7 BV2 in unstimulated condition. b Volcano plot displaying the fold change in log2 plotted against the FDR in negative log10 in untreated condition. Blue dots represent less expressed genes in shAtg7 BV2 cells with a total fold change of maximally - 2, red dots represent genes that are higher expressed in shAtg7 BV2 cells with a total fold change of at least 2, respectively. Differential gene expression analysis revealed a total of 469 genes higher expressed, and 574 lower expressed in shAtg7 BV2 compared to shCtrl BV2 at baseline. Graphs show the 50 genes with the lowest (c) fold change and the highest (d) fold change in shAtg7 cells compared to shCtrl BV2 in untreated condition. Atg7 is highlighted in orange with a negative log2 fold change of 1.724
Fig. 4
Fig. 4
Gene Ontology network analysis reveals reduced expression of immune response-related genes in Atg7-deficient microglia. a, b Network analysis of enriched GO term clusters generated from differentially expressed genes with significant FDR (< 0.05). Nodes represent GO terms, clusters are nodes grouped based on similarity. Node size corresponds to number of genes. Node color corresponds to the significance of correlation, where the darker the color is, the smaller the FDR values gets. Lines represent the number of genes overlapping between nodes. Less expressed genes (a) versus more expressed (b) in shAtg7 BV2 as compared to shCtrl BV2 at baseline. ce Graphs show the top 30 genes represented in the GO term clusters: c C2 cytokine production and cytokine-mediated signaling pathway; d C6 immune response and e C1 protein modification related genes (additional information about the clusters are available in Additional file 4)
Fig. 5
Fig. 5
Atg7-deficient microglia show an altered transcriptional response to a LPS challenge. Microglial cells, i.e. shAtg7 and shCtrl BV2 cells were treated with LPS (100 ng/ml) for 3 h (ad) or 6 h (eg). Network analysis of enriched GO term clusters generated from differentially expressed genes with significant FDR (< 0.05) that are less expressed in shAtg7 BV2 as compared to shCtrl BV2 at 3 h (a) or 6 h (e) post-treatment with LPS are depicted. Nodes represent GO terms, clusters are nodes grouped based on similarity. Node size corresponds to number of genes. Node color corresponds to the significance of correlation, where the darker the color is, the smaller the FDR values gets. Lines represent the number of genes overlapping between nodes. Graphs show the downregulated genes represented in the GO term clusters: b C2 response cell activation, and c C3 cytokine production and cytokine-mediated signaling pathway related genes in shAtg7 BV2 at 3 h LPS, and f C1 cytokine production and g C7 interferon gamma (INFγ) cell response related genes in shAtg7 BV2 at 6 h LPS, respectively (additional information about the clusters are available in Additional file 4). d Graph shows the expression of genes reported in literature to be involved in the inflammatory response of microglial cells. Genes are differentially expressed at 3 h in LPS-treated shAtg7 BV2 microglia, as compared to the 3 h LPS-treated shCtrl BV2 microglia
Fig. 6
Fig. 6
Microglial Atg7 deficiency is associated with reduced NF-κB-dependent signaling. a TRRUST analysis, which allows the identification of transcription factor potentially involved in cell response based on the expression of their target genes, revealed NFKB1 as transcription factor candidate negatively affected by the microglial Atg7 knockdown. Input genes used exhibited lower expression in shAtg7 as compared to shCtrl BV2 (FC < 1.5 and FDR < 0.05), significance of association is shown with the respective p value. b, c similar TRRUST-based analyses performed at 3 h (b) and 6 h (c) post LPS-treatment likewise indicated a significant negative impact on the transcriptional activity of NFKB1 at 6 h post LPS in shAtg7 BV2 cells as compared to shCtrl BV2 cells
Fig. 7
Fig. 7
Impairment of p65 NF-κB nuclear translocation in Atg7 deficient microglia upon LPS treatment. Microglial cells, i.e. shAtg7 and shCtrl BV2 cells were treated with LPS (100 ng/ml) for 15 min or 30 min. a Comparison of Nfkb1, Nfkb2, Rel, Rel and Relb (NF-κB family members) mRNA expression measured by RT-qPCR in shAtg7 and shCtrl BV2 cells. b Immunoblot analysis of p65 NF-κB catalytic subunit in cytoplasmic versus nuclear subcellular fractions in shAtg7 and shCtrl BV2 cells. The expression of LAMIN C and GAPDH were used as loading controls for cytoplasmic and nuclear fraction, respectively. c Graphs show the quantification for p65 NF-κB protein expression in cytoplasm and nucleus in untreated shAtg7 and shCtrl BV2 cells (total expression in both subcellular fractions set to 1, for shCtrl BV2 cells). d Graphs show the quantification of the percentual localization of total p65 NF-κB protein expression in cytoplasmic versus nuclear fractions in shAtg7 and shCtrl BV2 cells under each condition, i.e. untreated, 15 min or 30 min LPS-treatment. e ChIP analysis of p65 NF-κB enrichment at a Nos2 promoter region encompassing a kB DNA binding site in shAtg7 and shCtrl BV2 cells treated with LPS (100 ng/ml) for 1 h. IgG was used as control. Values are a mean of 3 (e) 4 (a), or 5 (c, d) independent experiments ± SEM and considered significant for *p < 0.05, **p < 0.01, ***p < 0.001, ****p > 0.0001. n.s., not significant for the indicated comparison
Fig. 8
Fig. 8
Microglial Atg7 deficiency is associated with reduced neurotoxicity capability but does not alter tumor migration supporting function. a Neurotoxicity of LPS-treated BV2 cells on dopaminergic MN9D neuronal cells was assessed by co-culturing the neurons with either shCtrl or shAtg7 cells and subsequentially treating them with LPS (100 ng/ml) for 24 h. Neurons, stained with a cell tracker, with abnormal nucleus morphology were counted and displayed in the graph as total cell death in percent for each co-culture condition. b Quantification of the migration of C6 glioma cells in transwells with shCtrl or shAtg7 BV2 microglia. Results are relative compared to the C6 migration in wells without BV2 cells. c Logarithmic display of fluorescence representing intracellular ROS in shCtrl and shAtg7 cells after 1 h of LPS (100 ng/ml) as compared to unstimulated. d Intracellular ROS in shCtrl and shAtg7 cells after 1 h of LPS (100 ng/ml). Values are a mean of 3 (a, b) or 4 (c) independent experiments ± SEM and considered significant for *p < 0.05, **p < 0.01. n.s., not significant for the indicated comparison. c, d Chi square test is shown as statistical value to compare the cell populations in both graphs

Similar articles

Cited by

References

    1. Ginhoux F, Greter M, Leboeuf M, Nandi S, See P, Gokhan S, et al. Fate mapping analysis reveals that adult microglia derive from primitive macrophages. Science. 2010;330:841–845. doi: 10.1126/science.1194637. - DOI - PMC - PubMed
    1. Saijo K, Glass CK. Microglial cell origin and phenotypes in health and disease. Nat Rev Immunol. 2011;11:775–787. doi: 10.1038/nri3086. - DOI - PubMed
    1. Salter MW, Stevens B. Microglia emerge as central players in brain disease. Nat Med. 2017;23:1018–1027. doi: 10.1038/nm.4397. - DOI - PubMed
    1. Tay TL, Savage JC, Hui CW, Bisht K, Tremblay M-È. Microglia across the lifespan: from origin to function in brain development, plasticity and cognition. J Physiol. 2017;595:1929–1945. doi: 10.1113/JP272134. - DOI - PMC - PubMed
    1. Sominsky L, De Luca S, Spencer SJ. Microglia: key players in neurodevelopment and neuronal plasticity. Int J Biochem Cell Biol. 2018;94:56–60. doi: 10.1016/j.biocel.2017.11.012. - DOI - PubMed

Publication types

MeSH terms

LinkOut - more resources