

Unmatched ventilation and perfusion measured by electrical impedance tomography predicts the outcome of ARDS
- PMID: 34082795
- PMCID: PMC8173510
- DOI: 10.1186/s13054-021-03615-4
Unmatched ventilation and perfusion measured by electrical impedance tomography predicts the outcome of ARDS
Abstract
Background: In acute respiratory distress syndrome (ARDS), non-ventilated perfused regions coexist with non-perfused ventilated regions within lungs. The number of unmatched regions might reflect ARDS severity and affect the risk of ventilation-induced lung injury. Despite pathophysiological relevance, unmatched ventilation and perfusion are not routinely assessed at the bedside. The aims of this study were to quantify unmatched ventilation and perfusion at the bedside by electrical impedance tomography (EIT) investigating their association with mortality in patients with ARDS and to explore the effects of positive end-expiratory pressure (PEEP) on unmatched ventilation and perfusion in subgroups of patients with different ARDS severity based on PaO2/FiO2 and compliance.
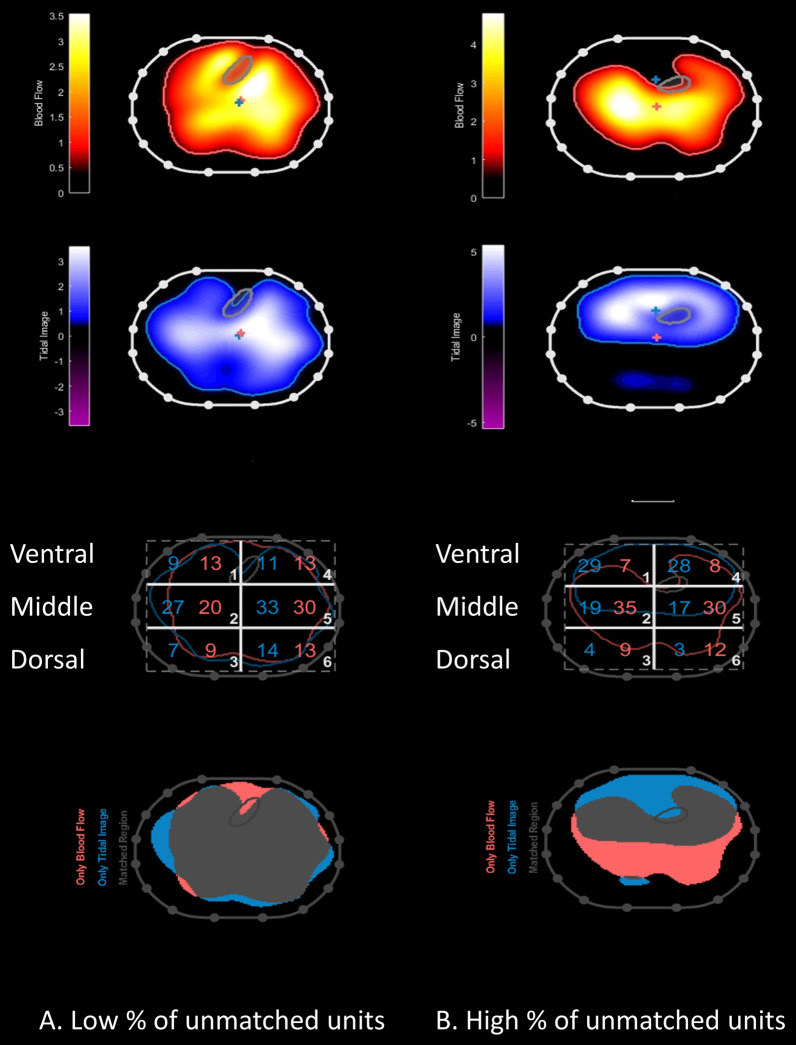
Methods: Prospective observational study in 50 patients with mild (36%), moderate (46%), and severe (18%) ARDS under clinical ventilation settings. EIT was applied to measure the regional distribution of ventilation and perfusion using central venous bolus of saline 5% during end-inspiratory pause. We defined unmatched units as the percentage of only ventilated units plus the percentage of only perfused units.
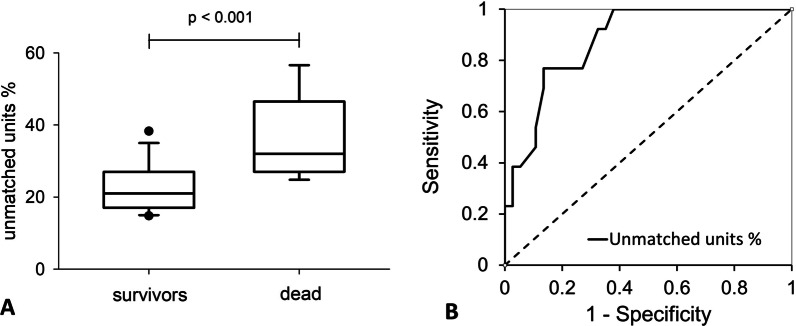
Results: Percentage of unmatched units was significantly higher in non-survivors compared to survivors (32[27-47]% vs. 21[17-27]%, p < 0.001). Percentage of unmatched units was an independent predictor of mortality (OR 1.22, 95% CI 1.07-1.39, p = 0.004) with an area under the ROC curve of 0.88 (95% CI 0.79-0.97, p < 0.001). The percentage of ventilation to the ventral region of the lung was higher than the percentage of ventilation to the dorsal region (32 [27-38]% vs. 18 [13-21]%, p < 0.001), while the opposite was true for perfusion (28 [22-38]% vs. 36 [32-44]%, p < 0.001). Higher percentage of only perfused units was correlated with lower dorsal ventilation (r = - 0.486, p < 0.001) and with lower PaO2/FiO2 ratio (r = - 0.293, p = 0.039).
Conclusions: EIT allows bedside assessment of unmatched ventilation and perfusion in mechanically ventilated patients with ARDS. Measurement of unmatched units could identify patients at higher risk of death and could guide personalized treatment.
Keywords: Acute respiratory distress syndrome; Electrical impedance tomography; Positive end expiratory pressure; Ventilation/perfusion matching.
Conflict of interest statement
Dr. Kircher reports grants from Drager, outside the submitted work. Dr. Pesenti reports personal fees from Maquet, Novalung/Xenios, Baxter, Boehringer Ingelheim, outside the submitted work. Dr Mauri received personal fees from Drager, Fisher and Paykel, BBraun and Mindray, outside the submitted work. Dr Stender is an employee at Drager. Dr. Grasselli reports personal fees from Draeger Medical, Getinge, Fisher & Paykel, Biotest, Thermofisher, outside the submitted work. All other authors have nothing to disclose.
Figures


Similar articles
-
Effects of inhaled nitric oxide on ventilation/perfusion mismatch assessed by electrical impedance tomography in patients with ARDS: a prospective observational study.Crit Care. 2025 Jul 27;29(1):328. doi: 10.1186/s13054-025-05543-z. Crit Care. 2025. PMID: 40717064 Free PMC article.
-
Pathophysiological Markers of Acute Respiratory Distress Syndrome Severity Are Correlated With Ventilation-Perfusion Mismatch Measured by Electrical Impedance Tomography.Crit Care Med. 2025 Jan 1;53(1):e42-e53. doi: 10.1097/CCM.0000000000006458. Epub 2024 Oct 24. Crit Care Med. 2025. PMID: 39445936
-
Influence of overdistension/recruitment induced by high positive end-expiratory pressure on ventilation-perfusion matching assessed by electrical impedance tomography with saline bolus.Crit Care. 2020 Sep 29;24(1):586. doi: 10.1186/s13054-020-03301-x. Crit Care. 2020. PMID: 32993811 Free PMC article.
-
Electrical impedance tomography: A compass for the safe route to optimal PEEP.Respir Med. 2021 Oct;187:106555. doi: 10.1016/j.rmed.2021.106555. Epub 2021 Jul 30. Respir Med. 2021. PMID: 34352563 Review.
-
Lung recruitment maneuvers in acute respiratory distress syndrome and facilitating resolution.Crit Care Med. 2003 Apr;31(4 Suppl):S265-71. doi: 10.1097/01.CCM.0000057902.29449.29. Crit Care Med. 2003. PMID: 12682451 Review.
Cited by
-
Roles of electrical impedance tomography in lung transplantation.Front Physiol. 2022 Nov 3;13:986422. doi: 10.3389/fphys.2022.986422. eCollection 2022. Front Physiol. 2022. PMID: 36407002 Free PMC article. Review.
-
Prone positioning in ARDS patients supported with VV ECMO, what we should explore?J Intensive Care. 2022 Oct 4;10(1):46. doi: 10.1186/s40560-022-00640-5. J Intensive Care. 2022. PMID: 36195935 Free PMC article. Review.
-
Effect of prone positioning on end-expiratory lung volume, strain and oxygenation change over time in COVID-19 acute respiratory distress syndrome: A prospective physiological study.Front Med (Lausanne). 2022 Dec 2;9:1056766. doi: 10.3389/fmed.2022.1056766. eCollection 2022. Front Med (Lausanne). 2022. PMID: 36530873 Free PMC article.
-
Imaging the pulmonary vasculature in acute respiratory distress syndrome.Nitric Oxide. 2024 Jun 1;147:6-12. doi: 10.1016/j.niox.2024.04.004. Epub 2024 Apr 6. Nitric Oxide. 2024. PMID: 38588918 Free PMC article. Review.
-
Effects of inhaled nitric oxide on ventilation/perfusion mismatch assessed by electrical impedance tomography in patients with ARDS: a prospective observational study.Crit Care. 2025 Jul 27;29(1):328. doi: 10.1186/s13054-025-05543-z. Crit Care. 2025. PMID: 40717064 Free PMC article.
