. 2021 Jun 3;23(1):159.
doi: 10.1186/s13075-021-02541-8.

Exosomal circ-BRWD1 contributes to osteoarthritis development through the modulation of miR-1277/TRAF6 axis

Affiliations

Exosomal circ-BRWD1 contributes to osteoarthritis development through the modulation of miR-1277/TRAF6 axis

Zhenye Guo et al. Arthritis Res Ther. .

Abstract

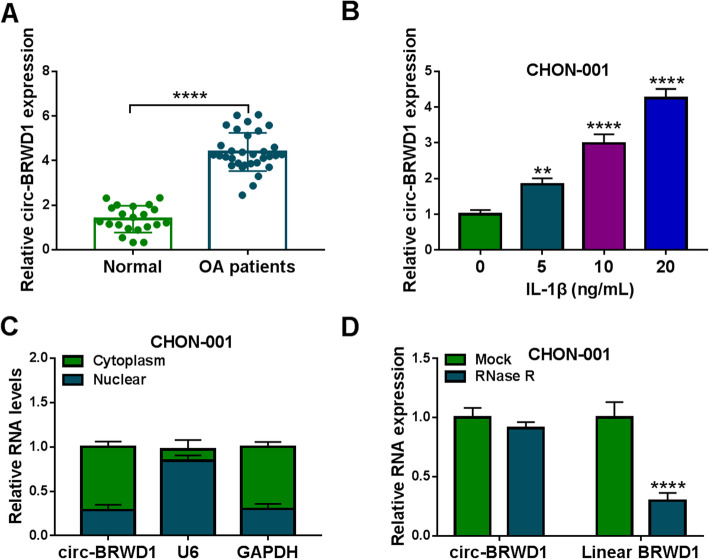
Background: Circular RNAs (circRNAs) can act as vital players in osteoarthritis (OA). However, the roles of circRNAs in OA remain obscure. Herein, we explored the roles of exosomal circRNA bromodomain and WD repeat domain containing 1(circ-BRWD1) in OA pathology.

Methods: In vitro model of OA was constructed by treating CHON-001 cells with interleukin-1β (IL-1β). Quantitative real-time polymerase chain reaction (qRT-PCR) assay was used for circ-BRWD1, BRWD, miR-1277, and TNF receptor-associated factor 6 (TRAF6) levels. RNase R assay was conducted for the feature of circ-BRWD1. Transmission electron microscopy (TEM) was employed to analyze the morphology of exosomes. Western blot assay was performed for protein levels. Cell Counting Kit-8 (CCK-8) assay, flow cytometry analysis, and 5-Ethynyl-2'-deoxyuridine (EDU) assay were adopted for cell viability, apoptosis, and proliferation, respectively. Enzyme-linked immunosorbent assay (ELISA) was carried out for the concentrations of interleukin-6 (IL-6) and interleukin-8 (IL-8). Dual-luciferase reporter and RNA immunoprecipitation (RIP) assays were used to analyze the interaction between miR-1277 and circ-BRWD1 or TRAF6.

Results: Circ-BRWD1 was increased in OA cartilage tissues, IL-1β-treated CHON-001 cells, and the exosomes derived from IL-1β-treated CHON-001 cells. Exosome treatment elevated circ-BRWD1 level, while exosome blocker reduced circ-BRWD1 level in IL-1β-treated CHON-001 cells. Silencing of circ-BRWD1 promoted cell viability and proliferation and repressed apoptosis, inflammation, and extracellular matrix (ECM) degradation in IL-1β-stimulated CHON-001 cells. For mechanism analysis, circ-BRWD1 could serve as the sponge for miR-1277 to positively regulate TRAF6 expression. Moreover, miR-1277 inhibition ameliorated the effects of circ-BRWD1 knockdown on IL-1β-mediated CHON-001 cell damage. Additionally, miR-1277 overexpression relieved IL-1β-induced CHON-001 cell injury, while TRAF6 elevation restored the impact.

Conclusion: Exosomal circ-BRWD1 promoted IL-1β-induced CHON-001 cell progression by regulating miR-1277/TRAF6 axis.

Keywords: Circ-BRWD1; Exosome; MiR-1277; OA; TRAF6.


Conflict of interest statement

The authors declare that they have no competing interests.

Figures

Fig. 1
Fig. 1
High level of circ-BRWD1 in OA cartilage tissues and IL-1β-induced CHON-001 cells. A QRT-PCR assay was conducted for circ-BRWD1 level in OA and non-OA cartilage tissues. B QRT-PCR assay was employed to determine circ-BRWD1 level in different doses of IL-1β-treated CHON-001 cells. C QRT-PCR assay was used for the expression of circ-BRWD1 in the nuclear and cytosolic fractions of CHON-001 cells. D QRT-PCR assay was used to determine the expression levels of circ-BRWD1 and linear BRWD1 in CHON-001 cells treated with or without RNase R. The expression of circ-BRWD1 and BRWD1 was examined by 2-ΔΔCt method with normalization to GAPDH. **P < 0.001, ****P < 0.0001
Fig. 2
Fig. 2
Circ-BRWD1 level was increased in IL-1β-treated CHON-001 cells-derived exosomes. A The morphology of isolated particles was analyzed using TEM. B The protein levels of CD9 and CD63 were measured by western blot assay. C The level of circ-BRWD1 in the exosomes derived from IL-1β-treated CHON-001 cells was examined by qRT-PCR assay. D Exosomes derived from IL-1β-treated CHON-001 cells were added into CHON-001 cells and then circ-BRWD1 level in CHON-001 cells was determined by qRT-PCR assay. E After IL-1β-treated CHON-001 cells were treated with or without GW4869 for 2 h and then exposed to IL-1β, the expression level of circ-BRWD1 was determined by qRT-PCR assay. The expression of circ-BRWD1 was examined by 2-ΔΔCt method with normalization to GAPDH. **P < 0.01, ***P < 0.001, ****P < 0.0001
Fig. 3
Fig. 3
Knockdown of circ-BRWD1 reversed IL-1β-mediated cell viability, apoptosis, inflammation and ECM degradation in CHON-001 cells. A The expression level of circ-BRWD1 in IL-1β, IL-1β+si-NC, or IL-1β+si-circ-BRWD1 treated CHON-001 cells or untreated cells (control) was determined by qRT-PCR assay. B The viability of CHON-001 cells in different doses of IL-1β-treated CHON-001 cells was evaluated by CCK-8 assay. C–F CHON-001 cells were assigned to 4 groups: control, IL-1β, IL-1β+si-NC, and IL-1β+si-circ-BRWD1. C, D The viability and apoptosis of CHON-001 cells were analyzed by CCK-8 assay and flow cytometry analysis, respectively. E The proliferation of CHON-001 cells was assessed by western blot assay. F The protein levels of CyclinD1 and Bax in CHON-001 cells were measured by western blot assay. G The concentrations of IL-6 and IL-8 in CHON-001 cells were examined by ELISA. H The protein levels of MMP13 and aggrecan in CHON-001 cells were measured by western blot assay. The expression of circ-BRWD1 was examined by 2-ΔΔCt method with normalization to GAPDH. *P < 0.05, **P < 0.01, ***P < 0.001, ****P < 0.0001
Fig. 4
Fig. 4
Circ-BRWD1 directly targeted miR-1277 and negatively regulated miR-1277 expression in IL-1β-stimulated CHON-001 cells. A The predicted binding sites between circ-BRWD1 and miR-1277. B The luciferase activity in CHON-001 cells co-transfected with miR-NC/miR-1277 and WT-circ-BRWD1/MUT-circ-BRWD1 was measured by dual-luciferase reporter assay. C The enrichment of miR-1277 and circ-BRWD1 in CHON-001 cells was determined by qRT-PCR assay following RIP assay. D, E The expression level of miR-1277 in OA cartilage tissues and IL-1β-stimulated CHON-001 cells was examined by qRT-PCR assay. F The linear correlation between circ-BRWD1 and miR-1277 in OA cartilage tissues was analyzed by Pearson’s correlation coefficient analysis. G The expression level of circ-BRWD1 in IL-1β, IL-1β+pCD5-ciR or IL-1β+circ-BRWD1 treated CHON-001 cells and control cells was detected by qRT-PCR assay. H The level of miR-1277 in IL-1β, IL-1β+si-NC, IL-1β+si-circ-BRWD1, IL-1β+pCD5-ciR, or IL-1β+circ-BRWD1 treated CHON-001 cells and control cells was examined by qRT-PCR assay. The expression of miR-1277 was examined by 2-ΔΔCt method with normalization to U6. *P < 0.05, **P < 0.01, ***P < 0.001, ****P < 0.0001
Fig. 5
Fig. 5
Circ-BRWD1 silencing promoted cell viability and inhibited apoptosis, inflammation and ECM degradation in IL-1β-stimulated CHON-001 cells by binding to miR-1277. CHON-001 cells were assigned to control, IL-1β, IL-1β+si-NC, IL-1β+si-circ-BRWD1, IL-1β+si-circ-BRWD1+anti-miR-NC, and IL-1β+si-circ-BRWD1+anti-miR-1277 groups. A QRT-PCR assay was adopted for miR-1277 level in CHON-001 cells. BD The viability and apoptosis of CHON-001 cells were evaluated by CCK-8 assay and flow cytometry analysis, respectively. E The proliferation of CHON-001 cells was assessed by EDU assay. F The protein levels of CyclinD1 and Bax were measured by western blot assay. G ELISA was conducted for the levels of IL-6 and IL-8 in CHON-001 cells. H Western blot assay was carried out for the protein levels of MMP13 and aggrecan in CHON-001 cells. The expression of miR-1277 was examined by 2-ΔΔCt method with normalization to U6. *P < 0.05, **P < 0.01, ***P < 0.001, ****P < 0.0001
Fig. 6
Fig. 6
TRAF6 was directly targeted by miR-1277. A The predicted binding sites between TRAF6 and miR-1277. B, C The interaction between miR-1277 and TRAF6 was analyzed by dual-luciferase reporter assay and RIP assay. D, E The mRNA and protein levels of TRAF6 in OA cartilage tissues and normal cartilage tissues were determined by qRT-PCR assay and western blot assay, respectively. F The protein level of TRAF6 in different concentrations of IL-1β-treated CHON-001 cells was measured by western blot assay. G The correlation between miR-1277 and TRAF6 in OA cartilage tissues was evaluated by Pearson’s correlation coefficient analysis. H, I The levels of miR-1277 and TRAF6 protein in IL-1β, IL-1β+miR-NC, IL-1β+miR-1277, IL-1β+anti-miR-NC, or IL-1β+anti-miR-1277 treated CHON-001 cells or untreated CHON-001 cells were measured by qRT-PCR assay and western blot assay, respectively. TRAF6 mRNA expression and miR-1277 expression were examined by 2-ΔΔCt method with normalization to GAPDH and U6, respectively. *P < 0.05, **P < 0.01, ***P < 0.001, ****P < 0.0001
Fig. 7
Fig. 7
Relationship between miR-1277 and TRAF6 in regulating IL-1β-mediated CHON-001 cell viability, apoptosis, inflammation and ECM degradation. CHON-001 cells were divided into 6 groups: control, IL-1β+miR-NC, IL-1β+miR-1277, IL-1β+miR-1277+pcDNA and IL-1β+miR-1277+TRAF6. A Western blot assay was utilized for TRAF6 protein level in each group. BE CCK-8 assay, flow cytometry analysis and EDU assay were conducted for the viability, apoptosis and proliferation of CHON-001 cells. F The protein levels of CyclinD1 and Bax in CHON-001 cells were measured via western blot assay. G ELISA kits were used for the concentrations of IL-6 and IL-8 in CHON-001 cells. H Western blot assay was employed for the protein levels of MMP13 and aggrecan in CHON-001 cells. *P < 0.05,**P < 0.01, ***P < 0.001, ****P < 0.0001
Fig. 8
Fig. 8
Circ-BRWD1 positively regulated TRAF8 expression by targeting miR-1277 in IL-1β-treated CHON-001 cells. A, B The mRNA and protein levels of TRAF6 in IL-1β, IL-1β+si-NC, IL-1β+si-circ-BRWD1, IL-1β+si-circ-BRWD1+anti-miR-NC, or IL-1β+si-circ-BRWD1+anti-miR-1277 treated or untreated CHON-001 cells were determined by qRT-PCR assay and western blot assay, respectively. TRAF6 mRNA expression was examined by 2-ΔΔCt method with normalization to GAPDH. *P < 0.05, ***P < 0.001, ****P < 0.0001
Fig. 9
Fig. 9
The schematic diagram of exosomal circ-BRWD1 in regulating chondrocyte growth, inflammation, and ECM degradation

Similar articles

Cited by

References

    1. van der Kraan PM. Osteoarthritis year 2012 in review: biology. Osteoarthr Cartil. 2012;20(12):1447–1450. doi: 10.1016/j.joca.2012.07.010. - DOI - PubMed
    1. Glyn-Jones S, Palmer AJ, Agricola R, Price AJ, Vincent TL, Weinans H, et al. Osteoarthritis. Lancet. 2015;386(9991):376–387. doi: 10.1016/S0140-6736(14)60802-3. - DOI - PubMed
    1. Dreier R. Hypertrophic differentiation of chondrocytes in osteoarthritis: the developmental aspect of degenerative joint disorders. Arthritis Res Ther. 2010;12(5):216. doi: 10.1186/ar3117. - DOI - PMC - PubMed
    1. Rahmati M, Nalesso G, Mobasheri A, Mozafari M. Aging and osteoarthritis: central role of the extracellular matrix. Ageing Res Rev. 2017;40:20–30. doi: 10.1016/j.arr.2017.07.004. - DOI - PubMed
    1. Honvo G, Reginster JY, Rabenda V, Geerinck A, Mkinsi O, Charles A, Rizzoli R, Cooper C, Avouac B, Bruyère O. Safety of symptomatic slow-acting drugs for osteoarthritis: outcomes of a systematic review and meta-analysis. Drugs Aging. 2019;36(Suppl 1):65–99. doi: 10.1007/s40266-019-00662-z. - DOI - PMC - PubMed