. 2021 Sep;80(9):1190-1200.
doi: 10.1136/annrheumdis-2021-220349. Epub 2021 Jun 3.

B cell subset composition segments clinically and serologically distinct groups in chronic cutaneous lupus erythematosus

Affiliations

B cell subset composition segments clinically and serologically distinct groups in chronic cutaneous lupus erythematosus

Scott A Jenks et al. Ann Rheum Dis. 2021 Sep.

Erratum in

Abstract

Objective: While the contribution of B-cells to SLE is well established, its role in chronic cutaneous lupus erythematosus (CCLE) remains unclear. Here, we compare B-cell and serum auto-antibody profiles between patients with systemic lupus erythematosus (SLE), CCLE, and overlap conditions.

Methods: B-cells were compared by flow cytometry amongst healthy controls, CCLE without systemic lupus (CCLE+/SLE-) and SLE patients with (SLE+/CCLE+) or without CCLE (SLE+/CCLE-). Serum was analyed for autoreactive 9G4+, anti-double-stranded DNA, anti-chromatin and anti-RNA antibodies by ELISA and for anti-RNA binding proteins (RBP) by luciferase immunoprecipitation.

Results: Patients with CCLE+/SLE- share B-cell abnormalities with SLE including decreased unswitched memory and increased effector B-cells albeit at a lower level than SLE patients. Similarly, both SLE and CCLE+/SLE- patients have elevated 9G4+ IgG autoantibodies despite lower levels of anti-nucleic acid and anti-RBP antibodies in CCLE+/SLE-. CCLE+/SLE- patients could be stratified into those with SLE-like B-cell profiles and a separate group with normal B-cell profiles. The former group was more serologically active and more likely to have disseminated skin lesions.

Conclusion: CCLE displays perturbations in B-cell homeostasis and partial B-cell tolerance breakdown. Our study demonstrates that this entity is immunologically heterogeneous and includes a disease segment whose B-cell compartment resembles SLE and is clinically associated with enhanced serological activity and more extensive skin disease. This picture suggests that SLE-like B-cell changes in primary CCLE may help identify patients at risk for subsequent development of SLE. B-cell profiling in CCLE might also indentify candidates who would benefit from B-cell targeted therapies.

Keywords: B-lymphocytes; autoantibodies; autoimmunity; lupus erythematosus; systemic.


Conflict of interest statement

Competing interests: None declared.

Figures
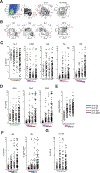
Figure 1
Figure 1
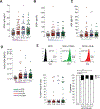
Perturbations of B cell homeostasis in patients with CCLE and SLE. (A) Gating scheme for the flow cytometer analysis of human B cells for a representative SLE sample. CD19+, CD3− B cells are divided into IgD+CD27− naive plus transitional (N+T), IgD+CD27+ USM, IgD−CD27+ memory plus plasmablasts (PB) SM+PB and IgD−CD27− DN, PB were gated as IgD−CD27++CD38++. (B) Separation of DN into DN1 (CD21+CD11c−), DN2 (CD21−CD11c+) and DN3 (CD21−CD11c−). aN were gated from N+T based on CD21−CD11c+. High CD24 and CD38 expression was used to gate transitional (T1+T2). (C) B cell subset frequencies were compared among healthy controls (HCD, n=46), primary CCLE (C+S−, n=69), SLE overlapped with CCLE (S+C+, n=53) and SLE without CCLE (S+C−, n=85). Short horizontal lines indicate the median. The frequency of PB (IgD−CD27++CD38++) was subtracted from that of the IgD−CD27+ compartment to derive the proportion of SM. (D) The percentage of DN1, DN2 and DN3 as a proportion of CD19+. (E) Relative frequencies of DN2 to DN1 is expressed as the log2 transformed ratio of DN2 to DN1. (F) The percentage of aN as proportion of CD19+ and total naive. (G) The percentage of T1+T2 as a proportion of total CD19+. Bars beneath each plot indicate the statistical significance as determined by a Kruskal-Wallis test followed by Dunn’s multiple comparisons test with p<0.05 (green), p<0.01 (blue), p<0.001 (red), p<0.0001 (dark purple). aN, activated naive; CCLE, chronic cutaneous lupus erythematosus; DN, double negative; PB, plasmablasts; SLE, systemic lupus erythematosus; USM, unswitched memory.
Figure 2
Figure 2
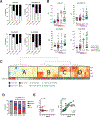
B cell fingerprint of patients with CCLE+/SLE−, SLE+/CCLE+ and SLE+/CCLE−. (A) Hierarchical clustering of samples by B cell subset frequency. Patients are clustered on the top and diagnosis is indicated by colour underneath. B cell subsets are clustered on the right. Patients were divided into five groups as indicated by Roman numeral (I–V). (B) Group distribution for different diagnostic categories, the distribution of patients with CCLE+/SLE− significantly differed from that of SLE+/CCLE+ and SLE+/CCLE−. The majority of SLE+/CCLE+ and SLE+/CCLE− samples were in groups I and II, while HCD samples were only found in groups III and IV. More patients with CCLE+/SLE− were in the HCD-enriched groups III and IV and fewer in SLE-enriched groups I and II. χ2 test was used to compare frequencies, because no HCD clustered in I,II and V χ2 tests comparing HCD to patients with lupus were not performed. (C) Principal component plot with cluster group indicated by colour and loading vectors for each B cell subset indicated. X2 test: **p<0.001. CCLE, chronic cutaneous lupus erythematosus; HCD, healthy controls; SLE, systemic lupus erythematosus
Figure 3
Figure 3
Like in patients with SLE, autoreactive 9G4+ autoantibodies are increased in the serum of patients with CCLE+/SLE−. (A) 9G4+ IgG is increased in in all three groups relative to HCD. (B) 9G4+ IgA is also increased in patients with lupus. (C) 9G4+ IgM was only significantly elevated in the SLE+/CCLE−. (D) 9G4+ AACA are found in the serum of both patients with SLE and CCLE. 9G4 Median fluorescence intensity (MDFI) of apoptotic Jurkat cells are shown after incubation with patient serum. (E) 9G4+ autoreactive antibodies that bind B cells are present in both patients with SLE and CCLE. On top representative 9G4 staining for naive B cells is shown. In HCD only the minor population of Vh4.34 expressing cells are 9G4+, in some patients with SLE+/CCLE− and CCLE+/SLE− almost all naive B cells are 9G4+ due to surface bound anti-B cell antibodies. Below left the frequency of naive B cells that are 9G4+ is shown. Below right the proportion of patients with elevated 9G4+ IgG, IgA or IgM that have greater than 11% naive 9G4+ B cells is shown. Kruskal-Wallis test followed by Dunn’s multiple comparisons test: p<0.05 (green), p<0.01 (blue), p<0.001 (red), p<0.0001 (dark purple); Fischer’s exact test: *p<0.05, **p<0.01. AACA, anti-apoptotic cell antibodies; CCLE, chronic cutaneous lupus erythematosus; HCD, healthy controls; SLE, systemic lupus erythematosus.
Figure 4
Figure 4
Antinucleic acid antibodies are decreased in patients with CCLE+SLE− relative to patients with SLE and are not correlated with 9G4+ IgG. (A) Anti-dsDNA IgG is decreased in CCLE+/SLE− relative to SLE+/CCLE− and patients with SLE+/CCLE+. (B) Antichromatin IgG is also decreased in CCLE+/SLE− relative to SLE. (C) Anti-dsDNA IgG and antichromatin IgG are correlated in both patients with CCLE+/SLE− (left) and SLE (right). (D) 9G4+ IgG is highly correlated with anti-dsDNA IgG in patients with SLE+CCLE and SLE+CCLE+ but not patients with CCLE+/SLE−. (E) Similarly, antichromatin IgG is correlated with 9G4+ IgG only in patients with SLE. (F) Anti-RNA IgG is increased in patients with CCLE+/SLE−, SLE+/CCLE− and SLE+/CCLE+ but is significantly higher in SLE+/CCLE− and SLE+/CCLE+ than CCLE+/SLE−. Kruskal-Wallis test followed by Dunn’s multiple comparisons test: p<0.05 (green), p<0.01 (blue), p<0.001 (red), p<0.0001 (dark purple); Pearson correlation coefficient r and p are shown. CCLE, chronic cutaneous lupus erythematosus; dsDNA, double-stranded DNA; SLE, systemic lupus erythematosus.
Figure 5
Figure 5
Anti-RNA-binding protein antibodies are elevated in patients with SLE relative to CCLE+/SLE−. (A) The frequency of positive samples for each of the indicated antigen specificities as determined by LIPS for HCD and each patient group. Samples were considered positive if they were higher than the mean value of HCD+3SD. (B) Anti-Sm, anti-RNP, anti-Ro52 and anti-Ro60 levels as assayed by LIPS and expressed as arbitrary units, median values are indicated by the red line, the Kruskal-Wallis test was used to compare each group, p values>0.05 are indicated by colour lines underneath for each comparison. The dashed line indicates the threshold that was considered positive. (C) Hierarchical clustering of luciferase immunoprecipitation system (LIPS) assay values, samples are clustered by patient on top and antigen on the left, diagnosis is indicated by colour underneath. Samples can be grouped into four patterns of reactivity as indicated by letter. (D) Distribution of patients and HCD across the four groups from C above. Differences in distribution between the three patient groups were analysed using the χ2 test. (E) Anti-Sm and anti-RNP plotted for CCLE+/SLE− (left) or SLE+/CCLE+ and SLE+/CCLE− (right). Kruskal-Wallis test followed by Dunn’s multiple comparisons test: p<0.05 (green), p<0.01 (blue), p<0.001 (red), p<0.0001 (dark purple); Spearman correlation coefficient r and p is shown; X2 test: *p<0.05, **p<0.001, ***p<0.0001. CCLE, chronic cutaneous lupus erythematosus; HCD, healthy controls; SLE, systemic lupus erythematosus.
Figure 6
Figure 6
Patients with primary CCLE with a SLE-like B cell subset composition are serologically and clinically distinct from patients with CCLE that resemble HCD. (A) Primary CCLE from clusters III and IV (figure 2A) that resemble patients with SLE (red) are less likely than those from clusters I and II that resemble HCD (blue) to be male (left) and more likely to have generalised skin lesions above and below the neck (right). (B) Frequency of historical anti-nuclear antibody (ANA) reactivity in patients with primary CCLE with a SLE-like (red) or HCD-like B cell subset composition (blue). (C) Frequency of historical anti-dsDNA, anti-Ro and anti-La reactivity in patients with primary CCLE with a lupus-like (red) or HCD-like B cell subset composition (blue). (D) Frequency of anti-dsDNA and antichromatin reactivity at the time of flow analysis for patients with primary CCLE with a Lupus-like (red) or HCD-like B cell subset composition (blue). (E) Anti-RNA protein-binding reactivity as assayed by LIPS in patients with primary CCLE with a Lupus-like (red) or HCD-like B cell subset composition (blue) at the time of flow analysis. The Mann-Whitney test was used to compare distributions; (*p<0.05; **p<0.005). Fischer’s exact test was used to analyse differences in frequencies as indicated by the p value. CCLE, chronic cutaneous lupus erythematosus; dsDNA, double-stranded DNA; HCD, healthy controls; SLE, systemic lupus erythematosus.

Similar articles

Cited by

References

    1. Yazdany JDE M Definition and Classification of Lupus and Lupus-Related Disorders. In: Wallace DHB, ed. Dubois’ Lupus Erythematosus. 9th ed. Philadelphia: Elsevier, 2018: 15–22.
    1. Rothfield N, Sontheimer RD, Bernstein M. Lupus erythematosus: systemic and cutaneous manifestations. Clin Dermatol 2006;24:348–62. - PubMed
    1. Werth VP. Clinical manifestations of cutaneous lupus erythematosus. Autoimmun Rev 2005;4:296–302. - PubMed
    1. Chong BF. Understanding how cutaneous lupus erythematosus progresses to systemic lupus erythematosus. JAMA Dermatol 2014;150:296. - PubMed
    1. Grönhagen CM, Fored CM, Granath F, et al. Cutaneous lupus erythematosus and the association with systemic lupus erythematosus: a population-based cohort of 1088 patients in Sweden. Br J Dermatol 2011;164:1335–41. - PubMed

Publication types

MeSH terms