. 2021 Aug 1;27(15):4397-4409.
doi: 10.1158/1078-0432.CCR-20-5026. Epub 2021 Jun 3.

Modeling Clinical Responses to Targeted Therapies by Patient-Derived Organoids of Advanced Lung Adenocarcinoma

Affiliations

Modeling Clinical Responses to Targeted Therapies by Patient-Derived Organoids of Advanced Lung Adenocarcinoma

Seok-Young Kim et al. Clin Cancer Res. .

Abstract

Purpose: Patient-derived organoids (PDO) of lung cancer has been recently introduced, reflecting the genomic landscape of lung cancer. However, clinical relevance of advanced lung adenocarcinoma organoids remains unknown. Here, we examined the ability of PDOs to predict clinical responses to targeted therapies in individual patients and to identify effective anticancer therapies for novel molecular targets.

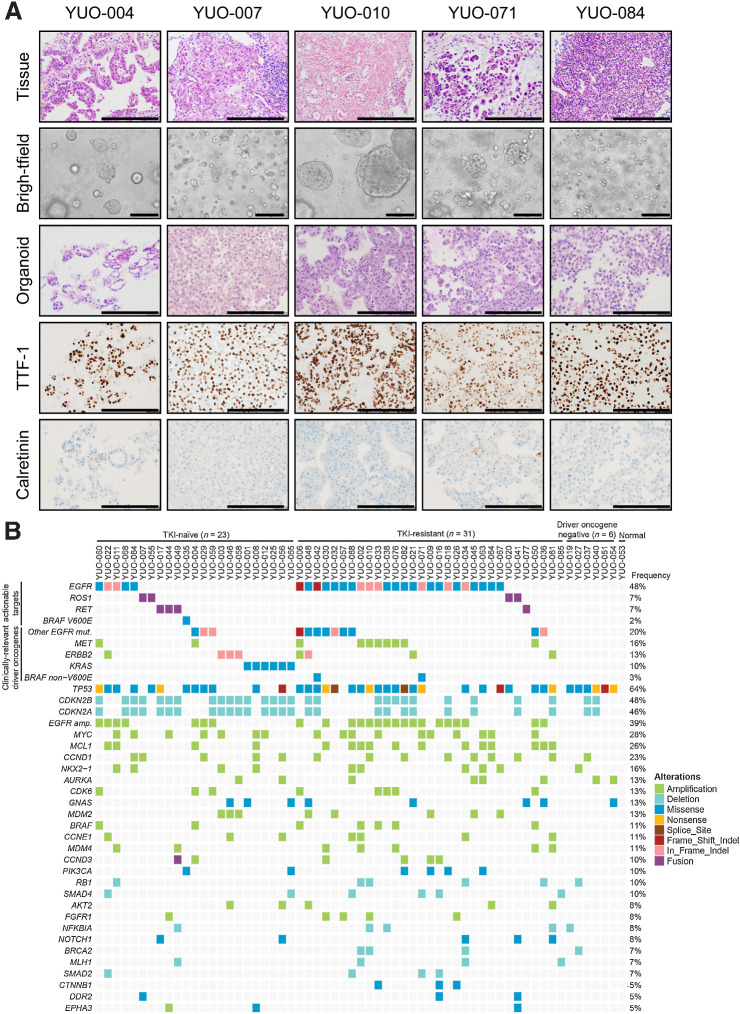
Experimental design: Eighty-four organoids were established from patients with advanced lung adenocarcinoma. Formalin-fixed, paraffin-embedded tumor specimens from corresponding patients were analyzed by whole-exome sequencing (n = 12). Organoids were analyzed by whole-exome sequencing (n = 61) and RNA sequencing (n = 55). Responses to mono or combination targeted therapies were examined in organoids and organoid-derived xenografts.

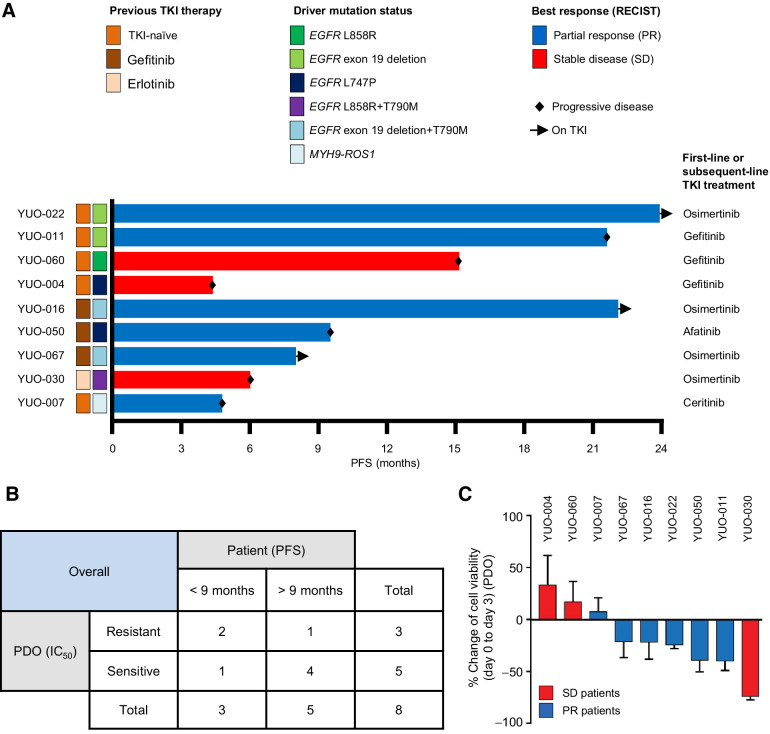
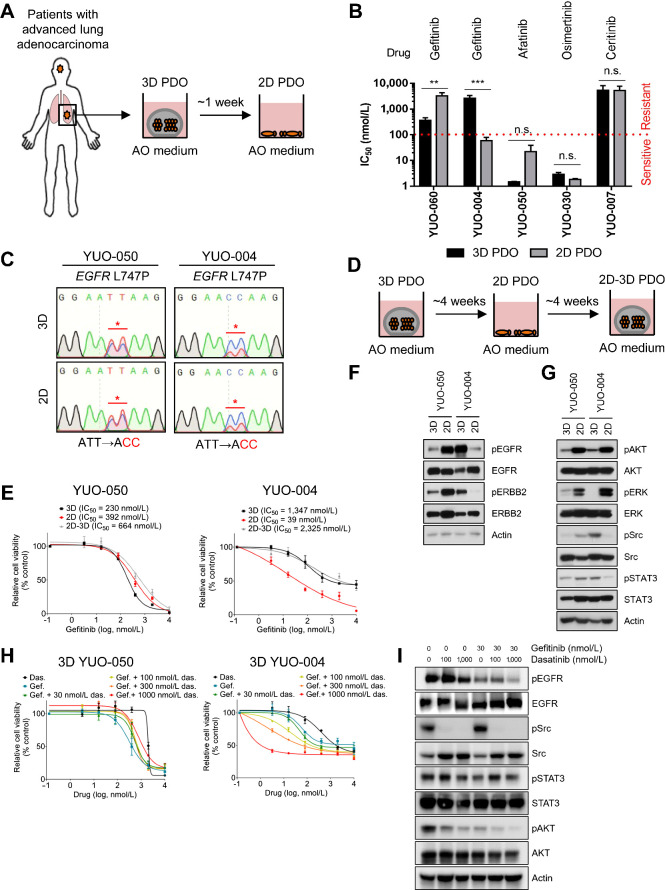
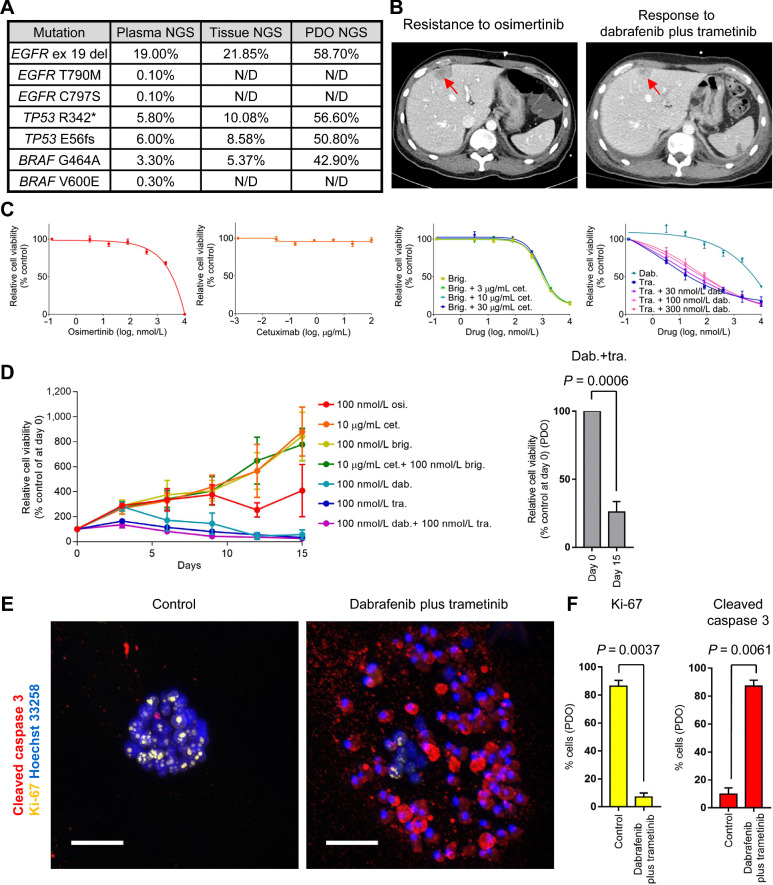
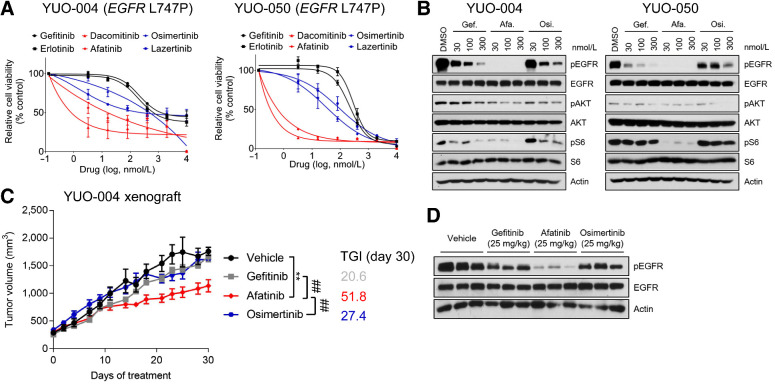
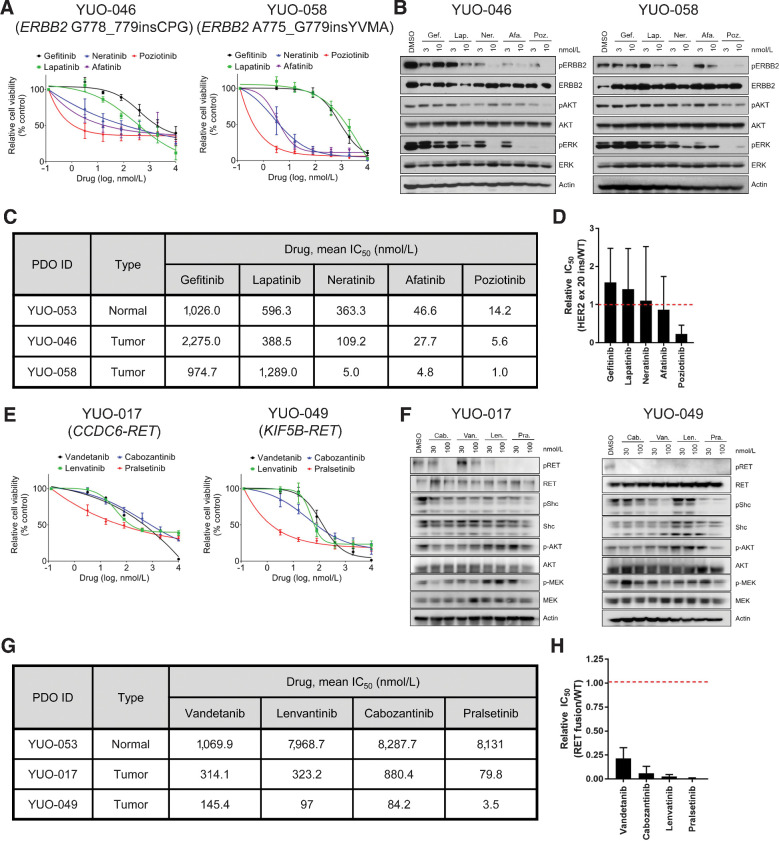
Results: PDOs largely retained somatic alterations including driver mutations of matching patient tumors. PDOs were able to recapitulate progression-free survival and objective responses of patients with non-small cell lung cancer receiving clinically approved tyrosine kinase inhibitors. PDOs recapitulated activity of therapeutic strategies under clinical investigation. YUO-071 harboring an EGFR exon 19 deletion and a BRAF G464A mutation and the matching patient responded to dabrafenib/trametinib combination therapy. YUO-004 and YUO-050 harboring an EGFR L747P mutation was sensitive to afatinib, consistent with the response in the matching patient of YUO-050. Furthermore, we utilized organoids to identify effective therapies for novel molecular targets by demonstrating the efficacy of poziotinib against ERBB2 exon 20 insertions and pralsetinib against RET fusions.

Conclusions: We demonstrated translational relevance of PDOs in advanced lung adenocarcinoma. PDOs are an important diagnostic tool, which can assist clinical decision making and accelerate development of therapeutic strategies.


Figures

Figure 1. Establishment and characterization of patient-derived organoids from advanced lung adenocarcinoma. A, Representative H&E and IHC stained images of NSCLC organoids and their parental tumor tissues. The tumor organoids were positive for TTF-1, an adenocarcinoma marker, and negative for Calrectinin, a mesothelial cell marker. NSCLC organoids recapitulated morphologic and histologic features of original tumor tissues. H&E, brightfield, and IHC images are shown. Scale bar, 100 μm. B, Genomic landscape in 61 patient-derived organoids of advanced lung adenocarcinoma. Organoids were derived from TKI-naïve NSCLC, TKI-resistant NSCLC, NSCLC without driver oncogenes, and normal tissue. Clinically relevant somatic alterations selected from the TARGET database are shown. Actionable targets and clinically relevant driver genes based on the NCCN guideline (version 8.2020) and the lung adenocarcinoma TCGA database are indicated (left). Type of alteration is indicated by color codes. The percentage of organoids harboring the indicated alterations are shown (right).
Figure 1.
Establishment and characterization of patient-derived organoids from advanced lung adenocarcinoma. A, Representative H&E and IHC stained images of NSCLC organoids and their parental tumor tissues. The tumor organoids were positive for TTF-1, an adenocarcinoma marker, and negative for Calrectinin, a mesothelial cell marker. NSCLC organoids recapitulated morphologic and histologic features of original tumor tissues. H&E, brightfield, and IHC images are shown. Scale bar, 100 μm. B, Genomic landscape in 61 patient-derived organoids of advanced lung adenocarcinoma. Organoids were derived from TKI-naïve NSCLC, TKI-resistant NSCLC, NSCLC without driver oncogenes, and normal tissue. Clinically relevant somatic alterations selected from the TARGET database are shown. Actionable targets and clinically relevant driver genes based on the NCCN guideline (version 8.2020) and the lung adenocarcinoma TCGA database are indicated (left). Type of alteration is indicated by color codes. The percentage of organoids harboring the indicated alterations are shown (right).
Figure 2. Advanced lung adenocarcinoma organoids can predict patient treatment responses to a TKI monotherapy. A, Swimmers' plot showing clinical annotations of 9 patients with NSCLC who received subsequent TKI therapy after their tumor specimens were obtained to generate organoids. Each bar represents an individual patient. Subsequent TKI therapy each patient received is indicated on the right. B, Supplementary Table summarizing correlations between clinical responses (PFS) in patients and in vitro responses (mean IC50 value from three independent experiments at 3 days) in matching PDOs. C, Bar graphs showing percentage change of cell viability in PDOs after exposure to each TKI at 100 nmol/L for 3 days. Bar colors represent each patient whose best response was stable disease (red) or partial response (blue) to the TKI. Data are presented as the mean ± SEM (n = 3). PR, partial response; SD, stable disease. See also Supplementary Table S2.
Figure 2.
Advanced lung adenocarcinoma organoids can predict patient treatment responses to a TKI monotherapy. A, Swimmers' plot showing clinical annotations of 9 patients with NSCLC who received subsequent TKI therapy after their tumor specimens were obtained to generate organoids. Each bar represents an individual patient. Subsequent TKI therapy each patient received is indicated on the right. B, Supplementary Table summarizing correlations between clinical responses (PFS) in patients and in vitro responses (mean IC50 value from three independent experiments at 3 days) in matching PDOs. C, Bar graphs showing percentage change of cell viability in PDOs after exposure to each TKI at 100 nmol/L for 3 days. Bar colors represent each patient whose best response was stable disease (red) or partial response (blue) to the TKI. Data are presented as the mean ± SEM (n = 3). PR, partial response; SD, stable disease. See also Supplementary Table S2.
Figure 3. Drug sensitivity to gefitinib is associated with culture condition in YUO-004. A, Procedure for generating 2D PDOs. 3D PDOs were plated on collagen-coated plates and cultured in AO medium for more than a week up to 4 weeks. B, Comparison of IC50 values to each TKI (top) between 3D and 2D PDOs (two-tailed Student t test: n.s., not significant; **, P < 0.01; ***, P < 0.005). Red line denotes sensitive (IC50 value < 100 nmol/L) or resistant (IC50 value > 100 nmol/L) response to a drug. C, DNA chromatograms showing EGFR L747P mutation in 3D culture and 2D culture of YUO-050 and YUO-004. D, Scheme for model switching. 2D PDOs that were maintained as monolayer less than 4 weeks were switched to 3D culture condition and cultured for up to 4 weeks. All models were maintained in AO medium. E, 3D, 2D, and 2D–3D cultures of YUO-050 and YUO-004 were treated with the indicated concentrations of gefitinib for 3 days. IC50 value of gefitinib is indicated for each culture condition (top). F, Representative immunoblots of indicated molecules in YUO-050 and YUO-004 at baseline. G, Representative immunoblots of indicated molecules in YUO-050 and YUO-004 at baseline. H, 3D YUO-050 and YUO-004 were treated with dasatinib alone, gefitinib alone, or gefitinib in combination with the indicated concentrations of dasatinib for 3 days. I, Representative immunoblots of indicated molecules in YUO-004 treated with the indicated concentration of gefitinib with or without dasatinib. In B, E, and H, data are presented as the mean ± SEM (n = 3).
Figure 3.
Drug sensitivity to gefitinib is associated with culture condition in YUO-004. A, Procedure for generating 2D PDOs. 3D PDOs were plated on collagen-coated plates and cultured in AO medium for more than a week up to 4 weeks. B, Comparison of IC50 values to each TKI (top) between 3D and 2D PDOs (two-tailed Student t test: n.s., not significant; **, P < 0.01; ***, P < 0.005). Red line denotes sensitive (IC50 value < 100 nmol/L) or resistant (IC50 value > 100 nmol/L) response to a drug. C, DNA chromatograms showing EGFR L747P mutation in 3D culture and 2D culture of YUO-050 and YUO-004. D, Scheme for model switching. 2D PDOs that were maintained as monolayer less than 4 weeks were switched to 3D culture condition and cultured for up to 4 weeks. All models were maintained in AO medium. E, 3D, 2D, and 2D–3D cultures of YUO-050 and YUO-004 were treated with the indicated concentrations of gefitinib for 3 days. IC50 value of gefitinib is indicated for each culture condition (top). F, Representative immunoblots of indicated molecules in YUO-050 and YUO-004 at baseline. G, Representative immunoblots of indicated molecules in YUO-050 and YUO-004 at baseline. H, 3D YUO-050 and YUO-004 were treated with dasatinib alone, gefitinib alone, or gefitinib in combination with the indicated concentrations of dasatinib for 3 days. I, Representative immunoblots of indicated molecules in YUO-004 treated with the indicated concentration of gefitinib with or without dasatinib. In B, E, and H, data are presented as the mean ± SEM (n = 3).
Figure 4. PDOs recapitulate a clinical response to dabrafenib/trametinib combination therapy against EGFR exon 19 deletion plus BRAF G464A mutation. A, Summary of NGS analyses in liquid and tissue biopsies and YUO-071. B, CT scans showing tumor (red arrows) at disease progression to osimertinib (left) and after dabrafenib plus trametinib combination therapy (right) in a patient from which YUO-071 was generated. C, YUO-071 was treated with the indicated concentrations of osimertinib (far left), cetuximab (left), brigatinib with or without cetuximab at the indicated concentrations (right), and dabrafenib alone, trametinib alone, or trametinib plus dabrafenib at the indicated concentrations (far right) for 5 days. D, YUO-071 was exposed to osimertinib, dabrafenib, trametinib, dabrafenib plus trametinib, cetuximab, brigatinib, cetuximab plus brigatinib at the indicated concentrations for 15 days (left). Relative cell viability of YUO-071 before (day 0) and after the long-term exposure (day 15) to dabrafenib plus trametinib is shown on the right panel. E, Representative immunofluorescence images of indicated molecules in YUO-071 treated with control or 100 nmol/L dabrafenib in combination with 100 nmol/L trametinib for 5 days. Scale bar, 100 μmol/L. F, Bar graphs showing quantification of Ki-67–positive cells (left) and cleaved caspase 3–positive cells (right) in each group from E. In C, D, and F, data are presented as the mean ± SEM (n = 3; two-tailed Student t test). N/D, none detected.
Figure 4.
PDOs recapitulate a clinical response to dabrafenib/trametinib combination therapy against EGFR exon 19 deletion plus BRAF G464A mutation. A, Summary of NGS analyses in liquid and tissue biopsies and YUO-071. B, CT scans showing tumor (red arrows) at disease progression to osimertinib (left) and after dabrafenib plus trametinib combination therapy (right) in a patient from which YUO-071 was generated. C, YUO-071 was treated with the indicated concentrations of osimertinib (far left), cetuximab (left), brigatinib with or without cetuximab at the indicated concentrations (right), and dabrafenib alone, trametinib alone, or trametinib plus dabrafenib at the indicated concentrations (far right) for 5 days. D, YUO-071 was exposed to osimertinib, dabrafenib, trametinib, dabrafenib plus trametinib, cetuximab, brigatinib, cetuximab plus brigatinib at the indicated concentrations for 15 days (left). Relative cell viability of YUO-071 before (day 0) and after the long-term exposure (day 15) to dabrafenib plus trametinib is shown on the right panel. E, Representative immunofluorescence images of indicated molecules in YUO-071 treated with control or 100 nmol/L dabrafenib in combination with 100 nmol/L trametinib for 5 days. Scale bar, 100 μmol/L. F, Bar graphs showing quantification of Ki-67–positive cells (left) and cleaved caspase 3–positive cells (right) in each group from E. In C, D, and F, data are presented as the mean ± SEM (n = 3; two-tailed Student t test). N/D, none detected.
Figure 5. PDOs predict clinical activity of afatinib against EGFR L747P mutation. A, YUO-004 and YUO-050 were treated with the indicated concentrations of gefitinib, erlotinib, dacomitinib, afatinib, osimertinib, and lazertinib for 3 days. First-generation EGFR-TKIs are colored in dark, second-generation EGFR-TKIs are in red, and third-generation EGFR-TKIs are in blue. Data are presented as the mean ± SEM (n = 3). B, Representative immunoblots of indicated molecules in YUO-004 and YUO-050 treated with the indicated concentrations of gefitinib, afatinib, and osimertinib for 6 hours. C, Tumor growth curve of YUO-004 xenografts treated with indicated drugs at 25 mg/kg once daily (n = 6 per group; one-way ANOVA with Dunnett's posttest: n.s., not significant; **, P < 0.005 vs. vehicle; ##, P < 0.01 vs. afatinib). D, Immunoblots of indicated molecules in tumor samples obtained from YUO-004 xenografts treated with vehicle and 25 mg/kg gefitinib, afatinib, and osimertinib for 30 days.
Figure 5.
PDOs predict clinical activity of afatinib against EGFR L747P mutation. A, YUO-004 and YUO-050 were treated with the indicated concentrations of gefitinib, erlotinib, dacomitinib, afatinib, osimertinib, and lazertinib for 3 days. First-generation EGFR-TKIs are colored in dark, second-generation EGFR-TKIs are in red, and third-generation EGFR-TKIs are in blue. Data are presented as the mean ± SEM (n = 3). B, Representative immunoblots of indicated molecules in YUO-004 and YUO-050 treated with the indicated concentrations of gefitinib, afatinib, and osimertinib for 6 hours. C, Tumor growth curve of YUO-004 xenografts treated with indicated drugs at 25 mg/kg once daily (n = 6 per group; one-way ANOVA with Dunnett's posttest: n.s., not significant; **, P < 0.005 vs. vehicle; ##, P < 0.01 vs. afatinib). D, Immunoblots of indicated molecules in tumor samples obtained from YUO-004 xenografts treated with vehicle and 25 mg/kg gefitinib, afatinib, and osimertinib for 30 days.
Figure 6. PDOs can identify effective therapies for advanced lung adenocarcinoma harboring ERBB2 exon 20 insertions or RET rearrangements. A, YUO-046 and YUO-058 harboring ERBB2 exon 20 insertions were treated with the indicated concentrations of gefitinib, lapatinib, neratinib, afatinib, and poziotinib for 5 days. B, Representative immunoblots of indicated molecules in YUO-046 and YUO-058 treated with the indicated concentrations of gefitinib, lapatinib, neratinib, afatinib, and poziotinib for 6 hours. C, IC50 values of gefitinib, lapatinib, neratinib, afatinib, and poziotinib in YUO-053, a normal-like organoid, and tumor organoids harboring ERBB2 exon 20 insertions. D, Bar graphs showing mean relative IC50 values of the ERBB2 inhibitors in ERBB2-mutant organoids to the normal organoid. E, YUO-017 and YUO-049 harboring RET fusions were treated with the indicated concentrations of vandetanib, lenvatinib, cabozantinib, and pralsetinib for 5 days. F, Representative immunoblots of indicated molecules in YUO-017 and YUO-049 treated with the indicated concentrations of cabozantinib, pralsetinib, vandetanib, and lenvatinib for 2 hours. G, IC50 values of vandetanib, lenvatinib, cabozantinib, and pralsetinib in a normal-like organoid and tumor organoids harboring RET rearrangements. H, Bar graphs showing mean relative IC50 values of the RET inhibitors in RET fusion positive organoids to the normal organoid. In A and E, data are presented as the mean ± SEM (n = 3). In C and G, mean IC50 values were calculated from three biological replicates (three technical replicates per independent experiment) using GraphPad Prism. In D and H, data are presented as the mean ± SD (n = 2).
Figure 6.
PDOs can identify effective therapies for advanced lung adenocarcinoma harboring ERBB2 exon 20 insertions or RET rearrangements. A, YUO-046 and YUO-058 harboring ERBB2 exon 20 insertions were treated with the indicated concentrations of gefitinib, lapatinib, neratinib, afatinib, and poziotinib for 5 days. B, Representative immunoblots of indicated molecules in YUO-046 and YUO-058 treated with the indicated concentrations of gefitinib, lapatinib, neratinib, afatinib, and poziotinib for 6 hours. C, IC50 values of gefitinib, lapatinib, neratinib, afatinib, and poziotinib in YUO-053, a normal-like organoid, and tumor organoids harboring ERBB2 exon 20 insertions. D, Bar graphs showing mean relative IC50 values of the ERBB2 inhibitors in ERBB2-mutant organoids to the normal organoid. E, YUO-017 and YUO-049 harboring RET fusions were treated with the indicated concentrations of vandetanib, lenvatinib, cabozantinib, and pralsetinib for 5 days. F, Representative immunoblots of indicated molecules in YUO-017 and YUO-049 treated with the indicated concentrations of cabozantinib, pralsetinib, vandetanib, and lenvatinib for 2 hours. G, IC50 values of vandetanib, lenvatinib, cabozantinib, and pralsetinib in a normal-like organoid and tumor organoids harboring RET rearrangements. H, Bar graphs showing mean relative IC50 values of the RET inhibitors in RET fusion positive organoids to the normal organoid. In A and E, data are presented as the mean ± SEM (n = 3). In C and G, mean IC50 values were calculated from three biological replicates (three technical replicates per independent experiment) using GraphPad Prism. In D and H, data are presented as the mean ± SD (n = 2).

Similar articles

Cited by

References

    1. Yang C-Y, Yang JC-H, Yang P-C. Precision management of advanced non–small cell lung cancer. Annu Rev Med 2020;71:117–36. - PubMed
    1. National Comprehensive Cancer Network. Non-small cell lung cancer (version 8. 2020). Available from: https://www.nccn.org/professionals/physician_gls/pdf/nscl.pdf.
    1. Lim SM, Kim HR, Lee J-S, Lee KH, Lee Y-G, Min YJ, et al. . Open-label, multicenter, phase II study of ceritinib in patients with non–small-cell lung cancer harboring ROS1 rearrangement. J Clin Oncol 2017;35:2613–8. - PubMed
    1. Mok TS, Wu Y-L, Thongprasert S, Yang C-H, Chu D-T, Saijo N, et al. . Gefitinib or carboplatin–paclitaxel in pulmonary adenocarcinoma. N Engl J Med 2009;361:947–57. - PubMed
    1. Planchard D, Besse B, Groen HJ, Souquet P-J, Quoix E, Baik CS, et al. . Dabrafenib plus trametinib in patients with previously treated BRAFV600E-mutant metastatic non-small cell lung cancer: an open-label, multicentre phase 2 trial. Lancet Oncol 2016;17:984–93. - PMC - PubMed

Publication types

MeSH terms

Substances