. 2021 Jul;31(7):1230-1244.
doi: 10.1101/gr.273771.120. Epub 2021 Jun 3.

Polycomb-dependent differential chromatin compartmentalization determines gene coregulation in Arabidopsis

Affiliations

Polycomb-dependent differential chromatin compartmentalization determines gene coregulation in Arabidopsis

Ying Huang et al. Genome Res. 2021 Jul.

Abstract

In animals, distant H3K27me3-marked Polycomb targets can establish physical interactions forming repressive chromatin hubs. In plants, growing evidence suggests that H3K27me3 acts directly or indirectly to regulate chromatin interactions, although how this histone modification modulates 3D chromatin architecture remains elusive. To decipher the impact of the dynamic deposition of H3K27me3 on the Arabidopsis thaliana nuclear interactome, we combined genetics, transcriptomics, and several 3D epigenomic approaches. By analyzing mutants defective for histone H3K27 methylation or demethylation, we uncovered the crucial role of this chromatin mark in short- and previously unnoticed long-range chromatin loop formation. We found that a reduction in H3K27me3 levels led to a decrease in the interactions within Polycomb-associated repressive domains. Regions with lower H3K27me3 levels in the H3K27 methyltransferase clf mutant established new interactions with regions marked with H3K9ac, a histone modification associated with active transcription, indicating that a reduction in H3K27me3 levels induces a global reconfiguration of chromatin architecture. Altogether, our results reveal that the 3D genome organization is tightly linked to reversible histone modifications that govern chromatin interactions. Consequently, nuclear organization dynamics shapes the transcriptional reprogramming during plant development and places H3K27me3 as a key feature in the coregulation of distant genes.


Figures

Figure 1.
Figure 1.
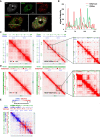
Arabidopsis chromatin organization displays strong compartmentalization. (A) Immunofluorescence detection of H3K9ac (green) and H3K27me3 (red) histone modifications and DAPI staining (gray) in an isolated Arabidopsis nucleus. (Scale bar) 5 μm. (B) Distribution of immunofluorescence signal intensity in the nucleus. The analysis was performed along the white line shown in the merged image in A. (C) Visualization of the interaction matrix of Hi-C and HiChIP in a specific region of Chromosome 2. H3K9ac ChIP-seq signal (blue peaks) were aligned with the maps to highlight the correlation with HiChIP enriched regions as expected. (D) Visualization of the interaction matrix of Hi-C and HiChIP in a specific region of Chromosome 4. H3K27me3 ChIP-seq signal (red peaks) were aligned with the maps to highlight the correlation with HiChIP enriched regions as expected. (E) Visualization of the interaction matrix of HiChIP data of H3K9ac and H3K27me3 in a specific region of Chromosome 2. Dots showing higher (blue) and lower (red) signals in H3K9ac HiChIP compared to H3K27me3, respectively. ChIP-seq signals of H3K9ac (blue peaks) and H3K27me3 (red peaks) were aligned with the map to highlight the correlation with HiChIP enriched regions.
Figure 2.
Figure 2.
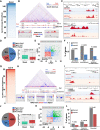
Shoot and root nuclei display distinct 3D chromatin architectures. (A) Heatmap showing the H3K27me3 HiChIP signal of the top shoot-specific repressive loops (SSRLs). (B) Example of long-distance SSRL on Chromosome 5. ChIP-seq signals of H3K27me3 in shoot (red peaks) and root (blue peaks) were aligned with the map and the differential analysis of both ChIP-seq signals in differentially interacting regions are highlighted (bottom panels in gray). (C) Example of short distance SSRL. H3K27me3 ChIP-seq signal is represented by red peaks and chromatin interactions signal by blue lines. (D) Analysis of H3K27me3 levels on SSRLs. The pie chart represents the percentage of the genes involved in SSRLs that are either hypermethylated in shoot or in root. The box plot shows the H3K27me3 levels in shoot or root of the 47% of shoot hypermethylated genes involved in SSRLs. (E) Scatterplot of log2 (shoot/root gene expression fold change) for pairs of genes interacting through H3K27me3-associated contacts in shoot. (F) Gene Ontology enrichment analysis of the differentially expressed genes involved in SSRLs. (G) Heatmap of H3K27me3 HiChIP signal of the top root-specific repressive loops (RSRLs). (H) Example of long-distance RSRLs on Chromosome 1. ChIP-seq signals of H3K27me3 in shoot (red peaks) and root (blue peaks) were aligned with the map and the differential analysis of both ChIP-seq signals in differentially interacting regions are highlighted (bottom panels in gray). (I) Example of short distance RSRLs. (J) Analysis of H3K27me3 level over RSRLs. The pie chart represents the percentage of genes involved in RSRLs that are either hypermethylated in shoot or root. The box plot displayed the H3K27me3 levels of the 48% of root hypermethylated genes involved in RSRLs. (K) Scatterplot of log2 (shoot/root gene expression fold change) for pairs of genes interacting through H3K27me3-associated contacts in root. (L) Gene Ontology enrichment analysis of the differentially expressed genes involved in RSRLs.
Figure 3.
Figure 3.
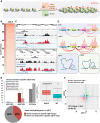
The levels of H3K27me3 correlate with the stability of repressive loops. (A) Visualization of the interaction matrix of Hi-C and C-Hi-C in a specific region of Chromosome 1. (B) Example of interaction analysis using C-Hi-C data showing captured regions (green bars), H3K27me3 ChIP-seq signal (red peaks), and chromatin interactions (purple lines). (C) Heatmap of C-Hi-C data showing the shoot-specific loops (SSLs). (D) Examples of the shoot-specific interacting region detected by both C-Hi-C and H3K27me3 HiChIP. Probes used for the C-Hi-C are represented by green bars, the H3K27me3 ChIP-seq signal by red peaks, the C-Hi-C interaction signals by purple lines, and H3K27me3 HiChIP interaction signals by blue lines. (E) Venn diagram representing overlap of loops called from HiChIP and C-Hi-C library sets. Only loops containing specific probes were selected for the comparison in HiChIP. (F) Pie chart representing the proportion of genes involved in shoot-specific loops that are repressed in shoot (blue, 67%), repressed genes in root (red, 24%), and unchanged (gray, 9%) among the genes involved in loops detected both with HiChIP and C-Hi-C. (G) Heatmap of C-Hi-C data showing the top root-specific loops (RSLs). (H) Examples of root-specific interacting region detected by both C-Hi-C and H3K27me3 HiChIP. Probes used for the C-Hi-C are represented by green bars, the H3K27me3 ChIP-seq signal by red peaks, the C-Hi-C interaction signals by purple lines, and H3K27me3 HiChIP interaction signals by blue lines. (I) Venn diagram representing overlap of loops called from HiChIP and C-Hi-C library sets. Only loops containing specific probes were selected for the comparison in HiChIP. (J) Pie chart representing genes involved in RSLs that are repressed in shoot (blue, 35%), repressed genes in root (red, 54%), and unchanged (gray, 11%) among the genes involved in loops detected both with HiChIP and C-Hi-C.
Figure 4.
Figure 4.
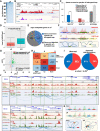
Ectopic deposition of H3K27me3 leads to formation of new chromatin repressive loops. (A) Schema illustrating the antagonistic role of the PRC2 complex (involving the histone methyltransferase CLF) and the histone demethylase REF6 to control H3K27me3 homeostasis and chromatin remodeling. (B) Heatmap of C-Hi-C data showing ref6-5 specific loops (reSLs). (C) Examples of reSLs detected by C-Hi-C. C-Hi-C interaction signal (blue lines) and H3K27me3 ChIP-seq signal in wild type (black peaks) and ref6-5 (red peaks) are represented. (D) Model of chromatin contacts organization in wild type and ref6-5 mutant. (E) Histogram representing the percentage of genes (observed [O] or expected [E]) involved in reSLs that are either hyper- or hypomethylated in ref6-5 compared to WT. To obtain the expected proportion, we shuffled the H3K27me3 signals 1000 times to obtain the randomized gene counts. The mean of the 1000 permutations was used to determine the expected proportions. Asterisk indicates significant difference (P-value < 2.2 × 10⁻¹⁶, test of proportions). The bottom pie chart represents the percentage of ref6-5 hypermethylated genes involved in reSLs. The box plot displays the H3K27me3 levels of the 40% of ref6-5 hypermethylated genes involved on reSLs. (F) Scatterplot of log2 (ref6-5/wild-type gene expression fold change) for pairs of genes interacting specifically in ref6-5 compared to wild-type.
Figure 5.
Figure 5.
Reduction of H3K27me3 levels induces a reconfiguration of chromatin architecture. (A) Heatmap of C-Hi-C data showing loops that are weaker in clf mutant than in wild type. (B) Example of C-Hi-C interactions displaying disrupted loops in clf compared to wild type. C-Hi-C interactions (blue lines) and H3K27me3 ChIP-seq signal in wild type (red peaks) and clf (purple peaks) are represented. (C) Histogram representing the percentage of genes (observed [O] or expected [E]) involved in cSDLs that are either hyper- or hypomethylated in clf compared to WT. To obtain the expected proportion, we shuffled the H3K27me3 signals 1000 times to obtain the randomized gene counts. The mean of the 1000 permutations was used to determine the expected proportions. Asterisk indicates significant difference (P-value < 2.2 × 10⁻¹⁶, test of proportions). (D) The box plot displays the H3K27me3 levels of the 40% of clf hypomethylated genes involved in cSDLs. (E) The pie chart represents the percentage of clf hypomethylated genes involved in cSDLs. (F) Model of chromatin contacts organization in wild type and clf mutant. (G) Scatterplot of log2 (clf/wild-type gene expression fold change) for pairs of genes interacting specifically in wild type compared to clf. (H) Heatmap presenting the log2 of odd ratios of combinations of features of interacting genes (Results). Positive log2 (odd ratio) indicates enrichment and negative indicates depletion. (I) Pie chart representing the proportion of loops involving a gene H3K27me3 hypomethylated and a gene marked or not by H3K9ac in clf mutant. (Hypo-H3K27me3) No H3K9ac loops in clf mutant (blue: 40% observed and 61% expected, respectively); (Hypo-H3K27me3) H3K9ac loops (red: 60% observed and 39% expected, respectively). (J) Examples of C-Hi-C interactions of a region losing H3K27me3 in clf and that tend to establish interactions with regions marked with H3K9ac euchromatin histone modification. C-Hi-C interactions (blue lines), H3K9ac ChIP-seq signal in wild type and clf (green peaks), H3K27me3 ChIP-seq signal in wild type and clf (red peaks) are represented. (K) Model of chromatin contacts organization in wild type and clf mutant.
Figure 6.
Figure 6.
Histone modifiers control chromatin architecture by triggering formation of chromatin repressive or active domains to allow gene coregulation. Model of the formation of tissue-specific active and repressive chromatin domains in Arabidopsis seedlings. The green structures represent active compartments, which are associated with H3K9ac-marked euchromatin. The pink structures represent PcG-repressive compartments, which are associated with H3K27me3-marked facultative heterochromatin.

References

    1. Ahmad A, Zhang Y, Cao X. 2010. Decoding the epigenetic language of plant development. Mol Plant 3: 719–728. 10.1093/mp/ssq026 - DOI - PMC - PubMed
    1. Antunez-Sanchez J, Naish M, Ramirez-Prado JS, Ohno S, Huang Y, Dawson A, Opassathian K, Manza-Mianza D, Ariel F, Raynaud C, et al. 2020. A new role for histone demethylases in the maintenance of plant genome integrity. eLife 9: e58533. 10.7554/eLife.58533 - DOI - PMC - PubMed
    1. Bantignies F, Roure V, Comet I, Leblanc B, Schuettengruber B, Bonnet J, Tixier V, Mas A, Cavalli G. 2011. Polycomb-dependent regulatory contacts between distant Hox loci in Drosophila. Cell 144: 214–226. 10.1016/j.cell.2010.12.026 - DOI - PubMed
    1. Berry S, Rosa S, Howard M, Bühler M, Dean C. 2017. Disruption of an RNA-binding hinge region abolishes LHP1-mediated epigenetic repression. Genes Dev 31: 2115–2120. 10.1101/gad.305227.117 - DOI - PMC - PubMed
    1. Boettiger AN, Bintu B, Moffitt JR, Wang S, Beliveau BJ, Fudenberg G, Imakaev M, Mirny LA, Wu CT, Zhuang X. 2016. Super-resolution imaging reveals distinct chromatin folding for different epigenetic states. Nature 529: 418–422. 10.1038/nature16496 - DOI - PMC - PubMed