Comparative Study
. 2021 Jun;9(6):e002181.
doi: 10.1136/jitc-2020-002181.

Deep immune profiling reveals targetable mechanisms of immune evasion in immune checkpoint inhibitor-refractory glioblastoma

Affiliations
Comparative Study

Deep immune profiling reveals targetable mechanisms of immune evasion in immune checkpoint inhibitor-refractory glioblastoma

Erin F Simonds et al. J Immunother Cancer. 2021 Jun.

Abstract

Background: Glioblastoma (GBM) is refractory to immune checkpoint inhibitor (ICI) therapy. We sought to determine to what extent this immune evasion is due to intrinsic properties of the tumor cells versus the specialized immune context of the brain, and if it can be reversed.

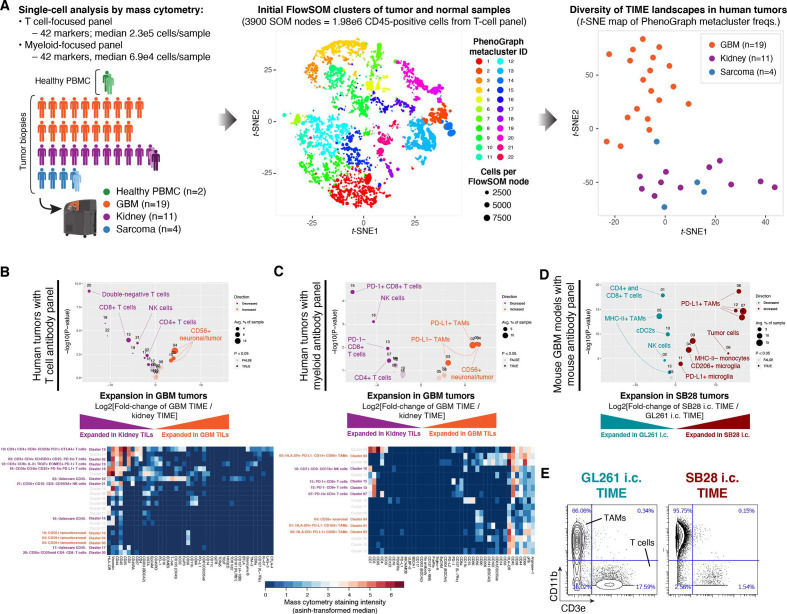
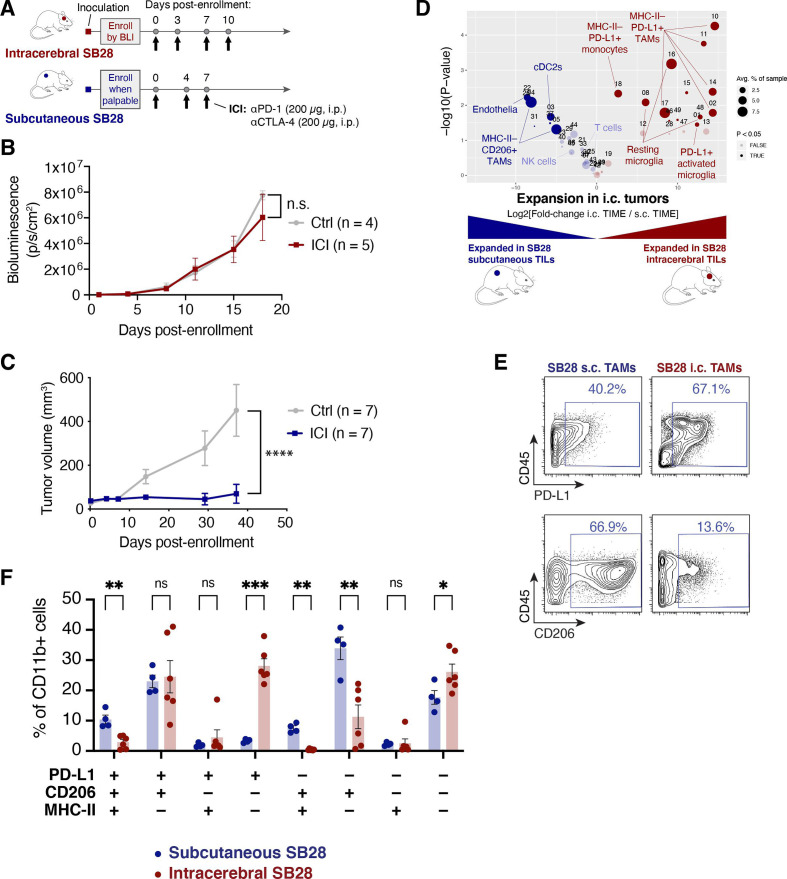
Methods: We used CyTOF mass cytometry to compare the tumor immune microenvironments (TIME) of human tumors that are generally ICI-refractory (GBM and sarcoma) or ICI-responsive (renal cell carcinoma), as well as mouse models of GBM that are ICI-responsive (GL261) or ICI-refractory (SB28). We further compared SB28 tumors grown intracerebrally versus subcutaneously to determine how tumor site affects TIME and responsiveness to dual CTLA-4/PD-1 blockade. Informed by these data, we explored rational immunotherapeutic combinations.

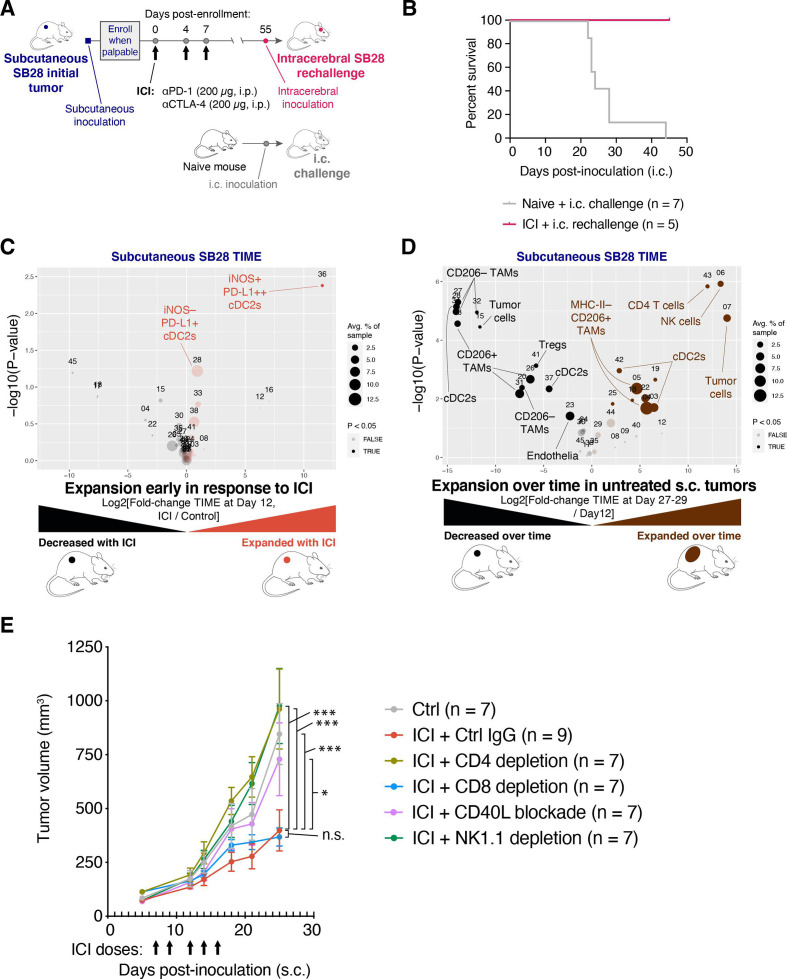
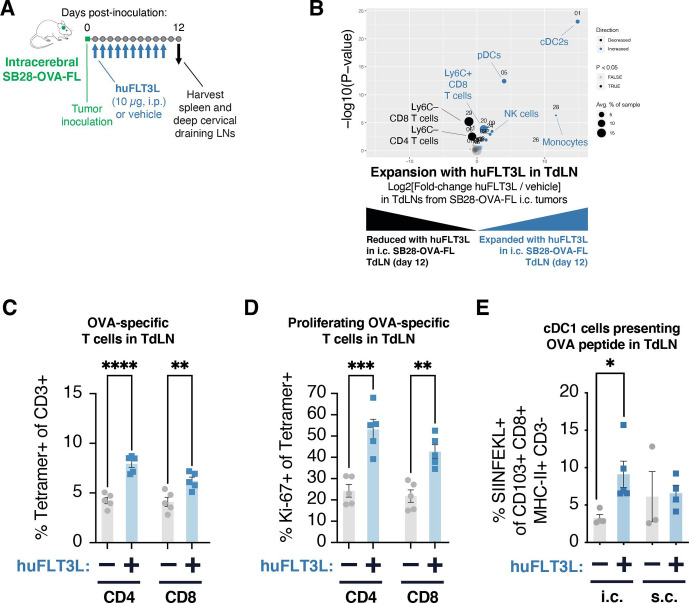
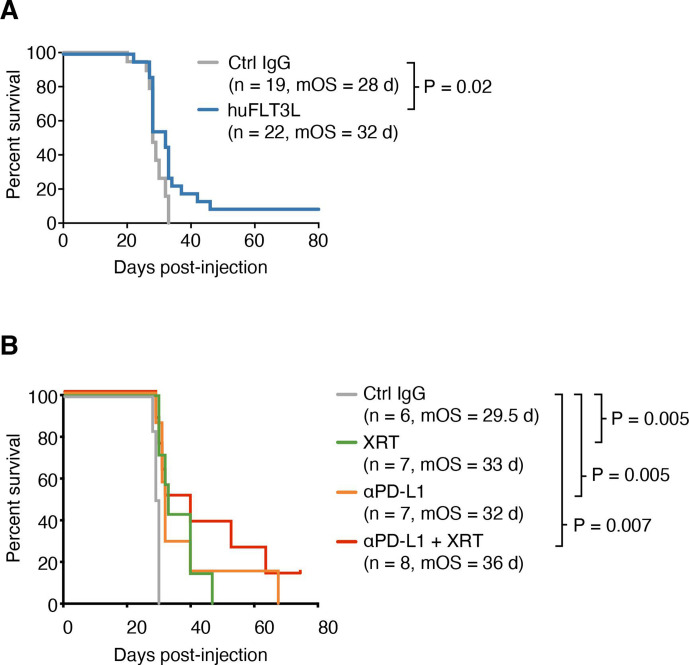
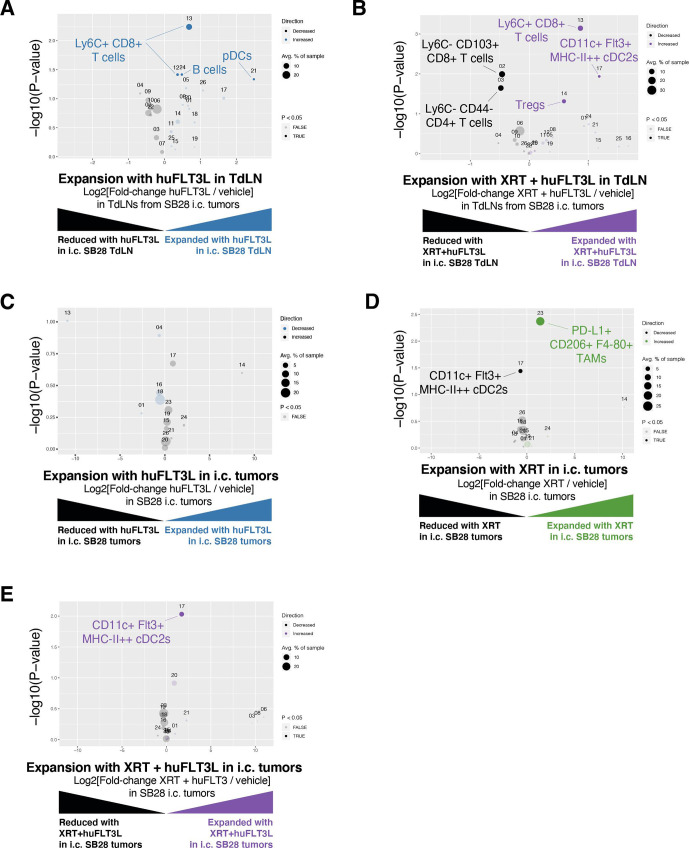
Results: ICI-sensitivity in human and mouse tumors was associated with increased T cells and dendritic cells (DCs), and fewer myeloid cells, in particular PD-L1+ tumor-associated macrophages. The SB28 mouse model of GBM responded to ICI when grown subcutaneously but not intracerebrally, providing a system to explore mechanisms underlying ICI resistance in GBM. The response to ICI in the subcutaneous SB28 model required CD4 T cells and NK cells, but not CD8 T cells. Recombinant FLT3L expanded DCs, improved antigen-specific T cell priming, and prolonged survival of mice with intracerebral SB28 tumors, but at the cost of increased Tregs. Targeting PD-L1 also prolonged survival, especially when combined with stereotactic radiation.

Conclusions: Our data suggest that a major obstacle for effective immunotherapy of GBM is poor antigen presentation in the brain, rather than intrinsic immunosuppressive properties of GBM tumor cells. Deep immune profiling identified DCs and PD-L1+ tumor-associated macrophages as promising targetable cell populations, which was confirmed using therapeutic interventions in vivo.

Keywords: biomarkers; brain neoplasms; dendritic cells; immunotherapy; tumor; tumor microenvironment.


Conflict of interest statement

Competing interests: There are no competing interests.

Figures

Figure 1
Figure 1
Abundant PD-L1+ tumor-associated macrophages and lack of MHC-II+ antigen-presenting cells are associated with resistance to dual CTLA-4/PD-1 checkpoint blockade. (A) Immune profiles were obtained from 39 samples: 19 glioblastoma (GBM) primary tumor biopsies, 11 renal cell carcinoma (RCC) primary tumor biopsies (one with paired tumor-adjacent normal tissue and metastatic lesion), 4 sarcoma primary tumor biopsies (one with paired tumor-adjacent normal tissue) and peripheral blood mononuclear cells (PBMC) from one healthy donor (with paired unstimulated and phytohemagglutinin-stimulated aliquots). Single-cell mass cytometry data were acquired using T cell-focused and myeloid-focused antibody panels with 42 markers each (see the Materials and methods section and online supplemental tables S2 and S3). Data were filtered on CD45-positive cells and processed using the PhenoGraph+FlowSOM analysis pipeline to segregate immune cell types into metaclusters and quantify their frequency across samples. To compare the overall tumor immune microenvironment (TIME) landscape across patients, metacluster frequencies for each primary tumor were fed into the t-stochastic neighbor embedding (t-SNE) dimensionality reduction algorithm to produce a map of TIME landscapes, organized spatially by similarity. Data from the T cell panel are shown in all plots; corresponding plots for the myeloid panel are in online supplemental figure S1A, B. (B) Volcano plot comparing abundance of immune cell populations (clusters) in GBM (orange) versus RCC (purple) tumor biopsies stained with the CyTOF human T-cell antibody panel. Statistically significant clusters in volcano plots are highlighted in opaque color and indicated with a cell type label. Diameter of the circle indicates the mean frequency of cells in the sample assigned to that cluster. Heatmap indicates manually annotatedcluster phenotypes and median intensity of antibody staining in each cluster. (C) Volcano plot and heatmap as in (B), stained with the CyTOF human myeloid antibody panel. (D) Volcano plot as in (B) comparing abundance of immune cell populations in mouse GBM models SB28 (red) and GL261 (teal) stained with the CyTOF mouse antibody panel. (E) Biaxial plots of representative raw CyTOF single-cell measurements of CD11b and CD3e on dissociated CD45+ cells from GL261 or SB28 tumors. These represent two of the 42 CyTOF mass cytometry channels, and two of the tumor biopsies, used to produce the volcano plot in (D). The staining patterns typical of tumor-associated macrophages (CD11b+), T-cells (CD3e+), and tumor cells (CD11b− CD3e−) are indicated, but clustering was performed using a total of 38 antibody markers (see online supplemental table S4).
Figure 2
Figure 2
Subcutaneous SB28 tumors differ from intracerebral tumors in responsiveness to immune checkpoint inhibitor (ICI) treatment and in phenotypes of tumor-associated macrophages (TAMs) in the tumor immune microenvironment (TIME). (A) Schematic illustration of dual CTLA-4/+PD-1 blockade dosing schedule for intracerebral or subcutaneous SB28 tumors. (B) Bioluminescence measurements of SB28 injected intracerebrally and treated with IgG control (gray) or ICI (red). Statistical test: mixed-effects model (n.s.: p>0.05). Error bars: SEM. (C) Tumor volume measurements of SB28 injected subcutaneously and treated with IgG control (gray) or ICI (blue). Statistical test: repeated measures two-wayanalysis of variance (ANOVA; ****p≤0.0001). Error bars: SEM. (D) Volcano plot comparing abundance of tumor-infiltrating leukocyte (TIL) subpopulations in dissociated intracerebral (i.c., red) and subcutaneous (s.c., blue) SB28 tumors using the CyTOF mouse immune cell panel. Statistically significant clusters in volcano plots are highlighted in opaque color and indicated with a cell type label. (E) Biaxial plots of representative raw CyTOF single-cell measurements of CD45, PD-L1, and CD206 on dissociated SB28 subcutaneous or intracerebral tumors. Only CD11b+ events are shown. (F) Mass cytometry data from SB28 subcutaneous or intracerebral tumors were manually gated as shown in (E) on CD11b+ TAMs expressing or lacking PD-L1, CD206, or MHC-II. Frequencies of TAMs expressing all possible permutations of these three markers were quantified. Student’s t-test (***p≤0.001; **p≤0.01; *p≤0.05; n.s.: p>0.05).
Figure 3
Figure 3
Immune checkpoint inhibitor (ICI) treatment of SB28 subcutaneous tumors can elicit systemic memory and requires similar immune subsets to those involved in natural immune surveillance. (A) Schematic illustration of dosing schedule for SB28 intracerebral tumor rechallenge. (B) Mice previously cured of SB28 subcutaneous tumors (pink line) were rechallenged with SB28 intracerebral tumors. Survival was compared to naive mice (gray line) challenged with SB28 intracerebral tumors and illustrated in a Kaplan-Meier curve. No treatments were administered. (C) Volcano plot comparing abundance of immune subpopulations in dissociated subcutaneous SB28 tumors on day 12 after ICI treatment (orange) versus isotype control treatment (black), using the mouse immune cell panel. Statistically significant clusters in volcano plots are highlighted in opaque color and indicated with a cell type label. (D) Volcano plot as in (C) comparing abundance of immune subpopulations in dissociated subcutaneous SB28 tumors on day 27–29 (brown) versus day 12 (black). (E) Tumor volume measurements of SB28 subcutaneous tumors treated with control IgG (gray) or ICI in the context of either CD4 T cell depletion (light green), CD8 T cell depletion (blue), CD40L blockade (orange), or NK cell depletion (dark green). Depleting or blocking antibodies were administered starting on day −3 or day 0, as described in online supplemental table S6. ICI was administered on days 7, 9, 12, 14, 16 as indicated (arrows). Statistical test: repeated measures two-way analysis of variance (ANOVA; ***p≤0.001; *p≤0.05; n.s.: p>0.05). Error bars: SEM. TAM, tumor-associated macrophage; TIME, tumor immune microenvironment.
Figure 4
Figure 4
Treatment with FLT3L expands multiple dendritic cell subsets and improves antigen presentation in intracerebral SB28-OVA-FL tumors. (A) Schematic illustration of dosing schedule (daily for 10 days) for SB28 intracerebral huFLT3L-Fc treatment and analysis of tumor-draining lymph nodes (TdLNs) and tumors at day 11–12 post-tumor injection. (B) Treatment with huFLT3L expands cDC2s, pDCs, and Ly6C+ CD8 T cells in TdLNs of mice with SB28-OVA-FL tumors at day 12 post-inoculation. Volcano plot comparing abundance of immune subpopulations in TdLNs from huFLT3L-treated (blue) and control-treated (black) intracerebral SB28-OVA-FL. Statistically significant clusters in volcano plots are highlighted in opaque color and indicated with a cell type label. (C) Frequency of OVA tetramer+ CD4 and CD8 T cells (out of CD3+ T cells) from TdLNs at day 12 post-inoculation of SB28-OVA-FL tumors treated with control IgG or huFLT3L-Fc. (D) Frequency of proliferating (Ki-67+) T cells among the OVA tetramer+ cells in (C). (E) Treatment with huFLT3L improves presentation of a tumor-derived antigen. Frequency of cDC1 cells that were presenting SIINFEKL-peptide on MHC class I were quantified by flow cytometry with an anti-SIINFEKL-MHC-complex antibody. Same samples as online supplemental figure S4J.
Figure 5
Figure 5
Improved antigen presentation combined with checkpoint blockade extends survival of mice with SB28 intracerebral tumors. (A) Kaplan-Meier curves of intracerebral SB28 treated with IgG control (gray) or huFLT3L (blue). Log-rank test p values and median overall survival (mOS) are shown. Data from two experiments were aggregated. (B) Kaplan-Meier curves of intracerebral SB28 treated with IgG control (same as (B), gray), radiation (XRT, same as (B), green), anti-PD-L1 (yellow) or XRT and ant-PD-L1 (blue). Log-rank test p values and mOS are shown.
Figure 6
Figure 6
huFLT3L in combination with immunotherapy modulates dendritic cells (DCs) and T cells in the SB28 intracerebral model. (A) Volcano plot comparing abundance of immune subpopulations in tumor-draining lymph nodes (TdLNs) from intracerebral SB28 treated with huFLT3L (blue) versus control (black) using mass cytometry. Statistically significant clusters in volcano plots are highlighted in opaque color and indicated with a cell type label. (B) Volcano plot as in (A) comparing radiation (XRT)+huFLT3L (purple) versus vehicle-treated (black) in TdLNs. (C) Volcano plot comparing abundance of immune subpopulations in end stage tumors from intracerebral SB28 treated with huFLT3L (blue) versus vehicle-treated (black) using CyTOF. No statistically significant clusters were detected. (D) A single dose of radiation (10 Gy) induced PD-L1+ CD206+ (M2), tumor-associated macrophages and reduced DCs in SB28 i.c. tumors at endpoint. Volcano plot as in (C) comparing radiation therapy (XRT) (green) versus vehicle-treated (black). (E) Radiation (1×10 Gy)+FLT3L restored DCs in SB28 i.c. tumors at endpoint, compared to XRT alone. Volcano plot as in (C) comparing XRT+huFLT3L (purple) versus vehicle-treated (black).

References

    1. Stupp R, Taillibert S, Kanner A, et al. . Effect of Tumor-Treating fields plus maintenance temozolomide vs maintenance temozolomide alone on survival in patients with glioblastoma: a randomized clinical trial. JAMA 2017;318:2306–16. 10.1001/jama.2017.18718 - DOI - PMC - PubMed
    1. Ribas A, Wolchok JD. Cancer immunotherapy using checkpoint blockade. Science 2018;359:1350–5. 10.1126/science.aar4060 - DOI - PMC - PubMed
    1. Filley AC, Henriquez M, Dey M. Recurrent glioma clinical trial, CheckMate-143: the game is not over yet. Oncotarget 2017;8:91779–94. 10.18632/oncotarget.21586 - DOI - PMC - PubMed
    1. Aslan K, Turco V, Blobner J, et al. . Heterogeneity of response to immune checkpoint blockade in hypermutated experimental gliomas. Nat Commun 2020;11:931–14. 10.1038/s41467-020-14642-0 - DOI - PMC - PubMed
    1. Touat M, Li YY, Boynton AN, et al. . Mechanisms and therapeutic implications of hypermutation in gliomas. Nature 2020;580:517–23. 10.1038/s41586-020-2209-9 - DOI - PMC - PubMed

Publication types

MeSH terms