. 2021 Jul 23;373(6553):eabf7844.
doi: 10.1126/science.abf7844. Epub 2021 Jun 3.

Skull and vertebral bone marrow are myeloid cell reservoirs for the meninges and CNS parenchyma

Affiliations

Skull and vertebral bone marrow are myeloid cell reservoirs for the meninges and CNS parenchyma

Andrea Cugurra et al. Science. .

Abstract

The meninges are a membranous structure enveloping the central nervous system (CNS) that host a rich repertoire of immune cells mediating CNS immune surveillance. Here, we report that the mouse meninges contain a pool of monocytes and neutrophils supplied not from the blood but by adjacent skull and vertebral bone marrow. Under pathological conditions, including spinal cord injury and neuroinflammation, CNS-infiltrating myeloid cells can originate from brain borders and display transcriptional signatures distinct from their blood-derived counterparts. Thus, CNS borders are populated by myeloid cells from adjacent bone marrow niches, strategically placed to supply innate immune cells under homeostatic and pathological conditions. These findings call for a reinterpretation of immune-cell infiltration into the CNS during injury and autoimmunity and may inform future therapeutic approaches that harness meningeal immune cells.


Conflict of interest statement

Competing interests: JK is a member of a scientific advisory group for PureTech Health.

Figures

Fig. 1
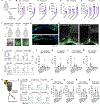
Fig. 1. CNS borders host a substantial pool of monocytes and neutrophils that is not blood derived.
(A) Experimental design for parabiosis experiments. WT mice were parabiotically joined with UBC-GFP mice and analyzed 60 days later. (B) Representative gating strategy for flow cytometry of immune cells from the cranial dura. (C) Representative histograms of GFP and GFP+ Ly6C+ monocytes and neutrophils across tissues. WT and UBC-GFP control mice without IV anti-CD45 antibody injection were used to assign gates. (D-F) Quantification of flow cytometry analysis for GFP+Ly6C+ monocytes, GFP+ neutrophils, and GFP+ CD4 T cells across tissues. NS=not significant, ***P<0.001 versus blood (One-way ANOVA with Dunnett’s post hoc test), n=8 mice per tissue, representative of 3 independent experiments. Data are means ± SEM. (G) Representative images from 3 mice of cranial and spinal dura whole mounts from WT parabionts 60 days after parabiotic pairing. Scale bars, (left) 2000 µm; (right) 50 µm. (H-K) Myeloid fate mapping strategy using LysM-CreERT2::ZsGreen reporter mice to assess the half-life of meningeal Ly6C+ monocytes and GFP+ neutrophils. Mice underwent 3 daily tamoxifen injections and were then analyzed at 4 different time points. Cre animals were used as controls to assign gates. Black outlined histograms represent Cre controls and green histograms represent LysM-CreERT2::ZsGreen reporter mice. N=3–4 mice per group, representative of 2 independent experiments. Data are means ± SEM.
Fig. 2
Fig. 2. Skull bone marrow supplies brain borders with myeloid cells.
(A) Experimental design for bone marrow egress experiments. Outer periosteal layer of the skull bone was thinned near the bone marrow sites and 1 μl of CXCR4 antagonist AMD3100 (1 µg/ml) or a vehicle was applied to five sites for 5 min. (B and C) Quantification for flow cytometry analysis of IV CD45Ly6C+ monocytes and neutrophils in cranial dura 1 day after AMD3100 administration. *P<0.05 (Student’s t test), n=3–4 mice per group, representative of 2 independent experiments. Data are means ± SEM. (D and E) Quantification for flow cytometry analysis of IV CD45 Ly6C+ monocytes and neutrophils in control tissues 1 day after AMD3100 administration. NS=not significant (Two-way ANOVA with Sidak’s post hoc test), n=3–4 mice per group, representative of 2 independent experiments. Data are means ± SEM. (F) Schematic representation of the calvaria flap transplantation experiments. Images were taken on anesthetized mice by stereomicroscopy immediately after craniotomy (left), after the subsequent calvaria flap transplantation (middle) and 30 days after the transplantation (right). (G) Representative images from 3 mice of GFP+ calvaria flaps 7 and 30 days after the transplantation. Inserts show GFP+ bone marrow 7 and 30 days after the transplantation. Dead bone marrow was replaced by non-GFP+ cells. Scale bar, 500 µm. (H) Representative images from 4 mice of cranial dura 7 and 30 days after the transplantation showing GFP+ cells below the transfer site. Scale bar, 1000 µm. (I) Representative histograms of GFP and GFP+ Ly6C+ monocytes and neutrophils across tissues. WT and UBC-GFP control mice without IV anti-CD45 antibody injection were used to assign gates. (J-M) Quantification of flow cytometry analysis of IV CD45 GFP+Ly6C+ monocytes and GFP+ neutrophils from calvaria flap transplanted mice, n=6–7 mice per group, representative of 2 independent experiments for day 7 and 3 independent experiments for day 30. Data are means ± SEM. (N) Experimental design of irradiation and bone marrow transplantation experiments with different shielding strategies. Four million GFP+ bone marrow cells were intravenously transplanted into head-shielded or body-shielded WT mice after split-dose 11 Gy irradiation. (O) Representative histograms of GFP and GFP+ Ly6C+ monocytes and neutrophils across tissues. Fully irradiated and non-irradiated mice transplanted with UBC-GFP cells without IV anti-CD45 antibody injection were used as control animals and to assign gates. (P-S) Quantification of flow cytometry analysis for IV CD45GFP+Ly6C+ monocytes and GFP+ neutrophils in BMT experiments. NS=not significant, *P<0.05, **P<0.01 versus blood (one-way ANOVA with Dunnett’s post hoc test), n=4 mice per tissue, representative of 2 independent experiments. Data are means ± SEM. BM, bone marrow.
Fig. 3
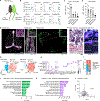
Fig. 3. The inflamed CNS is infiltrated by blood and CNS-adjacent bone marrow-derived myeloid cells.
(A) Experimental design for EAE induction in parabiotic mice. Sixty days after pairing of WT and UBC-GFP mice EAE was induced in both mice by MOG35–55 immunization and the WT mice were analyzed 15 days post-induction. (B) Representative histograms of GFP and GFP+ Ly6C+ monocytes and neutrophils neutrophils across tissues. WT and UBC-GFP control mice without IV anti-CD45 antibody injections were used to assign gates. (C and D) Quantification Submitted Manuscript: Confidential of flow cytometry analysis of IV CD45 GFP+Ly6C+ monocytes and GFP+ neutrophils in EAE-induced WT parabionts. NS=not significant, ***P<0.001 versus blood (one-way ANOVA with Dunnett’s post hoc test), n=5 mice per tissue, representative of 2 independent experiments. Data are means ± SEM. (E) Representative images from 3 mice of cranial dura, spinal dura, and spinal cord sections of WT parabionts 15 days after the EAE induction. Only a minor portion of GFP+ cells are co-stained with GR1. Scale bars, (left) 2000 µm; (middle) 2000 µm; (right) 200 µm. (F) Representative H&E and immunohistochemistry images from 5 mice of vascular channels found in vertebrae connecting bone marrow to underlying spinal dura. On the left, cells can be seen within channels connecting bone marrow and spinal dura. On the right, GR1+ infiltrates are closely associated with the CD31+ vascular channel. Scale bars, (left) 100 µm; (right) 100 µm. (G) tSNE visualizations of color-coded scRNA-seq analysis based on cell types for CD45hiIV CD45GFP or GFP+ populations from the spinal cord of WT parabionts 15 days post EAE induction. N=3 pooled mice per sample. (H) Dot plots demonstrating scaled gene expression and percentage of cells expressing these genes for cluster phenotyping markers. (I) Cluster distributions detailing proportions of cell types in IV CD45CD45hiGFP and GFP+ samples from scRNA-seq analysis. (J and K) Top 10 downregulated and upregulated GO Biological Process terms describing differentially expressed genes between GFP+ and GFP-monocytes from scRNA-seq analysis. Numbers in bar graphs represent the number of differentially expressed genes belonging to that pathway. (L) Volcano plot showing differentially expressed genes between GFP+ and GFP-monocytes from scRNA-seq analysis, inflammatory chemokines, and cytokines are highlighted.

Comment in

References

    1. Bassler K, Schulte-Schrepping J, Warnat-Herresthal S, Aschenbrenner AC, Schultze JL, The Myeloid Cell Compartment-Cell by Cell. Annu. Rev. Immunol 37, 269–293 (2019). - PubMed
    1. Guilliams M, Mildner A, Yona S, Developmental and functional heterogeneity of monocytes. Immunity 49, 595–613 (2018). - PubMed
    1. Ng LG, Ostuni R, Hidalgo A, Heterogeneity of neutrophils. Nat. Rev. Immunol 19, 255–265 (2019). - PubMed
    1. Gordon S, Plüddemann A, Tissue macrophages: heterogeneity and functions. BMC Biol 15, 53 (2017). - PMC - PubMed
    1. Ginhoux F et al., Fate mapping analysis reveals that adult microglia derive from primitive macrophages. Science 330, 841–845 (2010). - PMC - PubMed

Publication types

MeSH terms